
OUTFRONT Media Inc. OUT posted first-quarter 2026 adjusted funds from operations (AFFO) of 34 cents per share, beating the Zacks Consensus Estimate of 28 cents by 21.43%. Revenues rose 10% year over year to $429.6 million and topped expectations by 2.32%.
Results reflected stronger pricing and demand across the portfolio, with transit revenues up 22.3% and billboard yield improving 11%. Digital revenues also remained a meaningful contributor, with automated channels supporting revenue quality and mix.
OUT Sees Billboard Gains, Lifted by Condemnation Proceeds
Billboard revenues increased 7.1% year over year to $332.9 million. Management attributed the improvement to higher proceeds from condemnations and an increase in average revenue per display (yield), including the impact of programmatic platforms on digital billboard revenues.
Operationally, billboard yield increased to $2,911 per average display per month from $2,623 a year ago. The mix showed digital billboard revenues representing 29.4% of total billboard revenues in the quarter, helping support pricing even as the company continued to work through lost billboards in the period.
OUT’s Transit Momentum Remains the Standout
Transit revenues rose 22.3% year over year to $95 million. The increase was driven primarily by higher average revenues per display, partially offset by the impact of new and lost transit franchise contracts.
Digital is also a sizable part of the transit model. Digital represented 47.1% of transit revenues in the quarter, up from 45.8% a year ago, underscoring the role of digital deployments and yield improvement in accelerating top-line performance across key transit markets.
OUT Expands Profit Leverage as Revenue Outpaces Costs
Profitability improved sharply in the quarter, driven by strong operating leverage. Operating income climbed to $55.9 million from $13.9 million in the year-ago period, reflecting solid revenue growth that materially outpaced expense growth.
Adjusted OIBDA increased 56.4% year over year to $100.4 million, pushing the adjusted OIBDA margin to 23.4% from 16.4% a year ago. Segment dynamics mattered: billboard adjusted OIBDA improved to $116.4 million from $99 million, while the transit adjusted OIBDA loss narrowed to $1.40 million, signaling meaningful improvement in transit profitability versus the prior-year quarter.
OUT’s Expense Mix Shows Targeted Pressure Points
Total operating expenses increased 2.8% year over year to $227.5 million. The company cited higher variable billboard property lease expenses and higher transit franchise costs, including higher guaranteed minimum annual payments to the New York MTA due to inflation, along with higher production, maintenance and utilities costs.
Notably, SG&A moved in the other direction. Selling, general and administrative expenses declined 6.5% to $107.3 million, primarily due to lower compensation-related expenses, including severance and salaries, and lower customer credit card usage by customers.
OUT Delivers Strong Cash Generation and Higher Capex
Cash generation strengthened alongside the earnings rebound. Net cash flow provided by operating activities was $75.3 million in the quarter, increased 124.1%, driven by higher net income adjusted, the timing of accounts receivables, and a decrease in accounts payable and accrued expenses.
Investment spending also stepped up. Total capital expenditures rose 40.1% year over year to $24.1 million, due to increased growth in digital displays, higher maintenance spending for billboard display upgrades and spending for safety-related projects.
OUT Highlights Liquidity and Maintains Payout
OUT ended the quarter with $67.2 million in unrestricted cash. Liquidity also included $494.9 million of availability under the revolving credit facility and $150 million of additional availability under the accounts receivable securitization facility, providing flexibility for operations and investment priorities. Total indebtedness was $2.6 billion as of March 31, 2026, and the weighted average cost of debt stood at 5.3%.
On capital returns, the company declared a quarterly dividend of 30 cents per share, payable on June 30, 2026.
OUT’s Zacks Rank
Currently, OUTFRONT Media has a Zacks Rank #2 (Buy). You can see the complete list of today’s Zacks #1 Rank (Strong Buy) stocks here.
OUTFRONT Media Inc. Price, Consensus and EPS Surprise
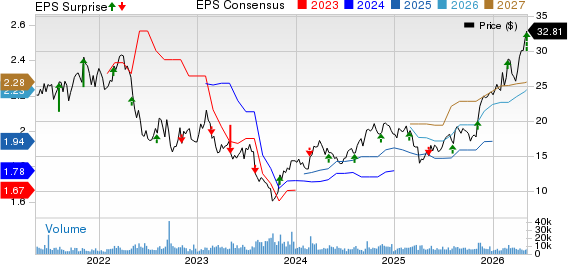
OUTFRONT Media Inc. price-consensus-eps-surprise-chart | OUTFRONT Media Inc. Quote
Performance of Other REITs
Vornado Realty Trust VNO posted first-quarter 2026 FFO, as adjusted, of 52 cents per share, in line with the Zacks Consensus Estimate. This compares unfavorably to the FFO of 63 cents a year ago. Total revenues of $459.11 million edged down 0.5% year over year but beat the consensus mark by 3.57%.
Results displayed year-over-year growth in same-store net operating income and occupancy for the New York and THE MART portfolios. The company witnessed decent leasing activities in these portfolios.
Iron Mountain Incorporated IRM reported first-quarter 2026 AFFO per share of $1.43, topping the Zacks Consensus Estimate by 2.88%. The figure grew 22.2% year over year. Total revenues of $1.94 billion beat the consensus mark by 4.31% and rose 21.6% year over year.
The quarter reflected broad-based momentum, led by strong expansion in growth businesses and solid pricing in the core storage franchise. Organic revenue growth was 17.2% year over year, underscoring continued demand and effective revenue management. The company raised its 2026 AFFO per share outlook.
Note: Anything related to earnings presented in this write-up represents FFO — a widely used metric to gauge the performance of REITs.
Radical New Technology Could Hand Investors Huge Gains
Quantum Computing is the next technological revolution, and it could be even more advanced than AI.
While some believed the technology was years away, it is already present and moving fast. Large hyperscalers, such as Microsoft, Google, Amazon, Oracle, and even Meta and Tesla, are scrambling to integrate quantum computing into their infrastructure.
Senior Stock Strategist Kevin Cook reveals 7 carefully selected stocks poised to dominate the quantum computing landscape in his report, Beyond AI: The Quantum Leap in Computing Power .
Kevin was among the early experts who recognized NVIDIA's enormous potential back in 2016. Now, he has keyed in on what could be "the next big thing" in quantum computing supremacy. Today, you have a rare chance to position your portfolio at the forefront of this opportunity.
See Top Quantum Stocks Now >>Want the latest recommendations from Zacks Investment Research? Today, you can download 7 Best Stocks for the Next 30 Days. Click to get this free report
Iron Mountain Incorporated (IRM): Free Stock Analysis Report
Vornado Realty Trust (VNO): Free Stock Analysis Report
OUTFRONT Media Inc. (OUT): Free Stock Analysis Report
This article originally published on Zacks Investment Research (zacks.com).