
The recovery has reignited discussion around whether ZEC can reclaim the psychologically important $500 level or if sellers positioned near major resistance zones will cap the latest rally. While short-term momentum has improved, technical indicators continue to paint a mixed picture, leaving traders closely focused on volume, liquidity flows, and key price levels .
Bug Fix Announcement Fuels Strong Bounce From Support
According to market analysis shared by crypto trader ReidiVuka , ZEC/USD staged a strong reaction from the $440 accumulation zone shortly after Zcash founders disclosed a bug fix.
The analyst highlighted the presence of bullish fair value gaps following the announcement, suggesting that the move was supported by genuine buying activity rather than purely speculative trading.
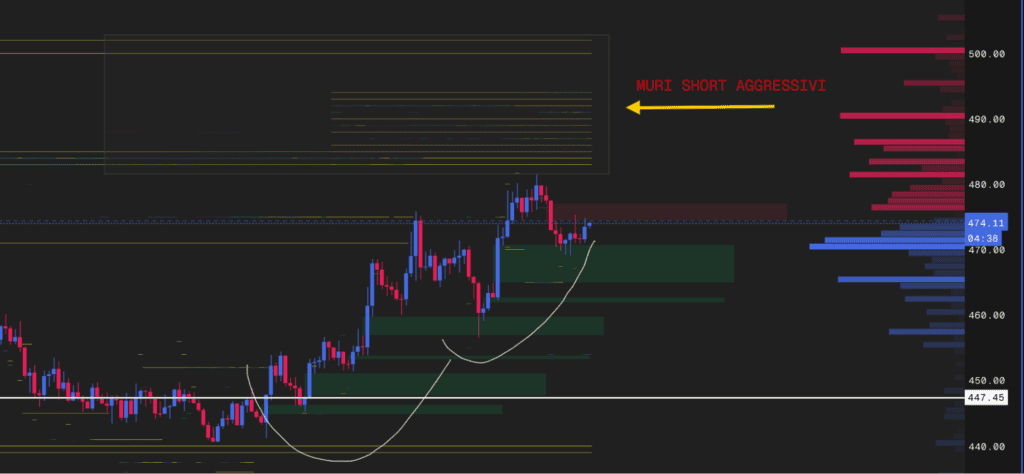
ZEC rebounded sharply from the $440 accumulation zone following a bug-fix announcement but faces significant resistance near $474-$500, where heavy sell orders are concentrated. Source: @ReidiVuka via X
The rally pushed ZEC toward the Value Area High (VAH) resistance near $474, an area that has become a focal point for traders. However, market data also points to significant sell-side liquidity between $490 and $500, where a concentration of short positions appears to be waiting.
As a result, the next move may depend heavily on whether buyers can generate enough spot demand to absorb this overhead supply.
ReidiVuka noted that a failure to break through resistance could open the door to a retracement toward the $447-$460 region. Conversely, a decisive breakout above the resistance cluster could force short sellers to cover positions, potentially accelerating momentum beyond the $510 level.
The analyst also emphasized the importance of monitoring real spot absorption, RSI divergences, and exchange flow data to confirm whether the rally has sustainable strength.
Higher-Timeframe Demand Zone Remains Critical
Beyond the short-term price action, ZEC is also attracting attention from traders studying larger market structures.
Recent chart analysis shows that Zcash experienced a steep decline after being rejected from the $600-$700 premium zone. That selloff swept a significant amount of downside liquidity and drove the asset into a major higher-timeframe demand area that has historically attracted strong buying interest.
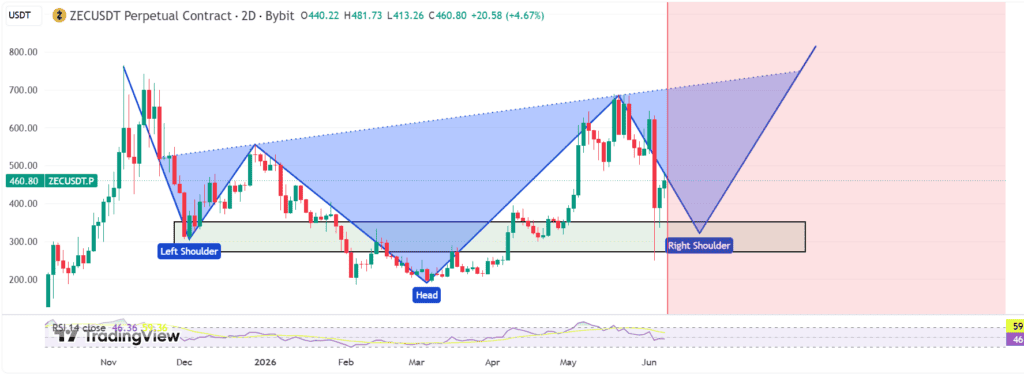
ZEC fell sharply from the $600–$700 region into a major higher-timeframe demand zone, where strong historical buying interest has begun to attract buyers again. Source: Leo524 on TradingView
The current demand region between approximately $270 and $350 has become particularly important because it aligns with the potential right shoulder of a broad inverse head-and-shoulders pattern.
Although the formation remains unconfirmed, technical analysts view the structure as one of the more closely watched bullish reversal patterns. For confirmation, buyers would need to continue defending support levels while gradually reclaiming higher resistance zones.
At present, the market appears to be transitioning from panic selling toward stabilization, though traders are still waiting for evidence that a sustainable higher low is forming.
ZEC Price Analysis Shows Mixed Technical Signals
At the time of writing, Zcash is trading near $473.86, representing a daily gain of approximately 7.55%.
Despite the strong price recovery, TradingView's overall technical summary remains Neutral. The composite reading consists of 10 sell signals, 10 neutral signals, and 6 buy signals, reflecting the ongoing battle between short-term weakness and longer-term support.
The mixed reading suggests that while bullish momentum has improved, the broader trend has not yet shifted decisively in favor of buyers.
Momentum indicators currently offer a relatively balanced outlook.
The Relative Strength Index (RSI) stands at 46.23, placing it near the midpoint and indicating that ZEC is neither overbought nor oversold. The Stochastic %K reading of 41.67 and the Commodity Channel Index (CCI) reading of -93.84 also remain within neutral territory.
Meanwhile, the Average Directional Index (ADX) sits at 28.41, suggesting moderate trend strength.
One of the more constructive signals comes from Momentum (10), which currently generates a Buy reading at -57.07. However, this positive signal is offset by the MACD, which remains bearish at -21.02.
The combination of a bullish momentum indicator and a negative MACD reflects improving sentiment but not yet a confirmed trend reversal.
Moving Averages Highlight Key Resistance Zones
Moving averages continue to reveal areas where buyers may encounter challenges.
Short-term averages remain largely bearish, with the 10-day EMA at 484.71 and the 10-day SMA at 499.70 both signaling sell conditions. Similar readings persist across the 20-day, 30-day, and 50-day moving averages.
Notably, the 20-day EMA stands at 512.95, while the 50-day SMA is positioned near 495.04, creating an important resistance region around the current market price.
However, the longer-term trend remains more constructive. The 100-day EMA at 429.96, 200-day EMA at 368.95, and corresponding long-term simple moving averages continue to generate buy signals.
This indicates that while short-term traders remain cautious, ZEC still trades above several key longer-term support levels.
The Ichimoku Base Line currently sits near 470.06, closely aligned with the market price and reinforcing the importance of the current trading range.
Key Levels to Watch for Zcash
For traders monitoring the next directional move, several price levels stand out.
Immediate resistance remains concentrated near the $490-$500 zone, where short sellers have reportedly accumulated positions. A successful breakout above this region could improve bullish sentiment and potentially trigger additional buying activity.
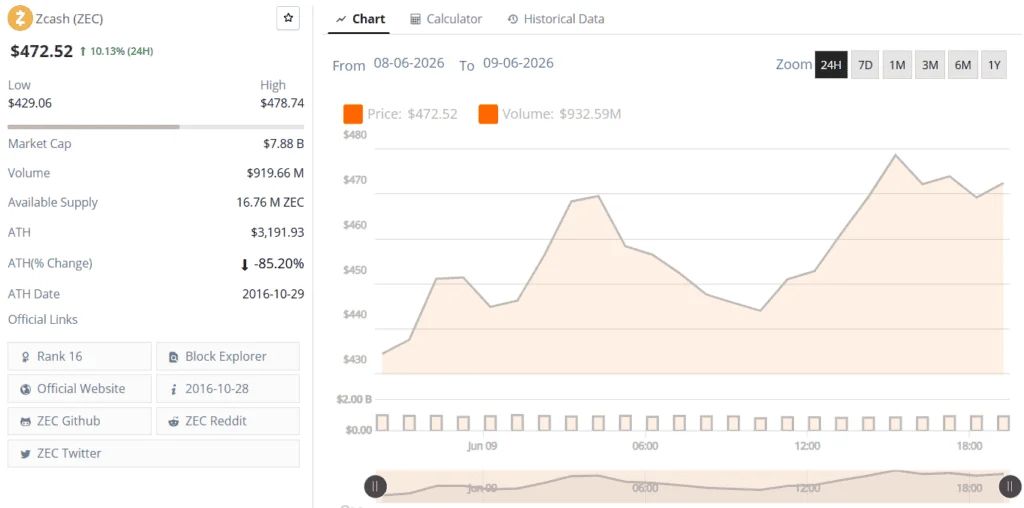
Zcash (ZEC) was trading at around $472.52, up 10.13% in the last 24 hours at press time. Source: Brave New Coin
On the downside, analysts are watching the $447-$460 area as an important near-term support zone if the current rally loses momentum.
TradingView's pivot point analysis places the central pivot at approximately $533.86. Reclaiming this level could strengthen the bullish case, while remaining below it may keep price action range-bound.
Additional support is located near $377.71, while higher resistance levels extend toward $725.15 and beyond, reflecting the inherently volatile nature of cryptocurrency markets.
Zcash Price Prediction
The current Zcash setup presents a balanced but improving technical picture. Recent buying activity following the bug fix announcement has helped the asset recover from a key accumulation area, while longer-term support structures remain intact.
At the same time, several indicators continue to signal caution. Short-term moving averages remain overhead, the MACD has yet to turn positive, and a significant resistance wall exists between $490 and $500.
For now, traders appear focused on whether ZEC can convert the latest momentum into a sustained breakout. A move above nearby resistance could shift market sentiment more decisively in favor of buyers, while rejection at those levels may result in another test of lower support zones.
As the market digests both technical developments and network-related updates , the battle around the $500 level is likely to remain one of the most closely watched themes for Zcash in the near term.