
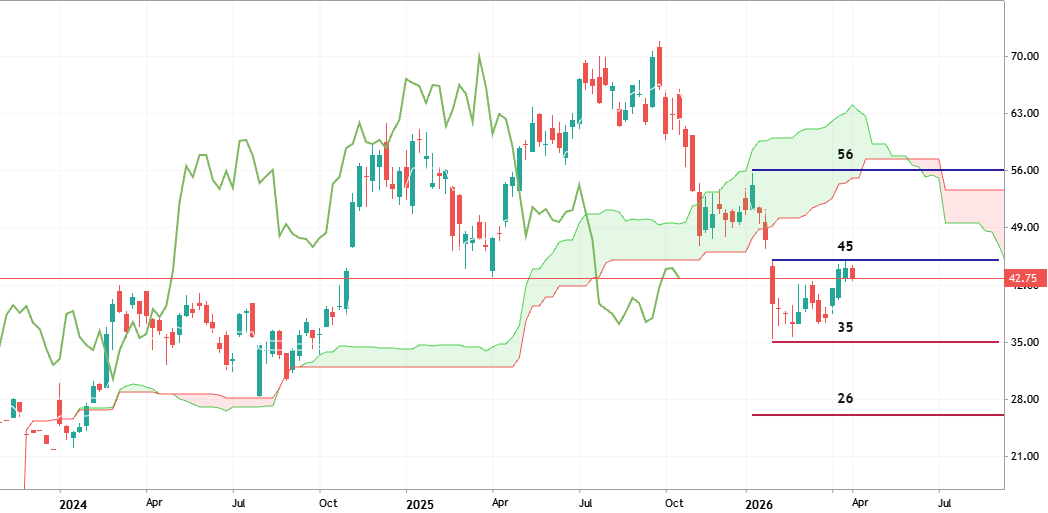
The weekly price is located near and below Ichimoku cloud in the bearish area of the chart for the secondary ranging within 35/45 s/r channel waiting for the direction of the bearish trend to be continuing or for the bear market rally to the possible bullish reversal to be started.
There are key s/r levels for possible breakout and breakdown to be formed, for example: 26 support for possible bearish breakdown and resistance level at 56 for the possible bullish breakout.
Trading Summary: wait for the s/r levels to be crossed on the close weekly bar for the bearish trend to be continuing or for the rally-to-reversal to be started.

Новый комментарий
It's good idea really am appreciate but I need a person who support me 🙏🙏