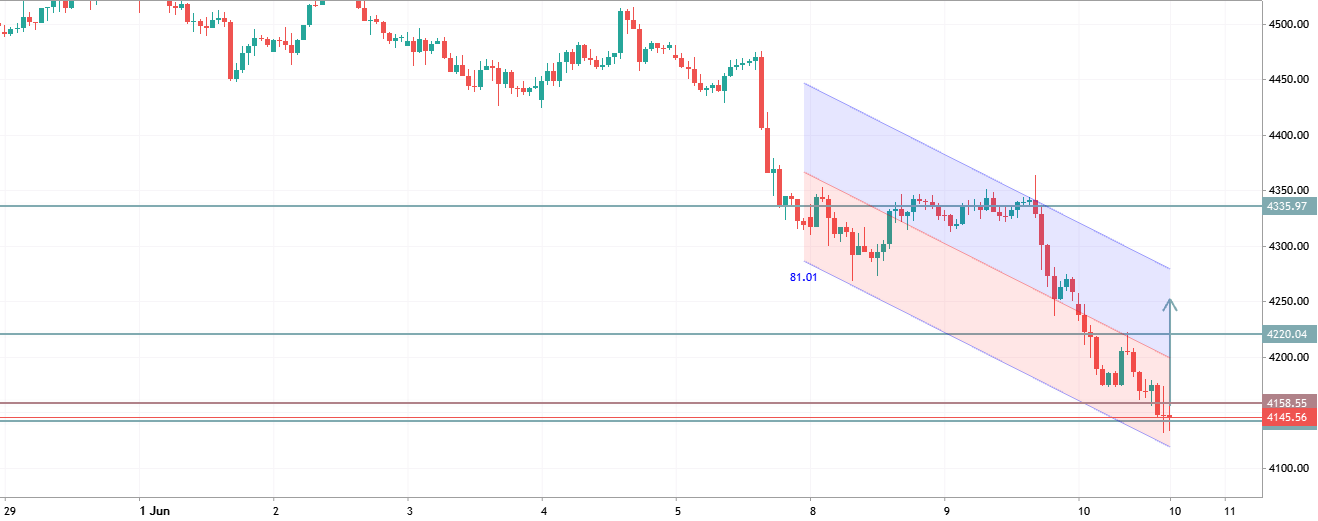
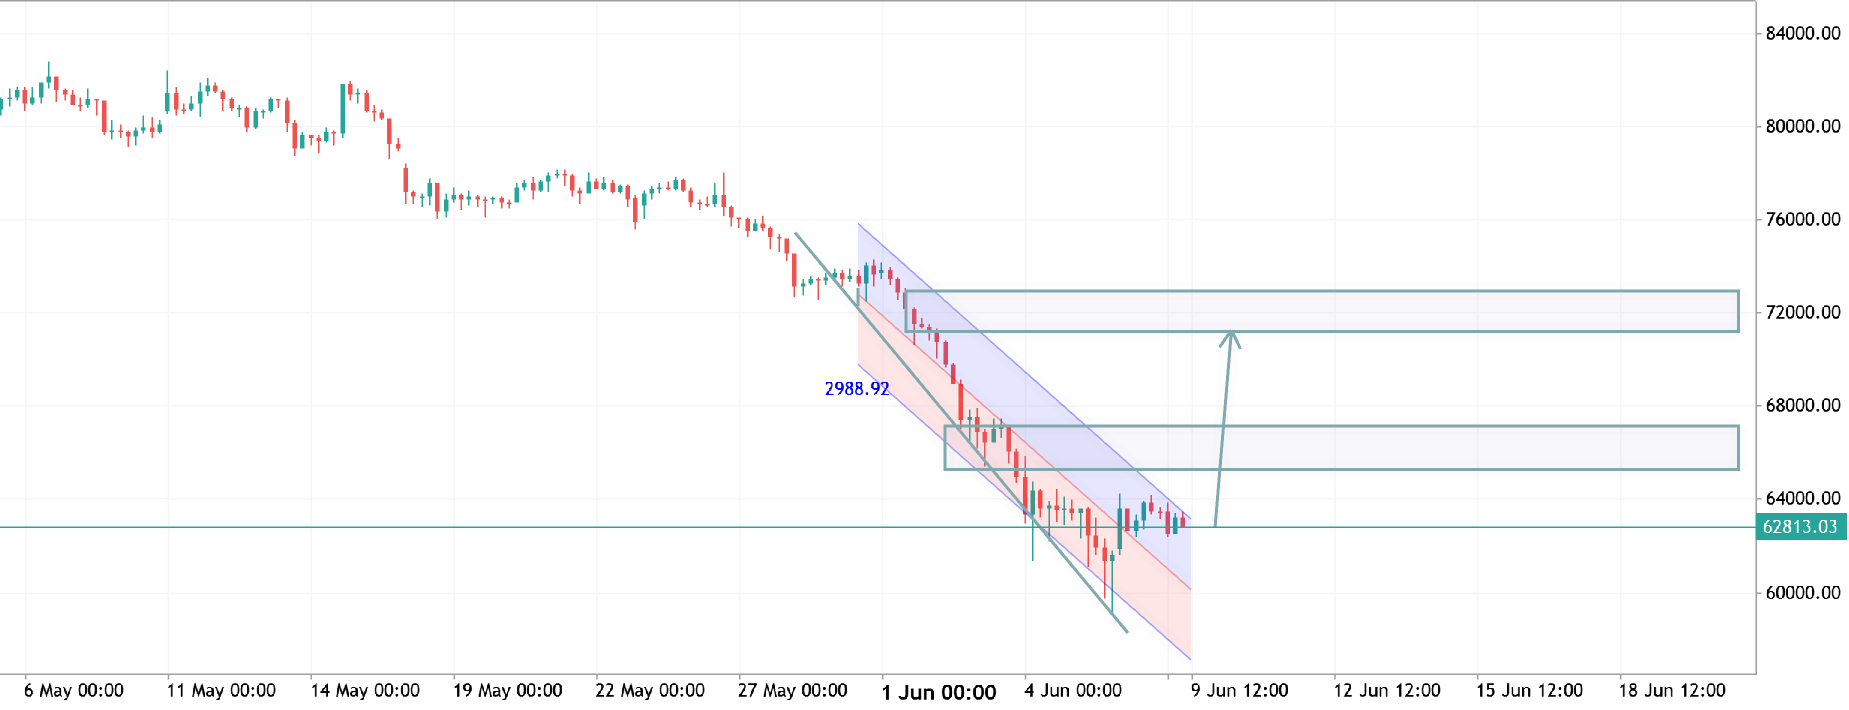
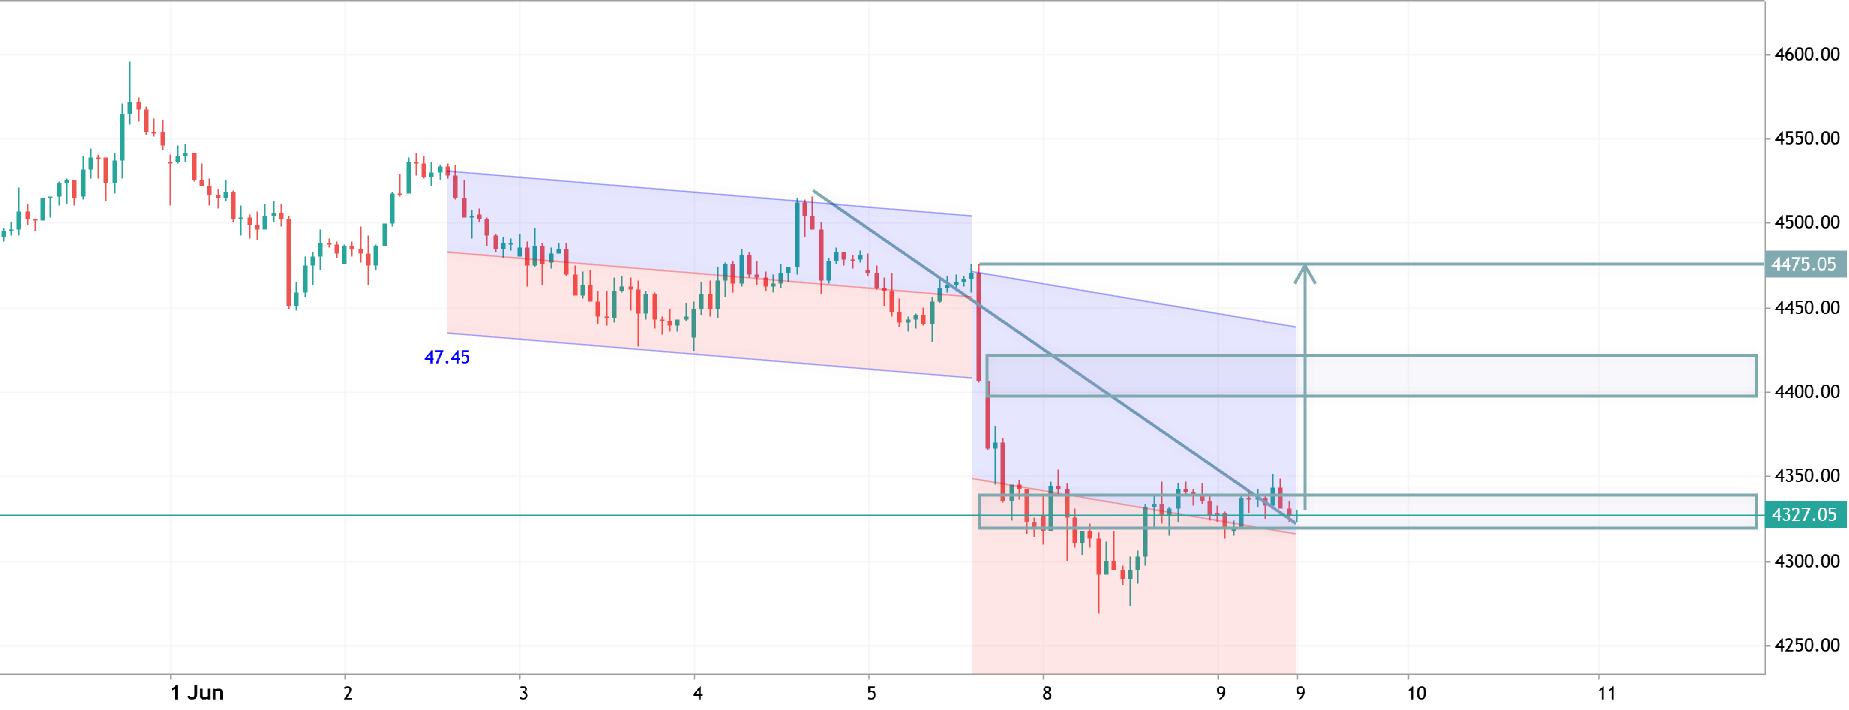
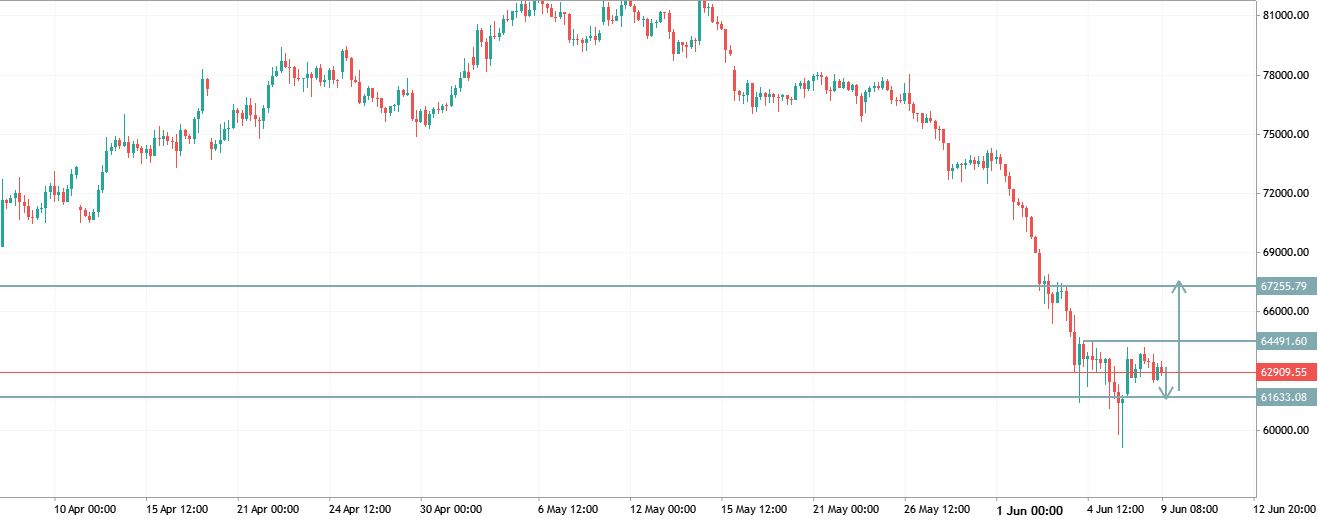
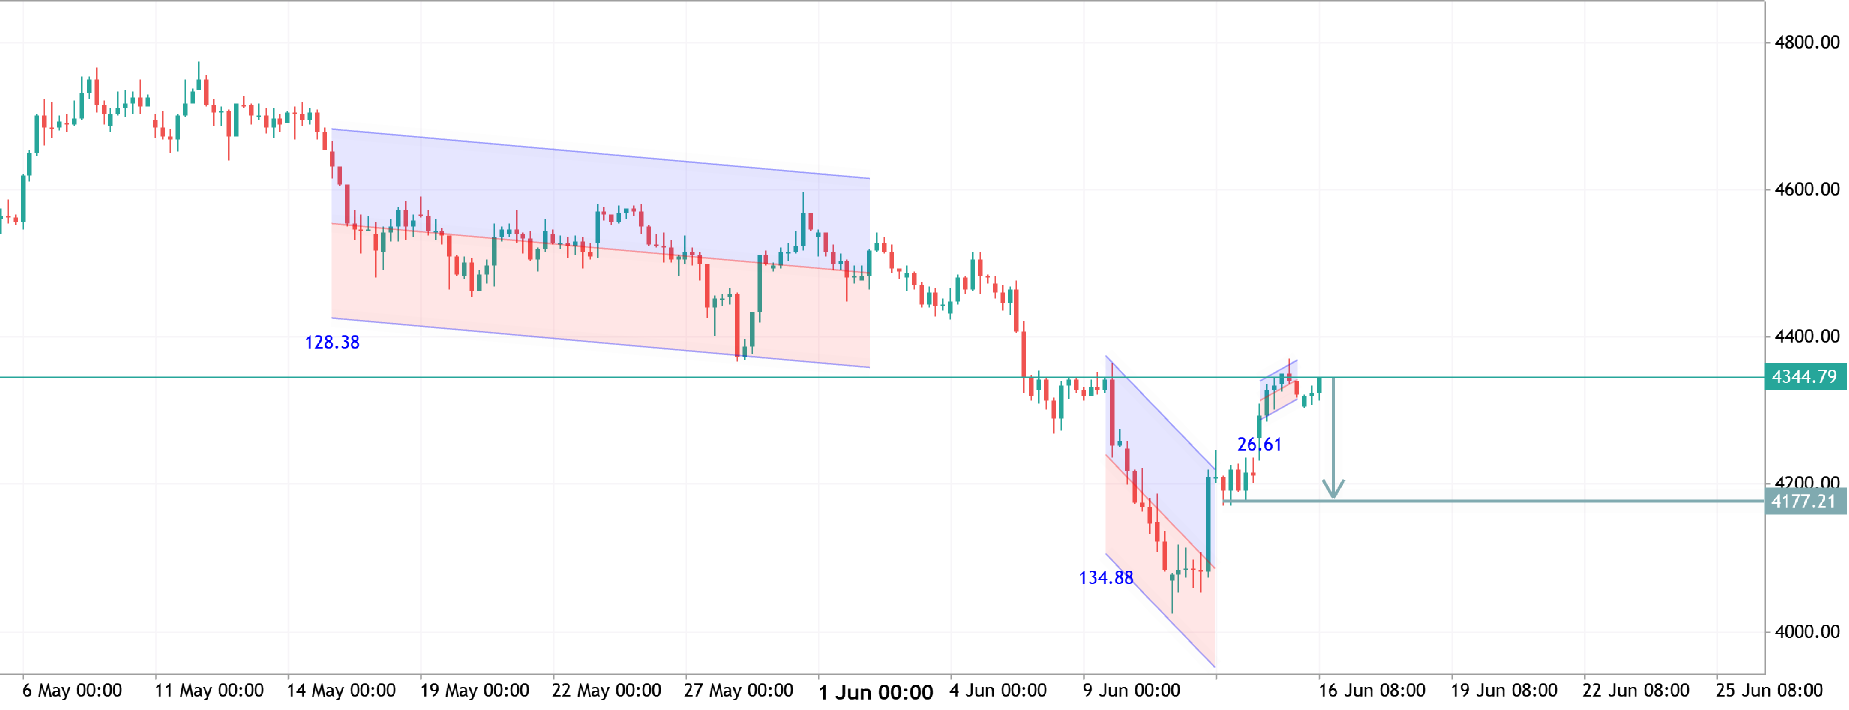
ENB - Long-Term Forecast ENB Enbridge, Inc
ENB - Long-Term Forecast
Weekly price is located far above Ichimoku cloud in the bullish area of the chart. The price is testing the resistance level at 55.44 to above for the strong bullish trend to be continuing. The alternative scenarios are the following: - if the price breaks the support at 52.50 to below so the secondary correction may be started with 50.06 possible target to re-enter; - if the weekly price crosses 50.06 support level so the correction will be continuing with 45.03 bearish reversal level; - if not so the price will be on ranging within s/r channel waiting for the direction of the strong trend to be started. Summary : primary bullish continuation
0
newdigital Sergey Golubev 2026.04.09 13:52
XAU/USD: Bearish Continuation — Target 4300 Following Potential 4550 Support Bounce XAUUSD Gold vs US Dollar
XAU/USD: Bearish Continuation — Target 4300 Following Potential 4550 Support Bounce
The XAUUSD daily chart indicates a broader bearish correction after breaking below the critical psychological level of 5000.00 , which has now flipped from support to heavy resistance. Based on the projected trajectory, the price is expected to pull back to test the immediate support zone at 4550.00 in the near term. A subsequent bounce from this level could lead to a temporary relief rally, retesting the 5000.00 resistance and potentially forming a lower high. Ultimately, if sellers aggressively defend this upper barrier, the resulting rejection could trigger a deeper downward continuation targeting the next major support block at 4300.00
1
boyvlad Vladislav Boyko 2026.04.08 17:05
XAUUSD Weekly Close: Consolidation with Key Levels in Focus XAUUSD Gold vs US Dollar
XAUUSD Weekly Close: Consolidation with Key Levels in Focus
XAUUSD shows mixed momentum into the weekly close, with price consolidating after recent volatility. Key resistance remains near recent highs, while support holds around short-term demand zones. A break above resistance may signal bullish continuation, while rejection could lead to a pullback. Market focus stays on USD strength and rate expectations, keeping gold sensitive to macro shifts.
0
m Maxim Kruglov 2026.04.06 10:16
AAPL Short Trading Idea AAPL Apple Inc.
AAPL Short Trading Idea
A short trading idea for Apple Inc. is based on the stock approaching a strong resistance zone around $190–195, where price has repeatedly faced rejection. Technical indicators point to weakening momentum, with RSI in overbought territory and early signs of a potential double top or lower high structure forming. This suggests the upside may be limited in the short term and a pullback is increasingly likely 📊. The trade setup is to enter a short position in the $188–192 range, with a stop-loss placed above $197 to manage risk. Downside targets are set at $180 and $172, offering a favorable risk/reward ratio of around 1:2 or better. This structure provides a clear invalidation level and defined profit zones for disciplined execution 🎯. Trade Plan: 🔻 Entry: $188–192 🛑 Stop-loss: $197 🎯 Take-profit 1: $180 🎯 Take-profit 2: $172 On the fundamental side, bearish pressure may come from slowing iPhone demand, margin compression, and broader tech sector exhaustion. However, risks remain, including strong buyback
0
m Maxim Kruglov 2026.04.03 14:11
S&P 500 Drops 4.6% in Q1 — Can Markets Recover in Q2 Amid War and Rate Uncertainty?
500
US500 US SPX 500 Index
S&P 500 Drops 4.6% in Q1 — Can Markets Recover in Q2 Amid War and Rate Uncertainty?
📊 S&P 500 🔻4.6%, Nasdaq 🔻7.1%, Dow Jones 🔻3.6% January started on a strong and optimistic note. Economic growth was accelerating, the Federal Reserve appeared ready to continue cutting rates, and the AI boom still had plenty of runway. The mood across markets was genuinely positive. Then February 28 happened. The United States and Israel launched strikes on Iran — and just like that, sentiment collapsed. 📅 The Quarter That Wasn’t Q1 2026 turned into one of the most difficult quarters in recent years: S&P 500 fell 4.6% Nasdaq Composite dropped 7.1% Dow Jones Industrial Average declined 3.6% All three indexes recorded their worst quarterly performance in nearly four years. The Nasdaq officially entered correction territory on March 26, falling more than 10% from its recent peak — a level traders closely watch as confirmation that selling pressure is no longer temporary. The Dow followed a day later. Since the conflict began: Oil prices surged 63% Bond yields moved sharply higher The S&P 500 era
0
m Maxim Kruglov 2026.04.03 11:40