
The Dow Jones Industrial Average ($DOWI), what a joke right? WRONG.
The oldest of the three “headline” indexes tracking U.S. large-cap stocks has been the butt of many jokes in recent years. But I can make a case that it might just laugh all the way to the proverbial bank. At least for the last seven months of 2026.
More Yield, Less Trap: Sign up free to get Barchart’s daily Dividend Investor newsletter straight to your inbox.
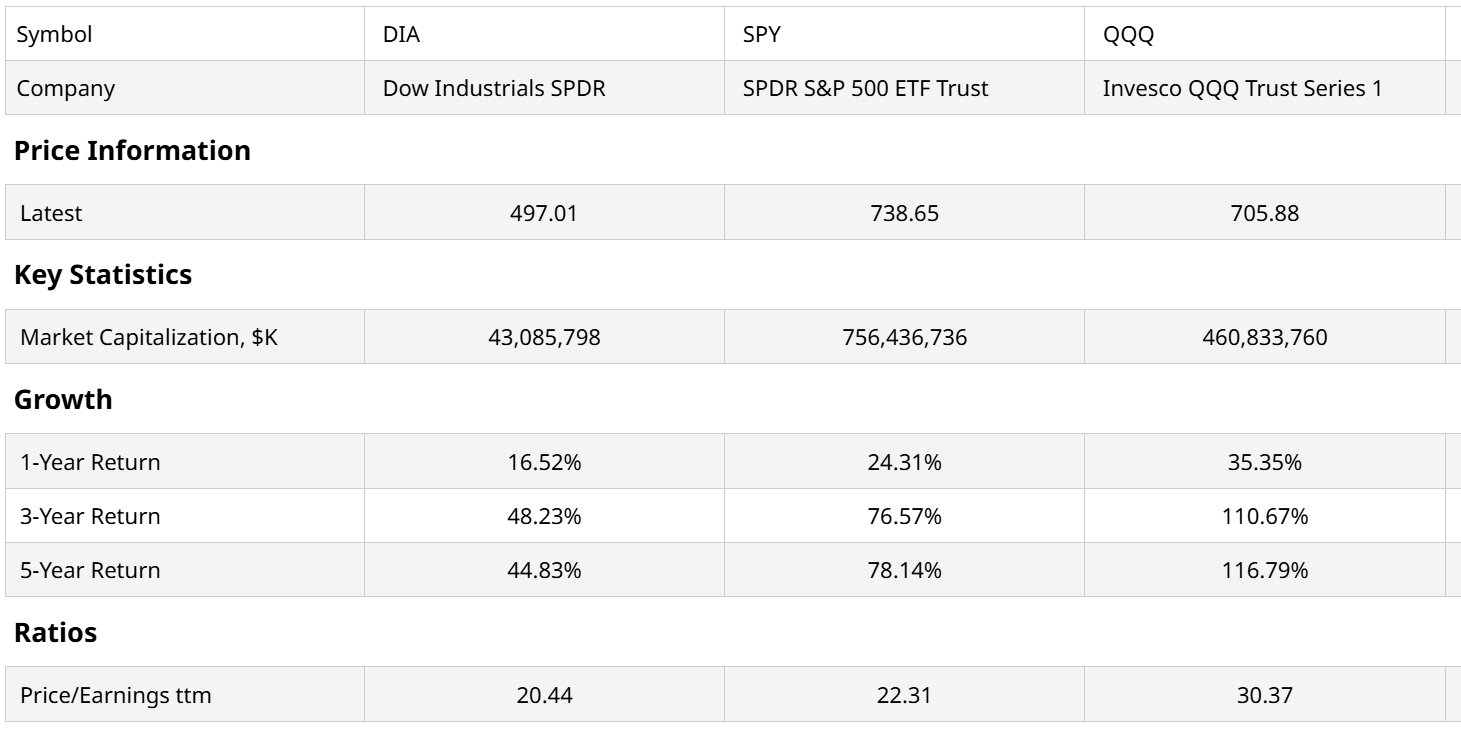
For years, the investing world has been entirely dominated by cap-weighted performance. If you didn’t own a concentrated basket of tech and AI giants, you simply weren’t keeping up. That dynamic pushed the Invesco QQQ Trust (QQQ) and the S&P 500 ETF (SPY) to historic highs, while the SPDR Dow Jones Industrial Average ETF Trust (DIA) was largely dismissed as a boring, backward-looking relic.
The “cool kids’ table” has two members. QQQ and SPY. And if they were to let in a third, it would likely be the State Street Technology Select Sector SPDR ETF (XLK) or the VanEck Semiconductor ETF (SMH), since what do a couple of tech-laden stock indexes need to feel better about themselves than to have MORE tech, more semiconductors, and more AI-mania to tell them how great they are.
That’s all a metaphor of course. But you can see just how the asset flows have shaken out over time. The Dow? $43 billion in assets? That’s like a rounding error in the wide world of narrowly focused equity index ETFs.
 www.barchart.com
 Has DIA’s performance severely lagged that of SPY and QQQ for several years? Absolutely. Is that alone a reason to be curious about it now? Absolutely! Note I did not say “go out and buy it, sight unseen.”
That type of sustained underperformance indicates one of two things:
A structural change in how markets work, where tech is forever king (DIA owns a notably lower tech allocation than the other two ETFs). A cyclical comeback for the stocks not currently in favor, versus the couple of handfuls that crowd the top of SPY and QQQ.I do not want to overstate the “Dow is value-ish vs. SPY/QQQ are growth-ish” differences. Those are part of my rationale for liking the Dow 30 and DIA here, relative to QQQ and SPY.
But beyond the quirky price-weighting system used by the Dow committee back to its inception in the 19th century (no, I was not present in 1896 when the 12-stock Dow first came to be), there’s something more obvious to me. The Dow has 30 stocks, which means they are easy to follow. And it covers far more sectors than the other two, from the standpoint of meaningful contribution to the index’s total weight.
Here’s the entire DIA holdings list as of Monday’s close. I’ve highlighted in yellow the four Magnificent 7 stocks which comprise about 15% of DIA. In SPY, those four names are 25%, plus the other three bring the Mag-7 weight to 35%. That’s seven stocks, 35%. And thus, 493 stocks, 65%. That may never be a problem.
Or, any month now, it could be a BIG problem. For index investors at least. And since QQQ is similar in that overcrowding effect at the top, it too is vulnerable to a market change of heart.
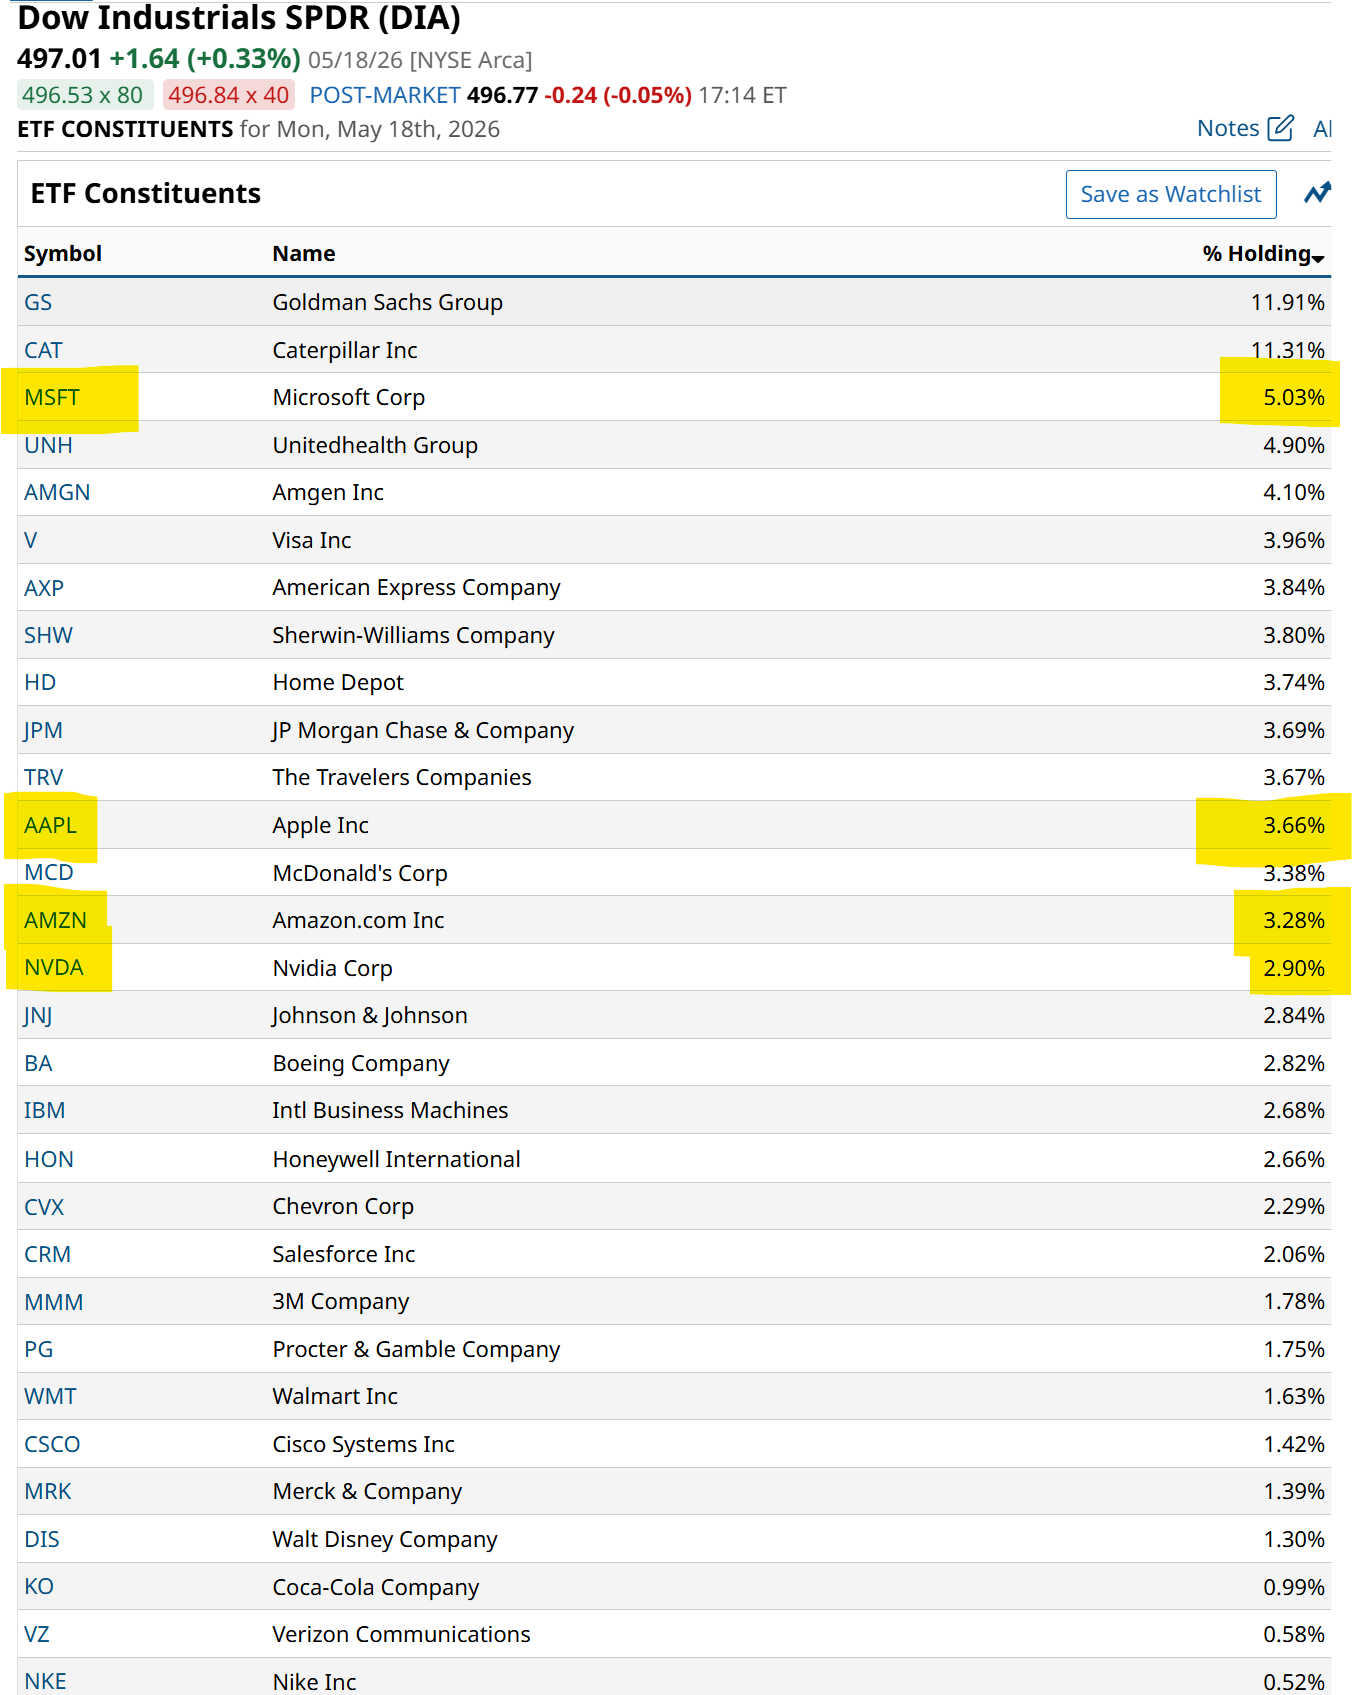 www.barchart.com
 Why Might the Dow’s Weighting System Become an Advantage?
One primary catalyst for a Dow comeback might just be in its awkward but at times effective index construction. While SPY and QQQ allocate capital based on market capitalization, meaning the biggest companies have the largest influence, the Dow is price-weighted. In DIA, a company’s weight is determined solely by its stock price, not its total market value.
This quirk has major strategic implications right now:
Because mega-caps like Microsoft (MSFT), Nvidia (NVDA), and Apple (AAPL) have expanded to unprecedented valuations, SPY and QQQ have become dangerously top-heavy. If a broad valuation reset hits tech, those indexes will suffer a severe mechanical drag.
DIA spreads its influence across 30 blue-chip names that are heavily weighted toward industrials, financials, and healthcare. In a mature market cycle where investors begin demanding actual realized cash flows over long-term AI projections, capital naturally rotates into these steady, dividend-paying titans.
With the 30-year Treasury rate stubbornly hovering above 5% and sticky inflation persisting, high growth multiples are facing genuine mathematical pressure. What drives the stock market might be about to undergo a major adjustment.
In a higher-for-longer rate environment, the financial sector — which makes up a massive portion of DIA — acts as a structural beneficiary. High-quality banks and credit institutions can sustain strong net interest margins, while the Dow’s industrial and materials components hold tangible pricing power that acts as a natural inflation hedge. QQQ, with its heavy technology concentration, has almost no exposure to these cyclical tailwinds, leaving it uniquely vulnerable to macro friction.
Why DIA Could Be a Winner Soon
The case for DIA isn’t about the Dow suddenly transforming into a high-growth vehicle. It is about a necessary reversion to the mean. Market breadth has been unsustainably narrow, and when market leadership finally broadens out, the lagging value and cyclical sectors will capture the defensive inflows.
To be clear, I am not suggesting that DIA goes up and SPY and QQQ drop. At least for very long. This is more about outperformance in an increasingly frothy stock market, and about the ability to peer easily into DIA, see what’s driving it, and even use it as a watchlist of 30 stocks to consider individually. As opposed to sifting through 500 in SPY.
 www.barchart.com
 And, my ROAR Score tool has had DIA in the green/lower risk zone for most of the past year. And it warned of higher risk when I’d want it to, turning yellow as the March slide gathered steam. Yet it quickly re-adjusted after a brief period warning that risk was higher in late March. That’s what ROAR or any other risk management system should do. It just turns out that every fire drill since 2009 has been a false alarm. One day, that won’t be the case.
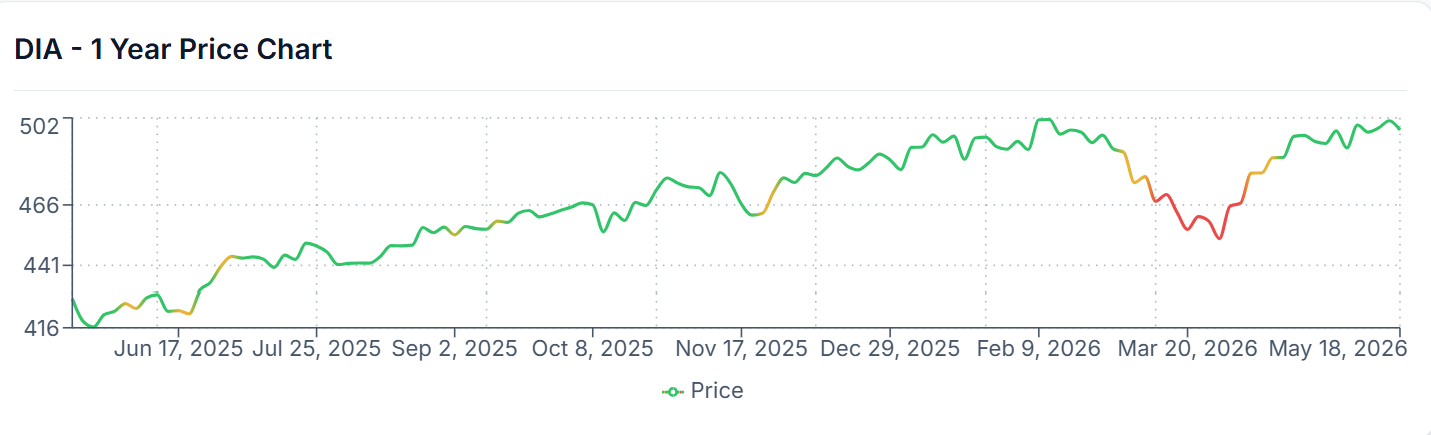 Chart courtesy of Rob Isbitts via PiTrade.com
 If the market maintains its all-time highs, DIA is poised to catch up as investors seek out the relatively cheaper pockets of the large-cap universe. If the top-heavy tech narrative finally cracks, DIA’s lower beta and diversified cash flow base will ensure it functions as a relative safe harbor. Either way, the strategic setup favors the 30 titans over the crowded mega-caps for the rest of the year.
Rob Isbitts created the ROAR Score, based on his 40+ years of technical analysis experience. ROAR helps DIY investors manage risk and create their own portfolios. For Rob’s written research, check out ETFYourself.com.
On the date of publication, Rob Isbitts did not have (either directly or indirectly) positions in any of the securities mentioned in this article. All information and data in this article is solely for informational purposes. For more information please view the Barchart Disclosure Policy here.
More news from Barchart
The $43 Billion ETF Hiding in Plain Sight. Why DIA Might Outperform SPY and QQQ for the Rest of 2026. The VIX and SPY Are Falling at the Same Time. Don’t Get Trapped by Volatility Hiding in a Market Blind Spot. These 3 AI ETFs Could Be the First to Kill the Stock Market Rally Monster Stocks Are Eating Wall Street. Here’s the Bull Case for Microcaps, Plus 3 Top Charts.