


Blue Owl Capital Inc. OWL is a global alternative asset manager that deploys private capital across credit, real assets, and GP strategic capital strategies for institutional and private wealth clients. The stock currently carries a Zacks Rank #4 (Sell).
You can see the complete list of today’s Zacks #1 Rank (Strong Buy) stocks here.
OWL’s investment case often comes down to how durable its fee base is and how quickly non-fee-paying capital converts into fee-paying assets. Those two drivers shape the company’s revenue visibility, margins, and sentiment in both calm and volatile markets.
Overview of OWL’s Business Model
Blue Owl’s business model is anchored by Permanent Capital vehicles and long-dated funds designed to support earnings stability and predictable fee streams, with management fees as the primary revenue source. Over the last twelve months ended March 31, 2026, about 85% of GAAP and Fee-Related Earnings management fees were generated by Permanent Capital.
As of March 31, 2026, total assets under management were $314.9 billion, while fee-paying assets under management were $188.4 billion. That gap matters because capital that is not yet paying fees can become a future fee stream as it is deployed or transitions into fee-paying structures.
OWL’s Platform Mix Shapes Revenue Stability
Blue Owl operates three platforms that diversify strategies and client types. The Credit platform had $159.2 billion of assets under management as of March 31, 2026, and provides direct lending and other credit solutions, including alternative and investment-grade credit and liquid credit strategies. The Real Assets platform had $85.1 billion of assets under management and focuses on net lease real estate, real estate credit, and digital infrastructure.
The GP Strategic Capital platform had $70.6 billion of assets under management and provides capital solutions to private capital managers through minority stakes, GP financing, and select investments in professional sports ownership vehicles.
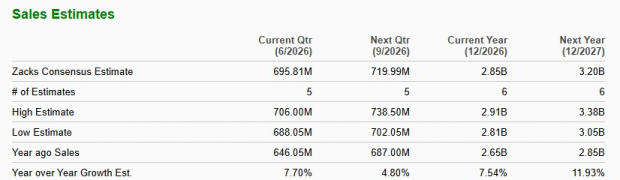
This mix supports steadier fee growth as it broadens the fee base across multiple engines rather than relying on one lending or fundraising cycle.
Image Source: Zacks Investment Research
Blue Owl’s Permanent Capital Is the Core Anchor
Permanent Capital is a core anchor for fee visibility because it is long-duration by design and tends to be less sensitive to short-term fundraising shifts. Blue Owl had $224.8 billion of Permanent Capital as of March 31, 2026. The concentration of management fees tied to Permanent Capital is a key reason the company frames its revenue model as predictable.
That stability can be especially valuable when volatility changes credit spreads and equity cushions. Management highlighted that direct lending indicators such as watch list, nonaccruals, amendment requests, and revolver draws did not show meaningful adverse movement in the first quarter of 2026, though borrower quality remains a focus in tech and software exposures.
OWL Has Embedded Fee Growth From Undeployed AUM
A key near-term catalyst is deployment. As of March 31, 2026, assets under management not yet paying fees totaled $29.9 billion. Management expects that capital, once deployed, will translate into about $349 million of annualized management fees and provide about 14% embedded growth off 2025 management fees.
The timing is not uniform. Deployment is expected to play out over roughly the next 12 to 24 months, and the cadence can vary by strategy and market conditions. Slower deal closings, muted sponsor activity, or back-half clustering can push fee recognition out.
Blue Owl’s Fundraising Engine Spans Institutions and Wealth
Fundraising has been a multi-year growth driver. Blue Owl raised $42 billion in 2025, up from $27.5 billion in 2024 and $15.4 billion in 2023, supported by differentiated products, a broader offering, and scaled distribution. Momentum continued in the first quarter of 2026 with $11 billion raised.
Management expects 2026 fundraising to look broadly similar to 2025, supported by Net Lease VII and GP Stakes VI “wrapping up” in the second half of 2026 and Digital Infrastructure Fund IV returning to market in 2026. Continued scaling of evergreen wealth products is positioned as another durability driver.
OWL’s Q1 2026 Print Shows Higher Revenue, Higher Costs
First-quarter 2026 distributable earnings per share were 19 cents, matching the Zacks Consensus Estimate and up 12% year over year. Total GAAP revenues rose 10% to $753.8 million, driven by higher management fees along with administrative, transaction, and other fees.
Blue Owl Capital Inc. Price, Consensus and EPS Surprise
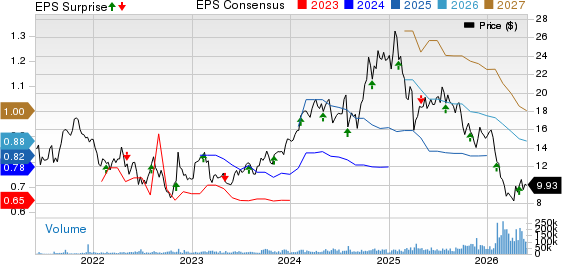
Blue Owl Capital Inc. price-consensus-eps-surprise-chart | Blue Owl Capital Inc. Quote
Expenses moved higher as well. Total GAAP expenses increased 6% to $644.3 million, primarily due to higher compensation and benefits costs. For 2026, management expects a Fee-Related Earnings margin of 58.5%, up modestly from 58.3% in 2025, with operating priorities centered on revenue growth outpacing expenses.
Blue Owl’s Key Watch Items: Liquidity, Credit, Expenses
Liquidity in semi-liquid private credit products is a swing factor. Toward the end of 2025, non-traded business development companies saw slower flows and elevated redemption requests, and Blue Owl restricted withdrawals at OBDC II after requests hit a 5% threshold and sold assets across affiliated funds to meet liquidity needs. In the first quarter of 2026, management cited net outflows of about $170 million from OCIC and OTIC, while redemptions from non-traded business development companies were about $1.2 billion.
Credit quality and expenses also matter. Concerns around software and AI-adjacent borrowers have risen, even as the company noted stable direct lending indicators and an average annual loss rate of 12 basis points. Investors can also benchmark expense discipline against continued investment in distribution and product build-out.
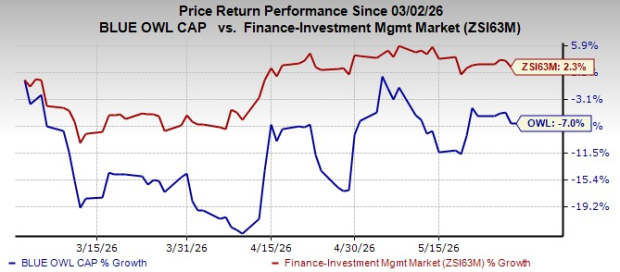
Over the past three months, shares of OWL have lost 7% against the industry’s rally of 2.3%.
Image Source: Zacks Investment Research
In the broader alternative asset manager landscape, peers such as Apollo Global Management Inc. APO and Blackstone Inc. BX can influence sentiment around fundraising and fee multiples. For OWL, quarter-to-quarter monitoring tends to come back to redemption trends, deployment progress, and whether revenue growth continues to stay ahead of compensation-driven cost pressure.
Like Blue Owl, Apollo and Blackstone also faced higher redemption requests in some of their flagship funds. However, both alternative asset managers reported solid quarterly performance on the back of higher fundraising in other avenues. At present, Apollo and Blackstone also carry a Zacks Rank #4.
Research Chief Names "Single Best Pick to Double"
From thousands of stocks, 5 Zacks experts each have chosen their favorite to skyrocket +100% or more in months to come. From those 5, Director of Research Sheraz Mian hand-picks one to have the most explosive upside of all.
This company targets millennial and Gen Z audiences, generating nearly $1 billion in revenue last quarter alone. A recent pullback makes now an ideal time to jump aboard. Of course, all our elite picks aren’t winners but this one could far surpass earlier Zacks’ Stocks Set to Double like Nano-X Imaging which shot up +129.6% in little more than 9 months.
Free: See Our Top Stock And 4 Runners UpWant the latest recommendations from Zacks Investment Research? Today, you can download 7 Best Stocks for the Next 30 Days. Click to get this free report
Blackstone Inc. (BX): Free Stock Analysis Report
Apollo Global Management Inc. (APO): Free Stock Analysis Report
Blue Owl Capital Inc. (OWL): Free Stock Analysis Report
This article originally published on Zacks Investment Research (zacks.com).