


You never know when your number is going to be called. That’s what I learned playing team sports as a kid. Though to be honest, my number was not often called. But I digress.
For a couple of weeks during May, I was fortunate enough to be chosen by Barchart’s editors to fill the formidable shoes of Jim Van Meerten by writing this website’s regular Chart of the Day column. It was a temporary gig, a cameo role, and one which I am happy to be repeating later in June.
More Yield, Less Trap: Sign up free to get Barchart’s daily Dividend Investor newsletter straight to your inbox.
As it turned out, going through that specific daily process of selecting one stock to highlight, and then detailing why, was a fantastic exercise in keeping my analytical gears greased. Oh, but it turned out to be much more than that for me. It turned into an intellectual lightning strike.
I’ll explain why in a moment. But first, the easy part: I am now a Chart of the Day subscriber. It’s delivered right to my inbox every day at no cost.
That was my easiest call of the month, because one of the first things you learn as an investment writer and analyst is to spot value-added content from your peers. I’d suggest you do the same (and only partly because when Jim takes a break from the action again in a couple of weeks, you’ll get to follow along with my next round of daily takes).
Now, back to that lightning strike…
The Benefits of Borrowing Jim’s Boxster (Proverbially)
If you have followed my research here, and perhaps elsewhere, you know where my head has been. I have spent decades focused on macro risk, asset allocation, and helping self-directed investors survive a market that frequently feels unhinged.
As a result, I tend to look at the investing world from 30,000 feet. But with Jim enjoying a well-deserved sabbatical from his daily chart duties, I was now forcing myself to sit down every single morning, scan thousands of symbols, select one specific stock chart, and defend it to Barchart’s sharp public audience.
That process did something unexpected. It broke through my own macro fog and completely re-engaged my passion for single-stock investing.
I’m a technician and quant investor, not a fundamental analyst. Yet somehow, I’ve made it this far, 40 years after first stepping into what was my favorite building in the world, NYC’s World Trade Center, in 1986. That’s more a testament to the analytical advantage that I have always believed charting has over other forms of analysis.
As has been discussed here before, I was a huge Barchart fan and user for many years before I started writing here. That’s due to the fantastic technical analysis and data tools here, which I’ve continued to absorb in a gluttonous fashion since I started contributing here.
Whether it’s the Interactive Charts, Watchlists, Custom Views, Barchart Opinion, or – well, I could go on – the time I’ve saved and the efficiency the site has brought to my own investing has been more than noticeable. I can literally put a “price” on it in terms of my time. It is on the way to being life-changing.
And that was part of the intellectual lightning strike I referenced earlier.
As context, I’m known around these parts as the “resident ETF guy,” a label I wear proudly. I’ve analyzed exchange-traded funds (ETFs) for the purpose of making active investment decisions since I first started managing other people’s money, back in 1993.
That was the same year researching active and passive mutual funds expanded to ETFs. That’s when SPY, the first ETF, debuted. (They grow up so fast!)
So how did renting Jim’s investing version of a family car for two weeks spark a revelation?
Well, somewhere along the road from Chart of the Day column #1 and column #11 that I submitted last month, it hit me.
Even though I’ve been more ETF and macro-focused here, let’s face it: equity ETFs are just baskets of stocks. So the entire time I’ve been scouting ETFs, the underlying stocks were right there.
My preference as an investor is already to think of ETFs as “the stocks I’d like to own, but with some friends around them.” In the process of guest editing for Jim, a question wormed its way into my brain and never left:
If you’re a technician or a quant, and you want to make the case to yourself to own or not own an ETF, how can you not inherently be “grading” the top 5-10 stock holdings at the same time?
Most ETFs are market cap-weighted, after all.
So from there, it’s just a matter of drilling down on your individual process for “grading.”
The Daily Grind: The Anatomy of My Barchart Screen
When you write a daily column, you can't afford to be vague. You can’t hide behind "on the one hand, on the other hand" market-speak. The market doesn't care about your theories; it cares about price action. That’s why I’m a technician.
And after being considered roughly akin to voodoo for decades, the new breed of traders and investors are giving technical analysis at least an equal footing with fundamentals.
Heck, Jim – an age peer of mine – has passed the CPA exam and the Certified Internal Auditor Exam. That he gravitated towards charting enough to write a very popular daily column on the subject should speak volumes.
Or, like it says in the Chart of the Day template that Jim originally authored, “Don’t Forget The Fundamentals” – in other words, the technicals are the primary tool here.
For me, that’s been the case for 40 years. Box checked!
But if you recommend a chart and the stock rolls over 48 hours later, it happens right in front of everyone. Yep – been there, done that, bought the T-shirt. And yet that’s one of the anxieties that kept cropping up throughout my two-week coverage stint.
During my NYC Wall Street era (1986-1997, before shipping down to Florida, to paraphrase the Dropkick Murphys), I was trained to look at every investment decision as one piece of a whole portfolio.
Does that put me in the minority of modern investors, in a stock-pick-driven market economy? You betcha!
And there are three things I’ve learned you can’t fight forever: the Fed; the tape; and a public opinion that favors picks over portfolios.
That’s why I jumped at the opportunity to take a try at filling in for Chart of the Day, about a second after my editor Sarah Holzmann said, “Jim is out and we need…” – YES!
Still, that pick-driven pressure forces a specific kind of analytical survival mechanism. My daily process quickly evolved into a multi-layered screening ritual.
Every morning, I deployed Barchart’s screening functions to sort for stocks exhibiting notably improving technicals. I wasn't just looking for what was "up" on the day; I was hunting for a rare, potent combination of momentum, strength, and direction.
In a way, this was like a homecoming of sorts for me. As we documented a while back, the ROAR Score I created was inspired in large part by the Barchart Opinion indicator. The percentage Buy/Sell scores, along with the translation of moving averages into short summaries like Strongest and Weakening, is one of the more brilliant technical creations I’ve seen.
The same goes for the Signal system, where it's Buy, Sell, or occasionally Hold.
Even more critically, the Signal % metric is one of the best features of this entire site. But you have to learn how to use it.
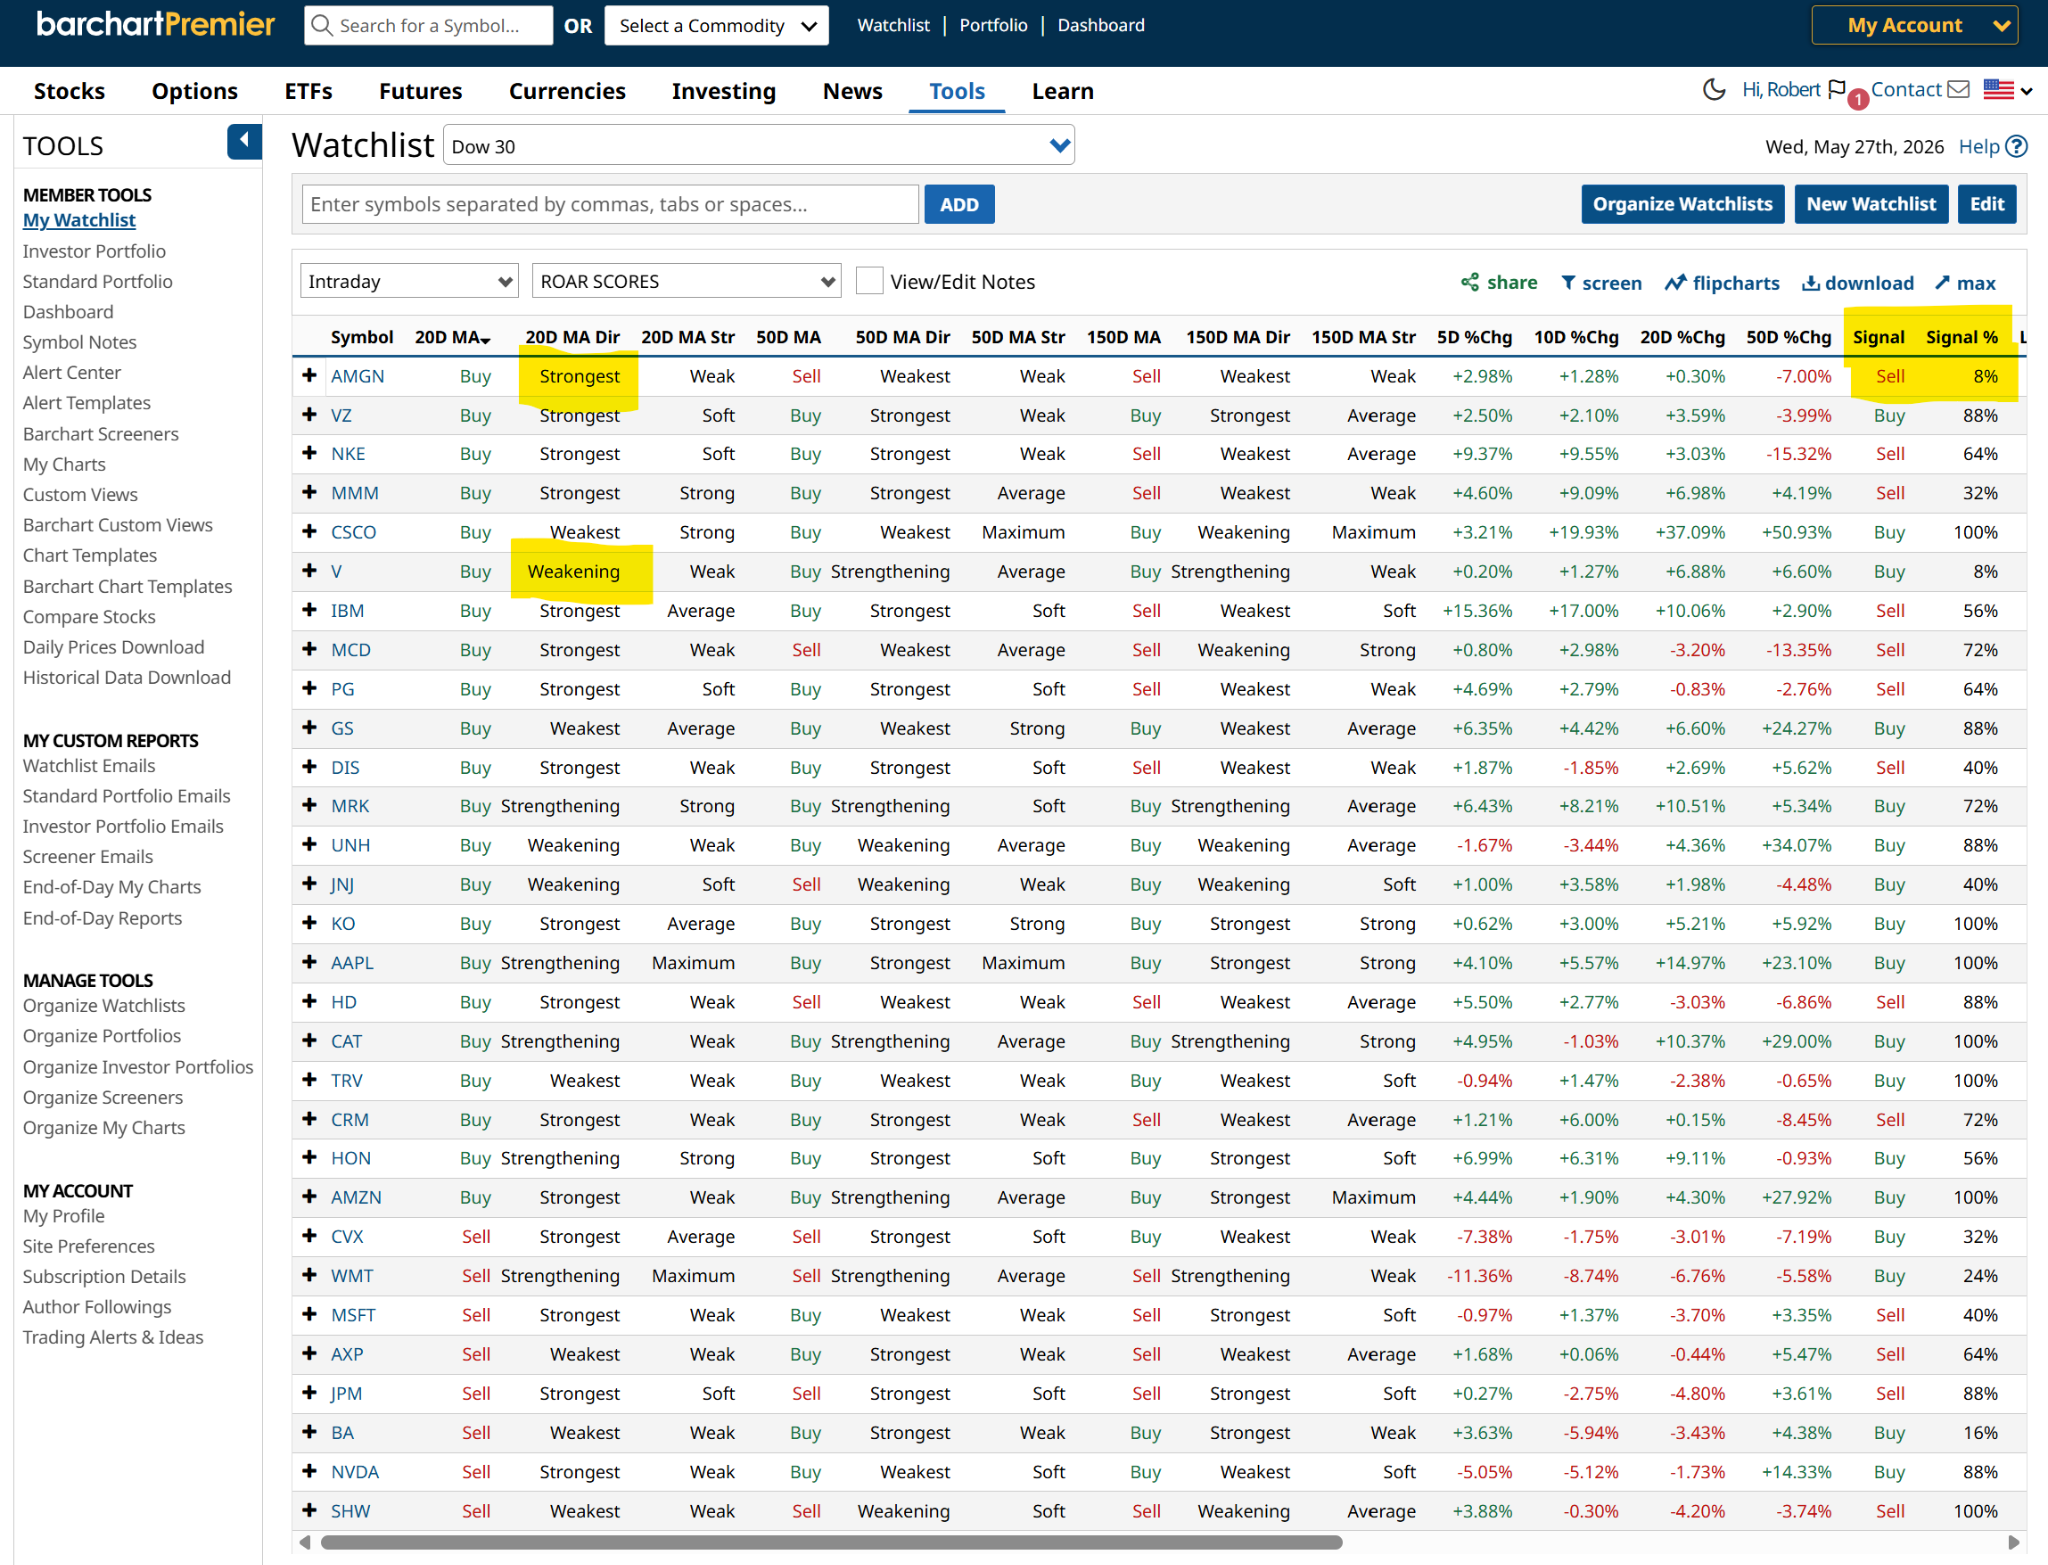 Set up a screener of your own.
 For example, I’m a very risk-averse investor. I assume most investors would see “Buy 100%” and assume that’s a very bullish indication – but if I own that stock, I’m already looking for when to scale back my position size. And if I don’t own it? Oh well, I missed it.
To suit my own risk tolerance, I continue to test out combinations that offer soft entries and graceful exits. As noted in some of my Chart of the Day work, that’s more likely either side of 24% on the buy/sell scale, if it is trending higher.
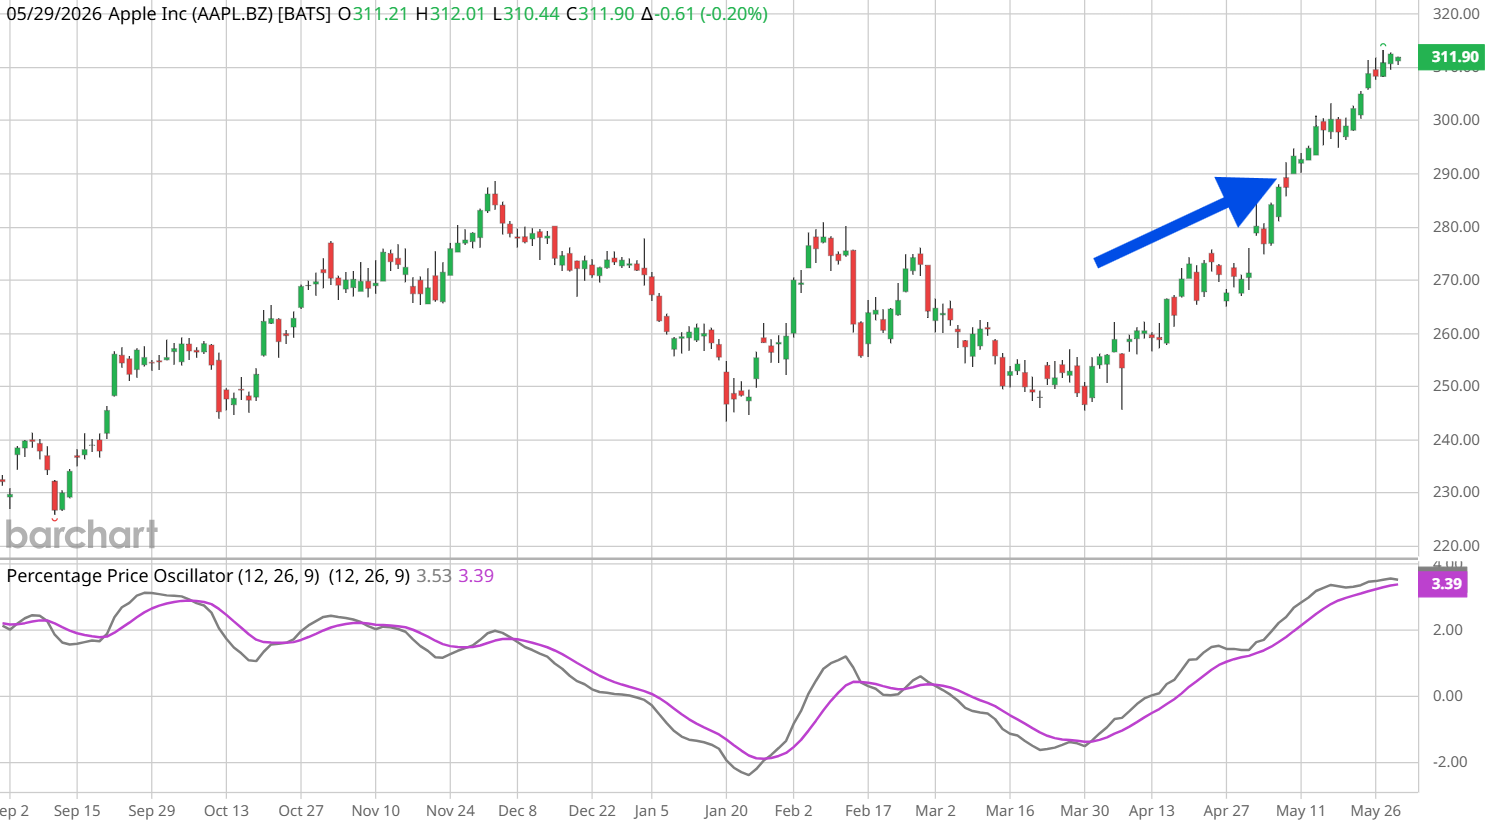 This one rallied after my column.
 One side benefit of taking these excellent Barchart data sets, presented in such a clean fashion, is that if you’re not a very visual person, or if you’d rather not scan loads of numbers to try and isolate what you want, Barchart makes it easy to set up your own screens.
So if you want to drill down on, say, all S&P 500 stocks that now have a Barchart Opinion Score between X and Y, whereas last month’s score was between A and B – it’s very easy.
This focus on shifting trends in the Barchart Opinion reading was going to be part of my personal spin on COTD stock selection. I “overweight” this indicator in my analysis, the same way Jim overweights his own go-to indicators, like the Relative Strength Index (RSI).
So, using Barchart Opinion in the way I’ve convinced myself works for me, and presenting it daily to this audience, was a real motivator. But there’s a lot more to a solid COTD choice, as Jim’s tried-and-true format revealed to me.
Following his lead, I leaned more on the Trend Seeker® "Buy" signal to try to get the short-term wind at my back. That reduced the chances I would be banished to the category of equity analysts known as “often wrong, but never in doubt.”
Next, I checked the moving average alignments – specifically, by looking at how the price interacted with the 20-day and 50-day exponential moving averages. I wanted to see compression at first, followed by a clean expansion.
(Personally, I think it’s possible that the 20-day exponential moving average is the greatest “technical truth-teller” there is. That’s why my own charts have it as a dark red line – I want it to be the first thing I see.)
Finally, I looked for a Percentage Price Oscillator (PPO) crossover from deep negative territory to confirm that institutional money was actually driving the move, rather than retail chatter.
PPO is an indicator that my late father Carl, a longtime amateur chartist and my first investment mentor, showed me as a kid. He built his own composite indicators, as I later did with the ROAR Score, and I had him in mind when I factored PPO into my own “master” indicator. PPO is essentially like the more commonly-used MACD, but it uses percentage price changes, not dollar changes.
PPO is such an under-the-radar indicator, even my Barchart editor Elizabeth Volk was fairly new to it, as we discussed in our recent interview. So that’s one thing she learned from me, versus about 19 I’ve learned from her (a subtle Joey Votto reference there for the Reds fans).
And this is one of those subtle details that that assignment of covering Jim’s COTD beat really makes me really stress-test myself on. If I’m going to be using my own techniques – no matter how many hours I’ve put in as a professional investor (130,000, by my count) – none of that matters to an audience that starts with the perspective of, “Who’s this guy and what did he do with Jim?!”
But now that we’re nearly a dozen posts into this experiment, my return journey in June back into the heart of Chart of the Day will hopefully sound a bit more familiar to the COTD audience, as I fill in for Mr. Van Meerten once again.
Scanning for Stocks Like an AFC North QB
Now, I just shared with you some very nice data points and inputs. But if we can’t string them together into a story that isn’t forced, we don’t have a good Chart of the Day candidate. Finding a stock chart that stands up to real scrutiny is not nearly as simple as, “Which symbols are hot in search, or being talked about on Reddit?”
And for an analyst like me, who had nearly resigned himself to the idea that the stock market has become one big “risk on/risk off” trade, I’ll admit that the thought of finding a new stock idea every weekday was temporarily daunting.
But this is where the real discovery moment was for me. As it turns out, there really is a “market of stocks” and not just a “stock market” in 2026! Frankly, I was relieved.
Remember, I do cursory stock work compared to my macro and ETF research. But the modern miracle of technical analysis married with Barchart.com tools is that any security can be analyzed through the same lens.
So when I dove into the exercise – even though it’s true that many of the massive megacap stocks will likely still move as a collective – there’s so much more happening underneath the surface. And at the risk of making a second Cincinnati-area sports reference: it’s like when Joe Burrow scans downfield and it seems like everyone is covered, but he can still manage to find that tight end or a running back underneath.
That’s why, Apple aside, so many of my COTD selections were not household names. Many were stocks I knew of, but did not have a deep-dive fundamental view on.
Because, as noted above, this exercise is mostly about technicals… with a side of “don’t forget the fundamentals.”
Flipping My Way to a Chart of the Day
But the real magic happened after I loaded those results into Barchart’s Flipcharts feature. A screen gives you numbers; a Flipchart gives you the truth.
As I do all the time for a less-specific purpose (see the reference to “night-charting” in my recent interview), my process here is to rapidly flip through the visual structures of 30 or 40 charts, looking for one specific thing: expected consistency of price appreciation going forward.
In my role as “Jim,” I rejected dozens of fundamentally perfect stocks because their charts looked like an erratic electrocardiogram. In today's fast, algorithmic market, you want a chart that looks like a well-built staircase, not a roller coaster.
This daily technical discipline forced me to confront some harsh realities about today’s market. Whether it was watching Intel (INTC) struggle under the weight of its valuation skis, charting Tesla’s (TSLA) sudden technical resurrection over the $400 mark, or watching a boring staple like Colgate-Palmolive (CL) form a defensive base-building setup, the lesson was identical: the charts strip away the noise.
In today’s environment, single stocks are moving with unprecedented velocity because algorithms amplify every breakout and breakdown. If you rely solely on fundamentals, you will consistently get run over by momentum.
Conversely, if you rely solely on chasing momentum without looking at structural support levels, you are just playing hot potato with institutional traders.
Forcing myself to anchor every single day in pure, unvarnished technical data points reminded me of who I am at my core.
A Great Way to Exploit Modern Markets
Two weeks of filling in for Jim didn't just give me a newfound respect for the daily deadline. It made me realize that many roads in my career have led right back to this single-stock construction space. I just didn’t see it coming.
This brings us to the very heart of the lightning strike, and why those two weeks completely broke my retirement-era macro mindset.
The bottom line is simple: there’s too much opportunity out there in the market’s nooks and crannies to ignore.
Sure, the markets have changed, consolidated, and become index-ified and driven by algorithms.
But what I’ve realized from this COTD cameo is that while those are reasons to shorten my average stock holding period, it is not a reason to totally abandon stock-picking. In fact, it’s a great reason to exploit modern markets by capitalizing on the temporary cheapening of certain stocks, technically speaking.
And while I’m generally wholly against the concept of “exploitation” of virtually any type, I do make one exception: when I can apply decades in the stock market trenches to exploit intermediate-term stock price inefficiencies.
Particularly now, when I can do so in a market that’s largely filled with investors who have only ever known the good times in equities, because we have not had a true bear market since 2008.
Reevaluating Risk in the “Construction Business”
For years, I treated single stocks as an unnecessary risk. Why buy an individual stock, I thought, when an ETF gives you the same thematic exposure with a built-in diversification cushion?
Oh, sure; I’ve traded stocks, but mostly with the intention of “renting” them for a week or two at most.
That just changed. My timeframe hasn’t necessarily stretched into single-stock ownership for years (though I am always open to that), but now it’s something similar to my ETF trading activities: weeks to months.
Managing other people's money as a fiduciary advisor until 2020 conditioned me to think in terms of asset preservation, broad baskets, and systemic macro defense. I had resigned myself to the cynical idea that the modern market was just one giant, macro-driven "risk-on/risk-off" trade algorithm.
The daily rigor of writing Jim’s Chart of the Day column completely shattered that bias. When I stopped looking at single stocks as volatile landmines and started looking at them through Barchart’s technical lens, I realized that single-stock picking hasn’t totally turned into the Wild West (some parts, yes; many parts, no). Instead, it is about structural precision.
An ETF might protect you from a single stock's failure, but it also dilutes a single stock's technical attractiveness. By looking at individual setups like Tesla’s clean reclamation of the $400 level or the absolute baseline support holding up defensive names, I rediscovered the pure joy of finding an edge.
Nearly my entire career has been spent as a portfolio manager. I used to tell people I was in the “construction business” – not building shopping malls or homes, but building portfolios.
Renting Jim’s column for two weeks reminded me that I miss the construction site. It reminded me that single stocks allow for tactical precision that broad asset classes simply cannot match in a fast-moving market.
And it made me realize that many roads in my career have led right back to this single-stock construction space. Sure, a list of random stock picks is no place to live, let alone visit… but an intentional collection of technically sound single stocks can be your very own structural masterpiece.
Rob Isbitts created the ROAR Score, based on his 40+ years of technical analysis experience. ROAR helps DIY investors manage risk and create their own portfolios. For Rob's written research, check out ETFYourself.com.
On the date of publication, Rob Isbitts did not have (either directly or indirectly) positions in any of the securities mentioned in this article. All information and data in this article is solely for informational purposes. For more information please view the Barchart Disclosure Policy here.
More news from Barchart
2 Weeks in May Rekindled My Love for Stock Picking. Here’s My Daily Trading Routine. The S&P 500’s Price Is Getting Better Every Week, But This Indicator Keeps Getting Worse. Why 52% Could Be The Market’s Tragic Number. Unusual Options Activity in Key ETFs Unveils 3 Trade Ideas Here Nvidia and Micron Stocks Are Almost Exclusively Driving S&P Earnings Strength. These 3 Very Real Risks Could End It All.