Bitcoin’s latest price action has given bearish analysts more reason to argue that the cryptocurrency is still moving through a deeper correction. Bitcoin has fallen back to $70,000, and selling pressure is building after another failed attempt to hold higher levels. Crypto analyst Crypto Lens has warned that Bitcoin may still need one final move lower to $42,000 before a new bull run back to new all-time highs above $126,000 can begin.
Bitcoin Is Still Inside A Bull Trap
Technical analysis of Bitcoin’s price action is predicting a bearish outlook during a tense moment for the cryptocurrency. Bitcoin has already corrected by over 15% since it reached $82,850 in early May, but technical analysis from crypto analyst Crypto Lens suggests that the downtrend might not end until Bitcoin breaks below $50,000.
Notably, Crypto Lens’ chart presents the current Bitcoin setup as a cycle transition. The analyst’s roadmap begins from the idea that Bitcoin has already printed its major top near $126,199 in October 2025 and has since been moving through a series of failed recovery attempts.
The first major rejection on the chart is labeled as “Bull Trap #1,” which appeared after Bitcoin failed to hold the upper distribution zone close to the all-time high area between November 2025 and January 2026. From there, the price collapsed into a lower red range in February 2026.
Bitcoin then attempted another bounce in May, but Crypto Lens’ chart marks that move as “Bull Trap #2.” The analyst’s view is that this second trap is now close to completion, with the next expected move being a decline into a lower accumulation zone before the market can begin building toward the next major cycle.
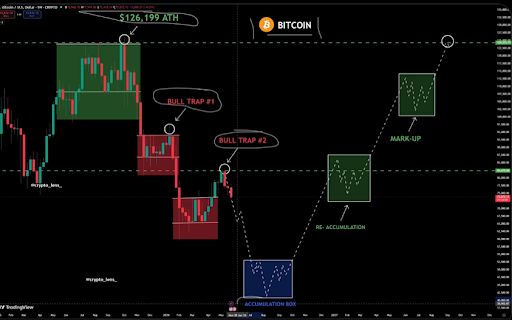
Bitcoin Price Chart. Source: @crypto_lens_ On X
The $42,000 Crash Before The $126,000 Bull Run
The most interesting part of Crypto Lens’ analysis is that the bearish target does not cancel the bullish endgame. The chart shows Bitcoin falling into a blue accumulation range around $42,000 before gradually entering a re-accumulation phase and then a markup stage. Therefore, the analysis is effectively arguing that Bitcoin must go lower first because the current structure still lacks a proper bottom.
The roadmap also gives the move a longer time horizon that extends outside 2026. The accumulation range around $42,000 is expected to stretch through the middle of 2026, and the re-accumulation box extends into early 2027. The markup phase then points to a recovery across 2027, with the final target breaking above the current all-time high line at $126,100.
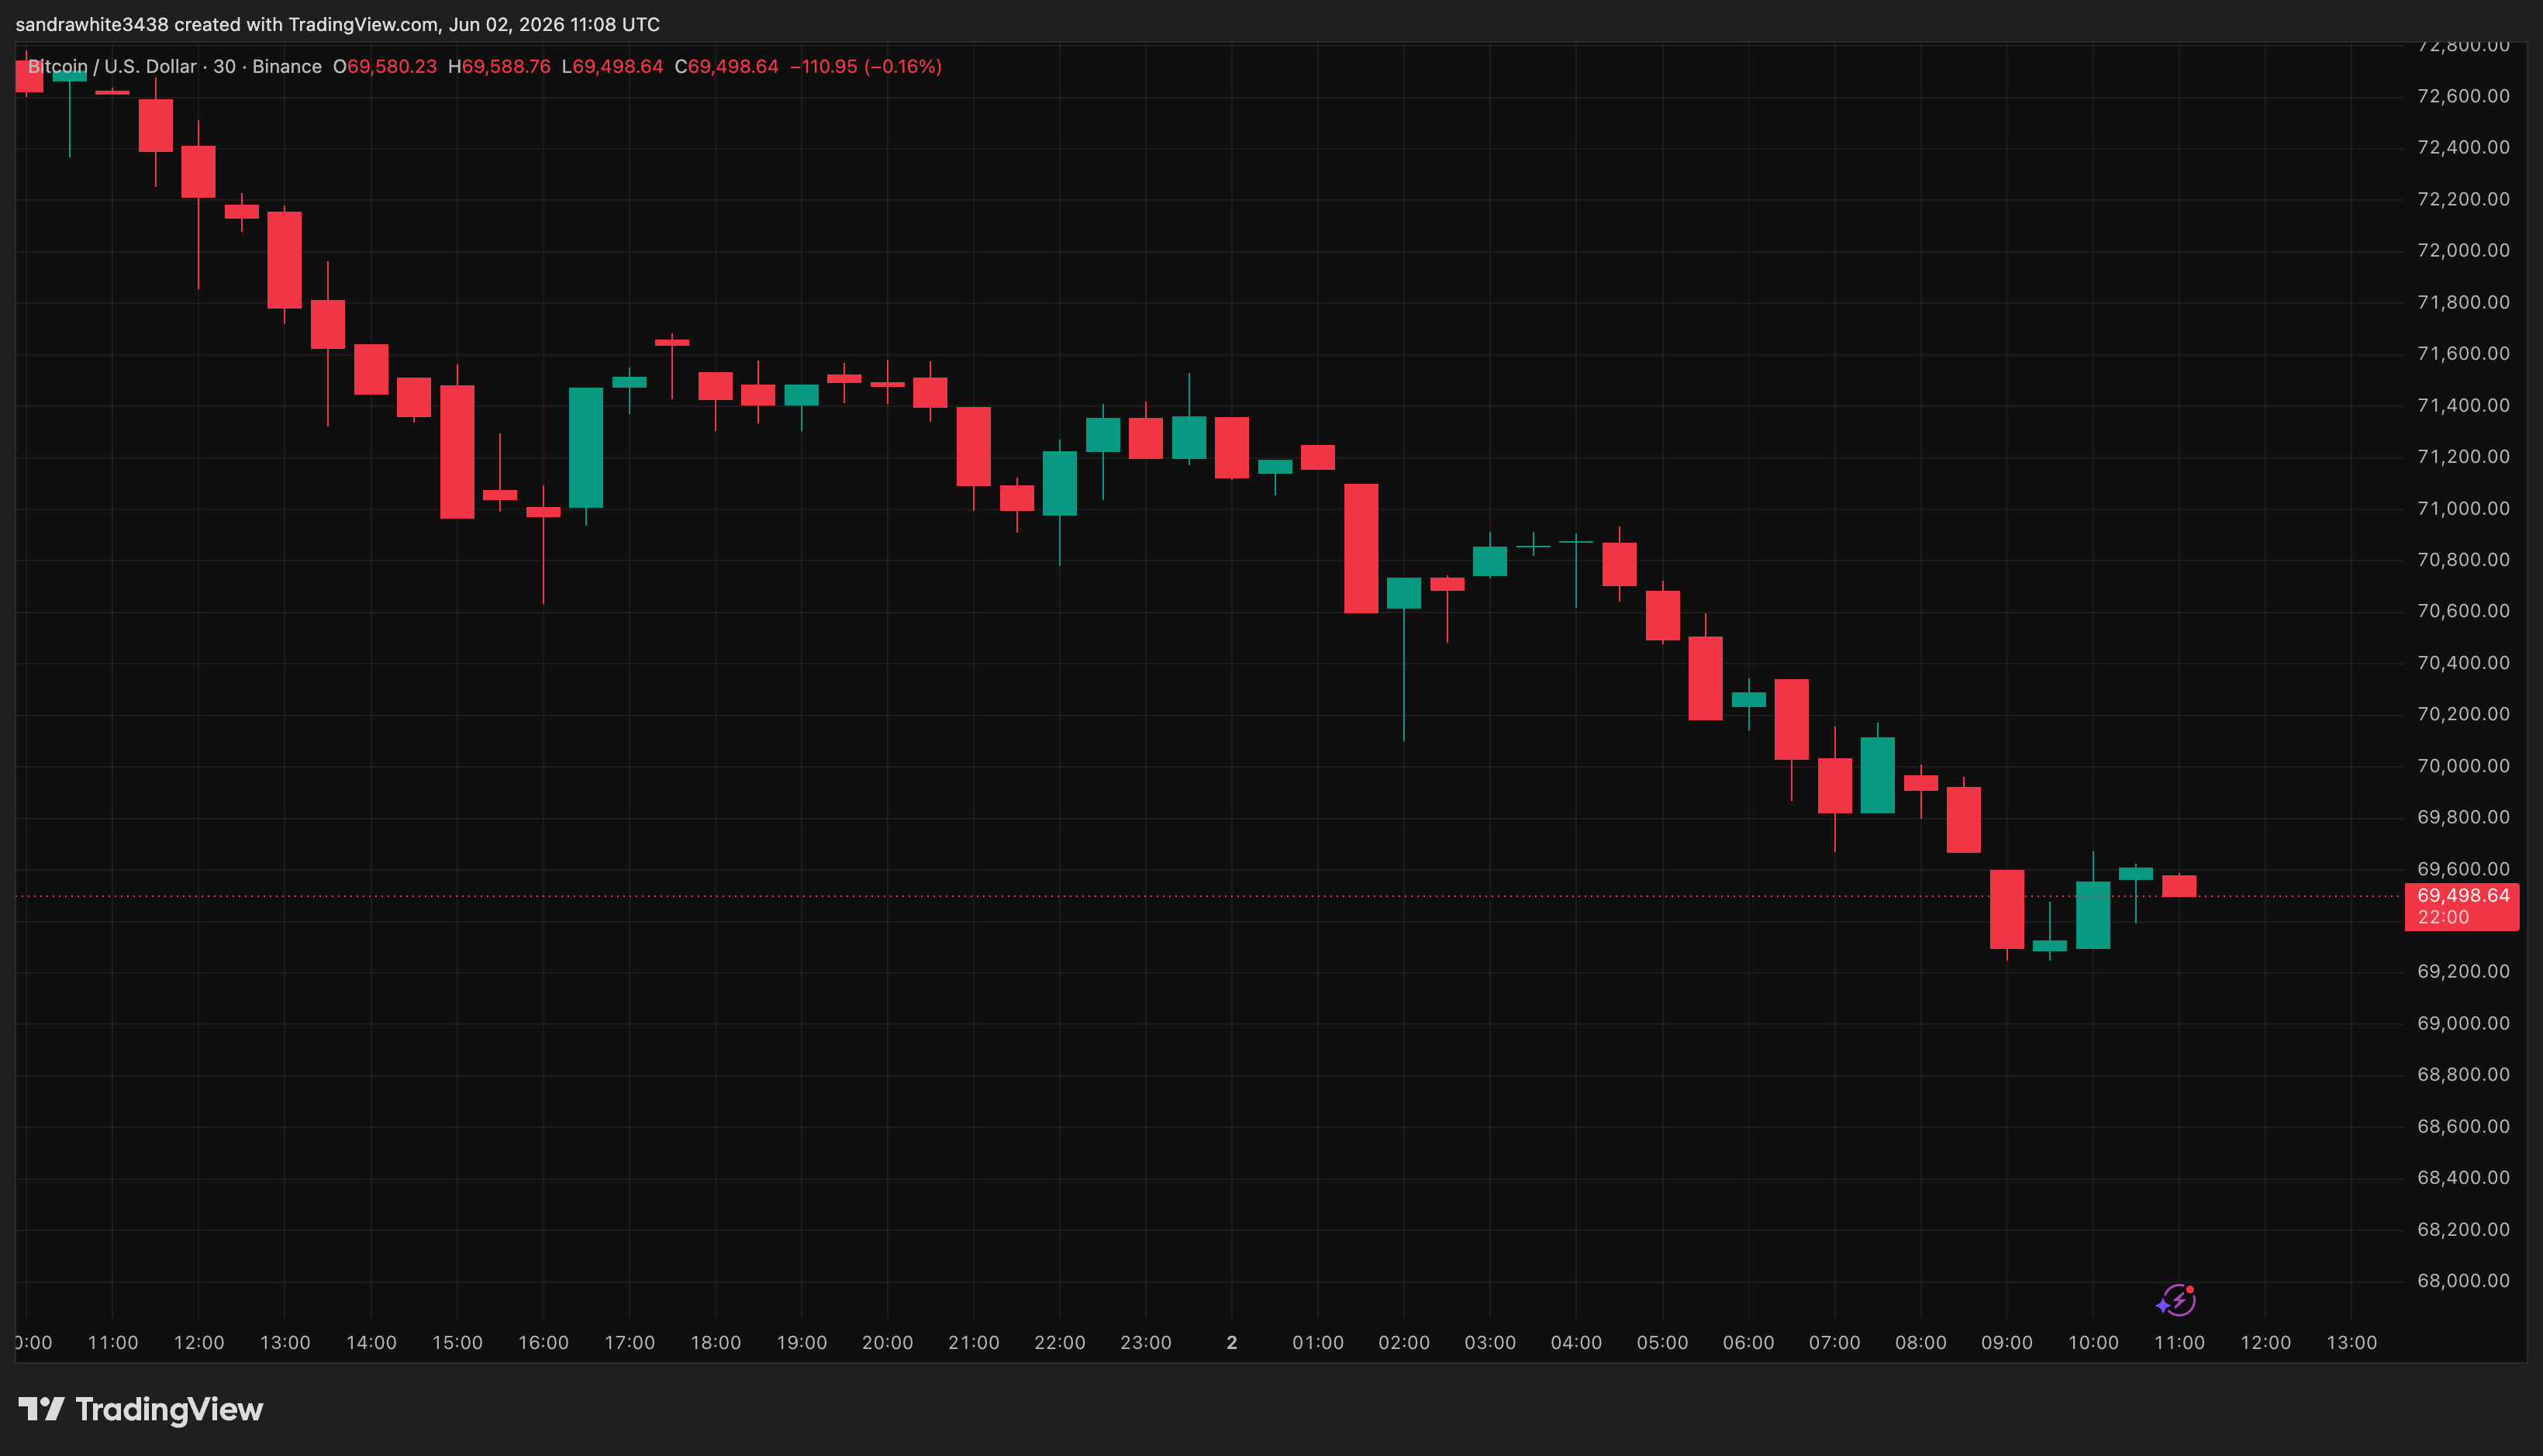
At the time of writing, Bitcoin is trading at $69,920, down 3.9% over the past 24 hours after slipping below $70,000 from an intraday high of $72,929. The decline also comes amid news that Strategy sold a small portion of its Bitcoin holdings for the first time since December 2022.