

Each year, the U.S. gasoline market goes through an important seasonal transition. The Environmental Protection Agency (EPA) generally requires lower-volatility gasoline during the summer ozone season, beginning May 1 for refiners and terminals and June 1 for retailers, and generally ending September 15. Lower Reid Vapor Pressure (RVP) gasoline reduces evaporative emissions during hot weather but can be more costly to produce. When these restrictions end, refiners transition toward winter-grade gasoline. At the same time, the peak summer driving season is ending, reducing seasonal gasoline demand and some of the demand for crude oil used by refiners.
These changes help create seasonal headwinds for crude oil during the fourth quarter. Summer vacations end, children return to school, and highway travel typically retreats from its summer peak. Another interesting influence appears late in the year. December 31 is an important property-tax assessment date for crude oil inventories in many Gulf Coast jurisdictions, giving refiners and other crude oil holders an incentive to reduce year-end stocks. U.S. Energy Information Administration (EIA) data show this pattern remains remarkably persistent: from 2012 through 2025, Gulf Coast commercial crude inventories declined from November to December in 13 of 14 years, averaging about 8.9 million barrels.
Don’t Miss a Day: From crude oil to coffee, sign up free for Barchart’s best-in-class commodity analysis.
This year, however, seasonality must share the stage with geopolitical risk in the Middle East. The region remains critical to global petroleum supplies, and unexpected military escalation, production disruption, or interference with major shipping routes could quickly alter the supply-and-demand outlook. That does not eliminate the historical fourth-quarter tendency toward weaker crude oil prices, but it reminds traders that seasonality is a tendency—not a guarantee. The seasonal setup may favor the short side. However, traders still need a defined risk-management plan that can protect them when an unexpected geopolitical event produces a sharp counter-seasonal rally.
Crude Oil Technical Picture
Source: Barchart
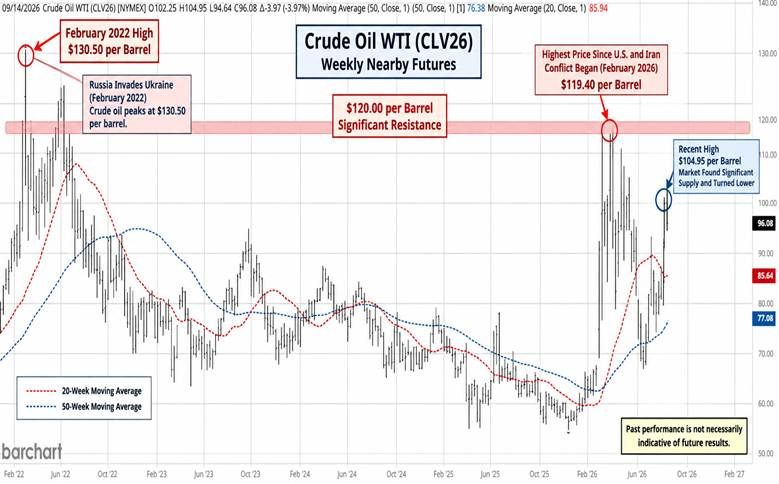
The Barchart weekly nearby futures chart highlights key technical levels. Technically, crude oil remains bullish despite the seasonal headwinds ahead. Prices are trading above both the 20-week and 50-week Simple Moving Averages (SMA), while the 20-week SMA remains above the rising 50-week SMA. Recent price action also supports the bullish trend, with the market producing higher highs and higher lows. The first support area to watch is near $93.50 per barrel, the high from the week of July 20, which could be tested after the recent rally. More important support sits at $74.23, the low from the week of August 3. A break below that level would disrupt the current pattern of higher lows and could quickly change sentiment among price-action traders. Moving-average traders have another signal to watch: if the 20-week SMA crosses and closes below a declining 50-week SMA, the longer-term technical picture would turn bearish, increasing the likelihood that subsequent rallies meet selling.
Seasonal Pattern
Source: Moore Research Center, Inc. (MRCI)
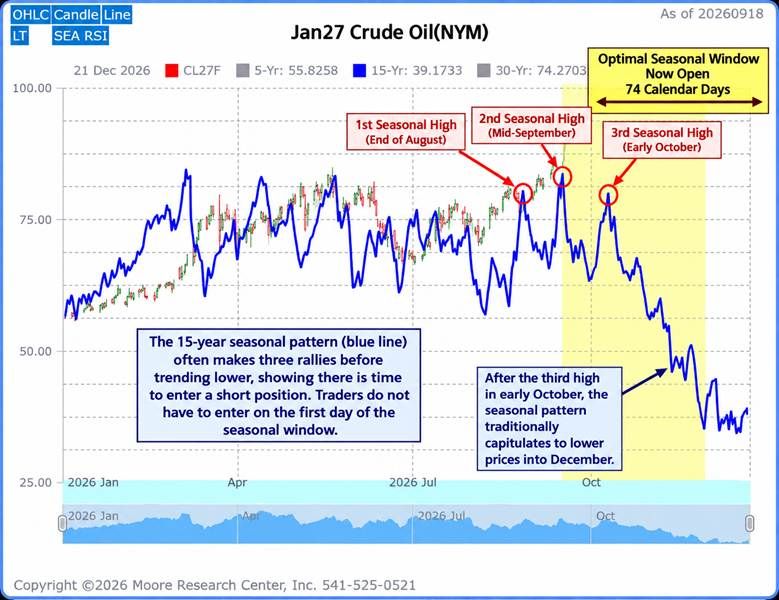
With fundamentals as consistent as described earlier during the fourth quarter, MRCI has quantified a 15-year seasonal sell pattern for the January crude oil futures contract. We will trade the January contract, as the seasonal window does not close until the end of November. This seasonal pattern is one of several that will come out during the fourth quarter. The key here is not to rush into the seasonal sell, as noted in the seasonal chart above.
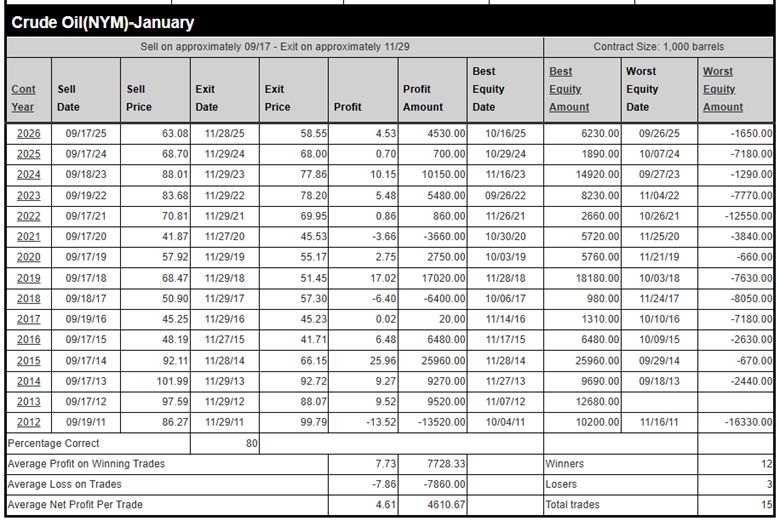
MRCI has found that the January crude oil futures contract has closed lower on or about November 29 than on September 17 for 12 of the past 15 years, an 80% occurrence. In hypothetical testing, the average profit per standard-size contract was $4,610.67.
With a 74-calendar-day optimal seasonal sell window, all types of trading styles can participate. Short-term traders can trade in and out with a bearish sentiment supported by technical price action. Longer-term traders can build core positions as prices decline. Options traders can use puts or call strategies to structure bearish exposure with defined risk.
Source: MRCI
As a crucial reminder, while seasonal patterns can provide valuable insights, they should not be the basis for trading decisions. Traders must consider technical and fundamental indicators, risk management strategies, and market conditions to make informed, balanced trading decisions.
Assets to Trade in the Crude Oil Market
Traders can participate in the crude oil market in several ways, depending on their account size, risk tolerance, and preferred trading vehicle. The standard West Texas Intermediate (WTI) Crude Oil futures contract (CL), traded on the New York Mercantile Exchange (NYMEX), a division of the Chicago Mercantile Exchange (CME) Group, represents 1,000 barrels of crude oil. Hence, a $1.00-per-barrel price move equals $1,000 per contract. For traders seeking smaller exposure, the Micro West Texas Intermediate Crude Oil futures contract (CY) represents 100 barrels, making a $1.00 move worth $100 per contract. Traders can also use crude oil futures options to structure positions with defined risk or capitalize on volatility changes. Equity traders who prefer not to trade futures can gain exposure through the United States Oil Fund (USO), an exchange-traded fund (ETF) designed to track daily percentage changes in benchmark crude oil futures. Each vehicle behaves differently and carries its own risks, so match position size and risk management to the instrument being traded.
In Closing…
As the fourth quarter approaches, crude oil traders have a seasonal pattern supported by identifiable changes in the physical energy market. The EPA transition from summer-grade to winter-grade gasoline coincides with the end of the peak summer driving season, easing some of the seasonal demand placed on refiners and crude oil supplies. Historically, these fundamental changes, followed by the tendency for Gulf Coast crude inventories to decline toward year-end, have helped create an environment favorable to lower crude oil prices. However, the seasonal chart reminds us that lower prices do not necessarily begin the moment the seasonal window opens. Multiple rallies can occur before the larger decline develops, giving patient traders time to wait for price action and technical indicators to confirm the seasonal outlook. With geopolitical risk in the Middle East capable of producing sudden rallies, disciplined risk management remains essential. Seasonality provides the roadmap, fundamentals help explain why the road exists, and price action ultimately determines when it is time to travel it.
On the date of publication, Don Dawson did not have (either directly or indirectly) positions in any of the securities mentioned in this article. All information and data in this article is solely for informational purposes. For more information please view the Barchart Disclosure Policy here.
More news from Barchart
Crude Oil Three Rallies Before the Fall Domino's Pizza Stock Is Dirt Cheap, With 30% Potential Upside - What's the Best Play? IonQ's Options Are the Cheapest They've Been All Year. Here's the Trade That Takes Advantage. Warby Parker’s Unusual Options Activity Points to a Covered Call Bet: Bullish on Growth, Cautious on Valuation