


It wasn't a Thriller as far as the Nasdaq was concerned after the Index took out its September low at Friday's open, settling the stage for a bearish long-term technical reversal.
The ripple effects of falling stock markets could be seen in the continued slaughter of red meat markets, as well as buying in US Treasury futures.
Don’t Miss a Day: From crude oil to coffee, sign up free for Barchart’s best-in-class commodity analysis.
The Grains sector was also under pressure Friday, but in the end, at least the Corn market continued to make sense.
Afternoon Summary: This is one of those days when one asks, “Where do you start?” For me it begins with a story: I saw one scene of one episode of the HBO miniseries Game of Thrones, and it just happened to be the infamous Red Wedding[i]. Let’s just say HBO sliced and diced – literally – it’s payroll in one scene. And while a look at the Barchart Futures Market Heap Map isn’t overly frightening, there were markets that stand out. Let’s start with the high-tech stock Nasdaq Index ($NASX) . The Index closed Friday down 750 points (2.8%), dragging the S&P 500 ($INX) (1.8%) and Dow Jones Industrial Average ($DOWI) (1.1%) with it. Despite that bloodletting, a move that could have long-term ripple effects across the global investment industry, the Metals sector was the hardest hit with silver down 6.1% (taken to the glue factory?) and gold off 3.3%. Energies anchored the other end of the scale led by WTI crude oil with a gain of 2.75% while diesel fuel was up 2.5%. Another sector of interest was Financials (US Treasury futures) where markets were in the green across the board. Why? Money is flowing out of equities and into Treasuries as a safe-haven to close out this week and to get ahead of next week.
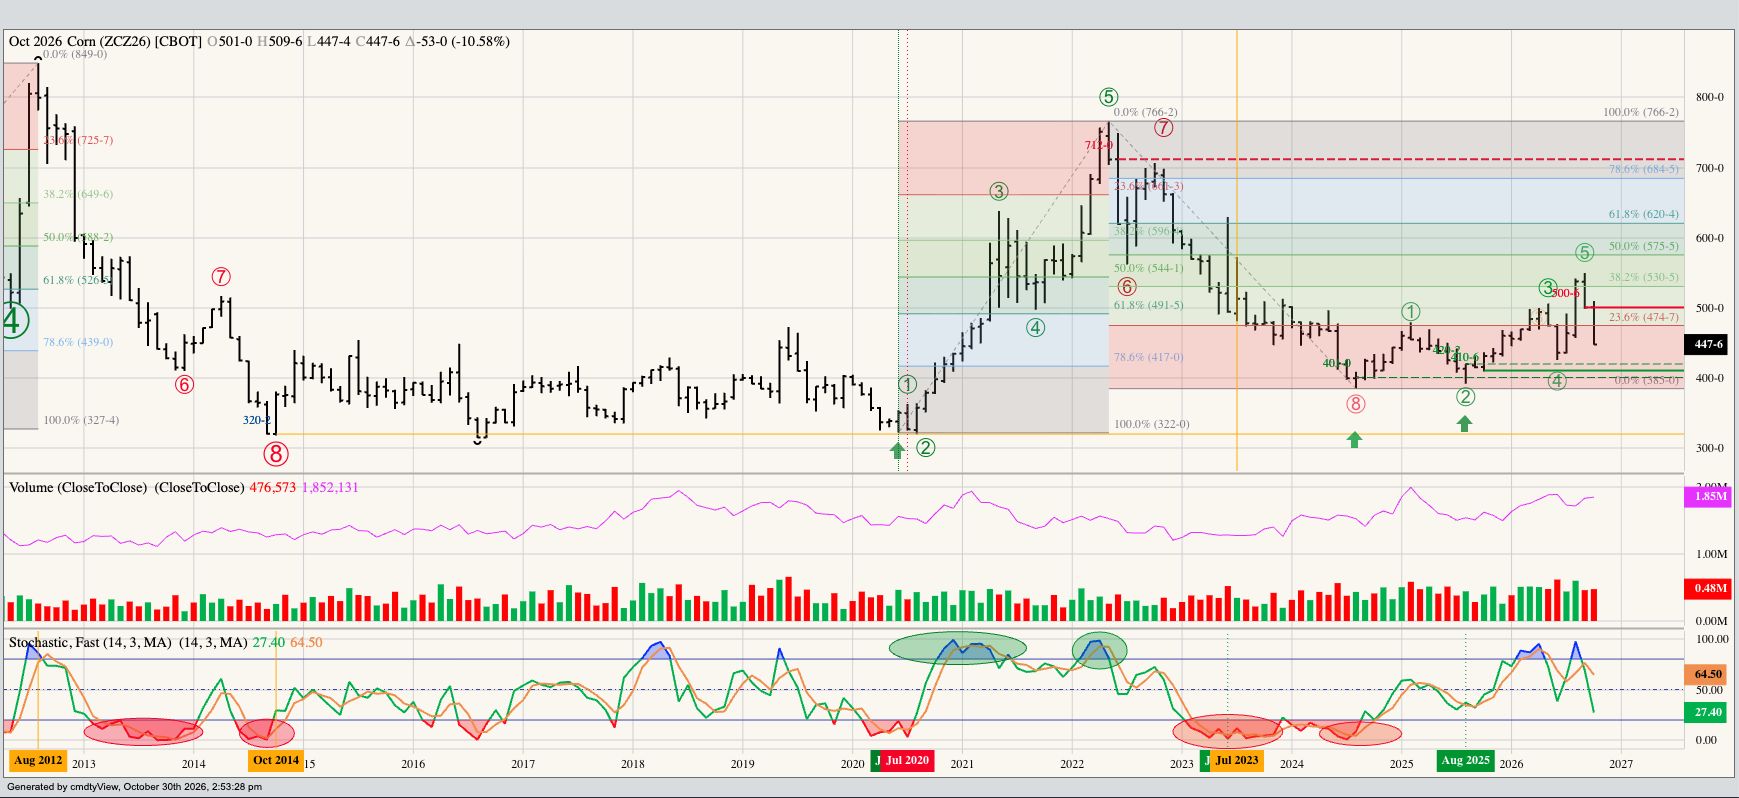
Corn: While the rest of the world seems to be falling apart at the seams, the corn market continues to make sense. The December contract (ZCZ26) closed 3.5 cents in the red Friday, but gained 0.25 cent on March and 0.5 cent on May. This tells us most of the pressure to close out the month came from the noncommercial side. Speaking of Watson, recall Dec26 finished the latest Tuesday-to-Tuesday positioning week with a loss of 13.25 cents indicating the noncommercial net-long futures position was decreased once again. We’ll get the next update Friday afternoon. On the commercial side, the Dec-March futures spread covered 44.5% calculated full commercial carry as compared to last Friday’s settlement covering 48%. This tells us most of the bushels being harvested now are headed for on-farm storage, likely to be tucked away until next year. It should be noted at the end of last month the Dec-March spread covered 48.5% while last year’s edition of the spread closed October 2025 covering 40%. For the record, after completing a bearish technical reversal on its long-term continuous monthly chart at the end of September, Dec26 was down 8.25 cents for the week (0.25 cent off the weekly low) and down 53.0 cents for the month.
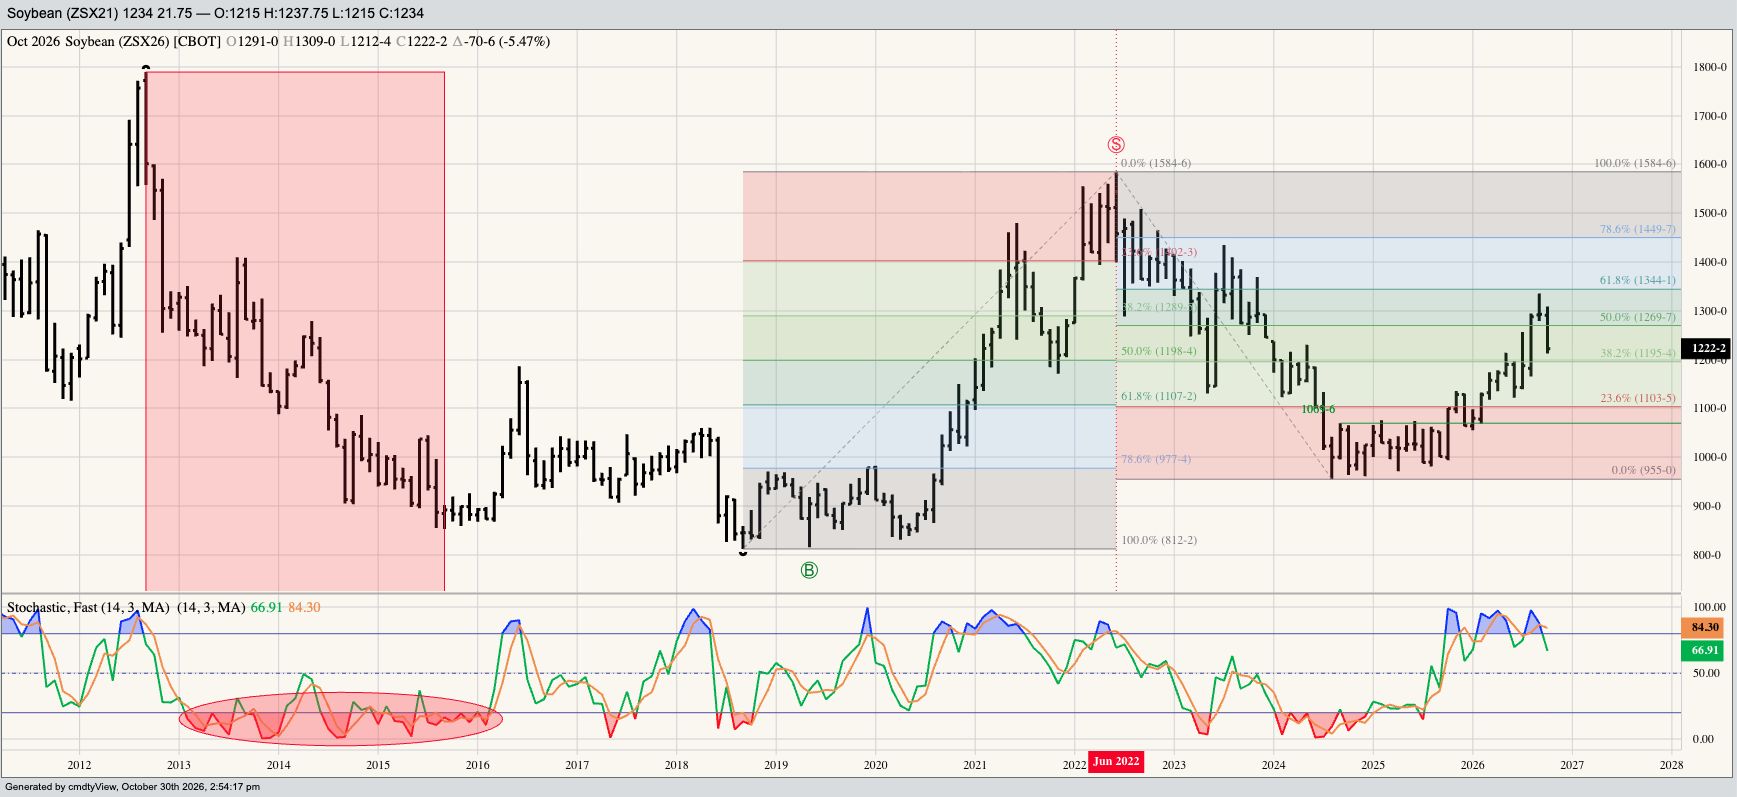
Soybeans: The soybean market was all over the place Friday. But the beauty of following the Wilhelmi Element, “The only price that matters is the close”, is that we only have to check in on it after the dust has settled. In this case for the day, week, and month. The January issue was sitting 0.5 cent in the red and lost 0.75 cent to March, the spread covering 36% calculated full commercial carry at the close. Further out, the March-May spread, our key read on Brazil’s next crop, finished today covering 33%. For comparison, these same two spread closed last week covering 28% and 27% respectively meaning commercial traders were aggressively selling. Let’s break Rule #5[ii] and talk about why. January lost ground to March because the November contract was heading into delivery and merchandisers were hedging purchases in the January issue. March was losing ground to May because spring weather has turned more favorable for Brazil’s 2027 crop the last couple weeks. I want to mention the Nov26 issue. Using the Horseshoe Proximity[iii], it could be argued Nov26 completed a bearish technical reversal at the end of September as well. Nov26 then closed October down 70.75 cents.
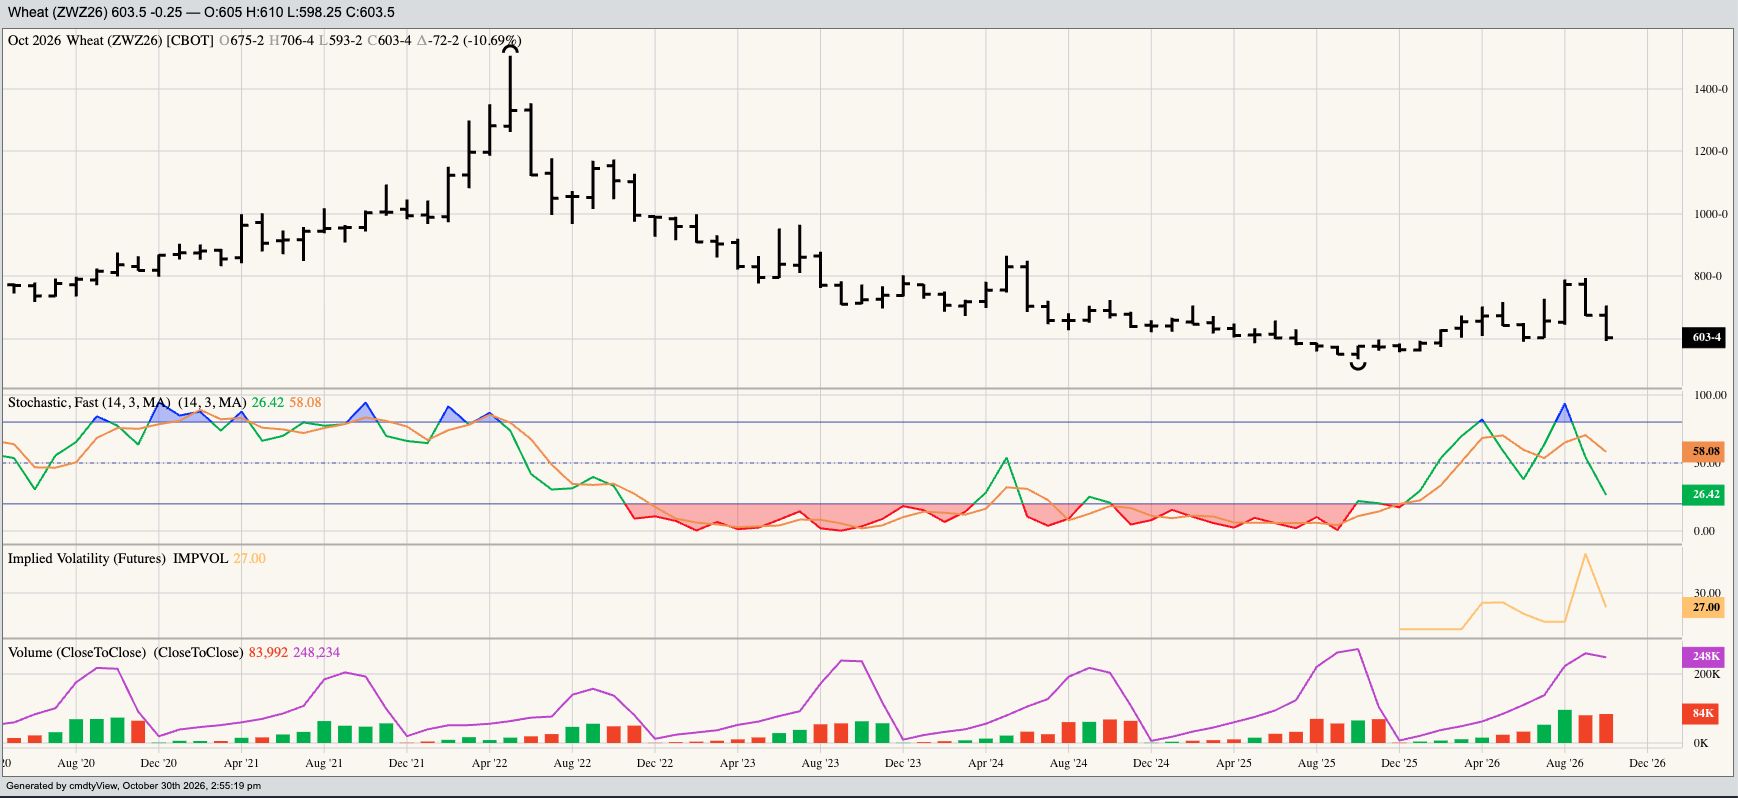
Wheat: Was the wheat sub-sector able to hold its early gains through the end of the day, week, and month? No, but I doubt that surprises many of you. It was close in SRW where the December issue finished only one tick, 0.25 cent, in the red Friday. However, if we want to expand our view a bit, Dec was down 21.5 cents for the week, but as optimists will point out, was 10.25 cents off its weekly low. Not to dampen their thoughts, but Dec SRW was also down 72.25 cents for the month. So, there’s that. Fundamentally, the Dec-March spread covered 58% calculated full commercial carry as compared to the end of September’s 62%. Switching over to HRW we see the December issue (as well as the March, May, and July) closed 1.0 cent lower Friday. That’s not so bad, right? As I’ve mentioned, this was the ninth consecutive lower weekly close (for a number of wheat contracts) with Dec finishing 20.25 cents lower for the week, extending the monthly loss to 88.75 cents. Oof…As for HRS, the December issue was down 0.75 cent for the day, 17.75 cents lower for the week (after setting a new contract low), and 69.5 cents for the month.
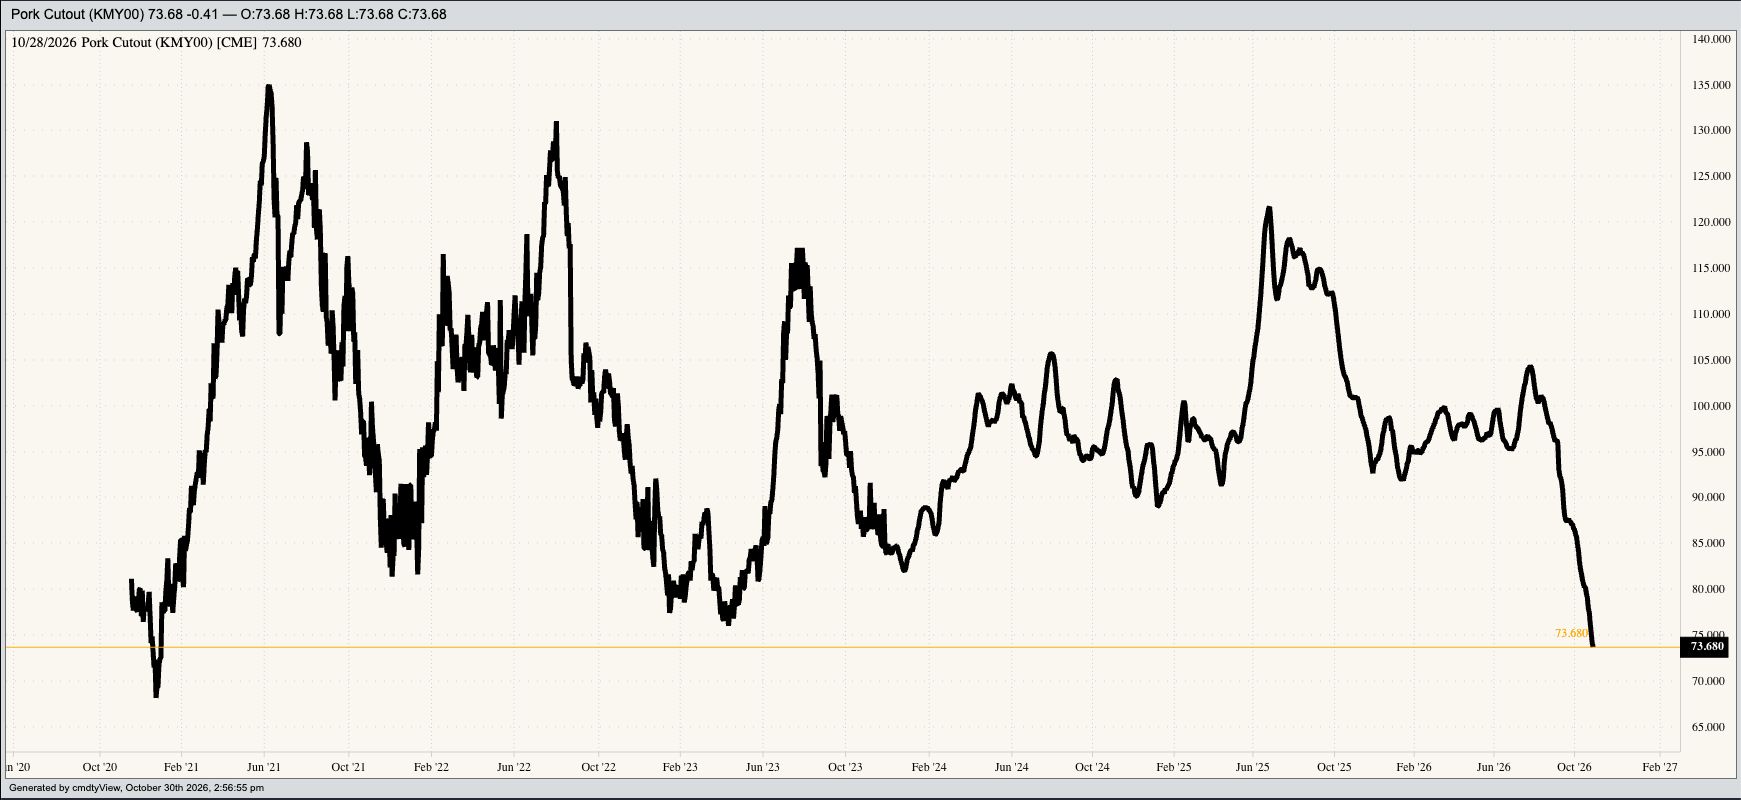
Livestock: A friend in the pork industry sent me a message Friday asking, “Is US consumer pocketbook fatigue part of the problem (with pork cutout)?” My friend touched on a project I’ve been working on for a while. Hog and pork markets have been boiled down to two simple rules: Rule 1, “Don’t get crossways with the trend” and Rule #6, “Fundamentals win in the end”. Let’s start with the first rule. Funds have moved from a net-long futures position of 103,357 contracts on Tuesday, September 30, 2025, to a likely record large net-short futures position beyond 81,787 contracts when the latest Commitments of Traders report comes out Friday afternoon. Why? Because the pork cutout price won’t stop going down. The 2026 high for the CME Pork Cutout Index was $104.34 on July 27. The latest Index price, for October 28, was $73.68, down roughly 30% in three months. For the record, December lean hogs finished Friday down $1.00 for the day, down $6.80 for the week, and down $10.70 for the month. But hogs weren’t alone as strong selling was seen in both cattle markets as well, commercial activity in live and noncommercial in feeders. The January feeder contract closed $10.175 (3.0%) lower for the day.
[i] Even after all these years, it’s fun to watch videos of people seeing that scene for the first time.
[ii] It’s the what, not the why.
[iii] Close is close enough.
On the date of publication, Darin Newsom did not directly have a position in any of the securities mentioned in this article. All information and data in this article is solely for informational purposes. For more information please view the Barchart Disclosure Policy here.
More news from Barchart
Why Did Friday's Session Remind Me of The Red Wedding? Buy the British Pound as the Bank of England Turns Hawkish Nasdaq Futures Plummet as Disappointing Amazon and Intel Earnings Deepen Tech Rout The Collapse of Brazil’s Bolsonaro Bet and Interest Rates vs. Ag Markets