


lululemon athletica inc. (LULU), headquartered in Vancouver, Canada, designs, distributes, and retails athletic apparel, footwear, and accessories under the lululemon brand for women and men. Valued at $12.2 billion by market cap, the company produces fitness pants, shorts, tops and jackets for yoga, dance, running, and general fitness.
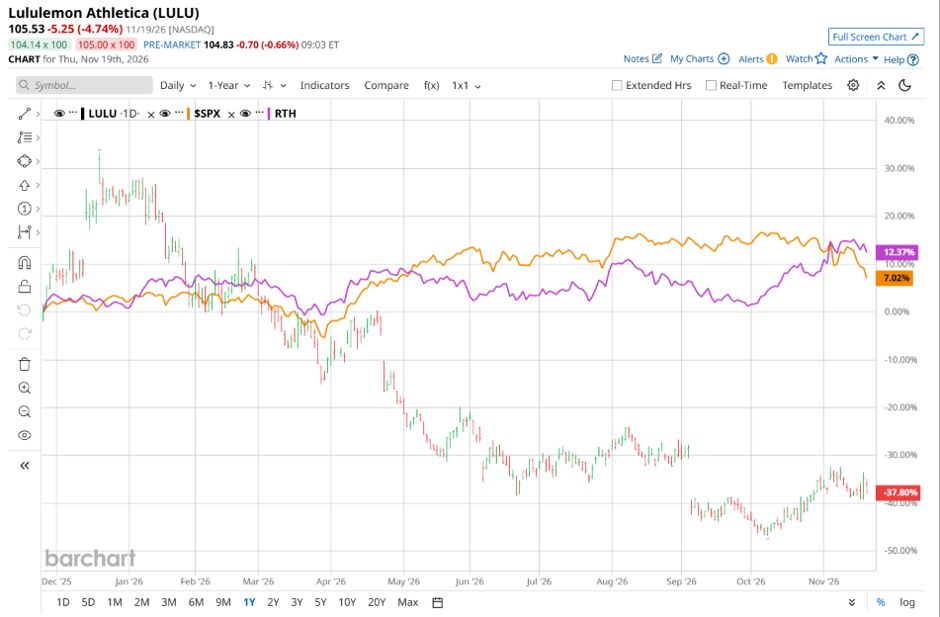
Shares of this athletic apparel giant have significantly underperformed the broader market over the past year. LULU has declined 36.4% over this time frame, while the broader S&P 500 Index ($SPX) has rallied nearly 8%. In 2026, LULU stock is down 49.6%, compared to the SPX’s 4.8% rise on a YTD basis.
More Top Stocks Daily: Go behind Wall Street’s hottest headlines with Barchart’s Active Investor newsletter.
Narrowing the focus, LULU’s underperformance is also apparent compared to the VanEck Retail ETF (RTH). The exchange-traded fund has gained about 13.9% over the past year. Moreover, the ETF’s 11.4% returns on a YTD basis outshine the stock’s losses over the same time frame.
 www.barchart.com
LULU’s stock underperformance reflects a combination of deteriorating core demand, repeated guidance resets, and heavy multiple, sentiment, and legal pressure. Weak traffic, negative social chatter, and uneven product launches weighed on sales across the Americas and China, and core leggings demand dropping about 20% as shoppers shifted toward looser silhouettes. Those shortfalls triggered sharp post-earnings sell-offs, including drops of roughly 8.6% in June 2026 and 17.4% in September 2026, after management slashed full-year revenue and profit outlooks and issued soft Q3 guidance, compounded by underlying margin pressures, CEO transition uncertainty under Heidi O’Neill, cautious Wall Street revisions, and a shareholder class action tied to the sharp sell-offs.
On Sep. 3, LULU reported its Q2 results, and its shares tumbled 17.4% in the following trading session. Its EPS declined 5.8% from the year-ago quarter to $2.92. The company’s revenue was $2.4 billion, missing Wall Street forecasts of $2.5 billion. The company expects full-year EPS to be $9.48 to $9.73, and revenue ranging from $10.4 billion to $10.5 billion.
For the current fiscal year, ending in January 2027, analysts expect LULU’s EPS to decline 28.6% to $9.47 on a diluted basis. The company’s earnings surprise history is impressive. It beat the consensus estimate in each of the last four quarters.
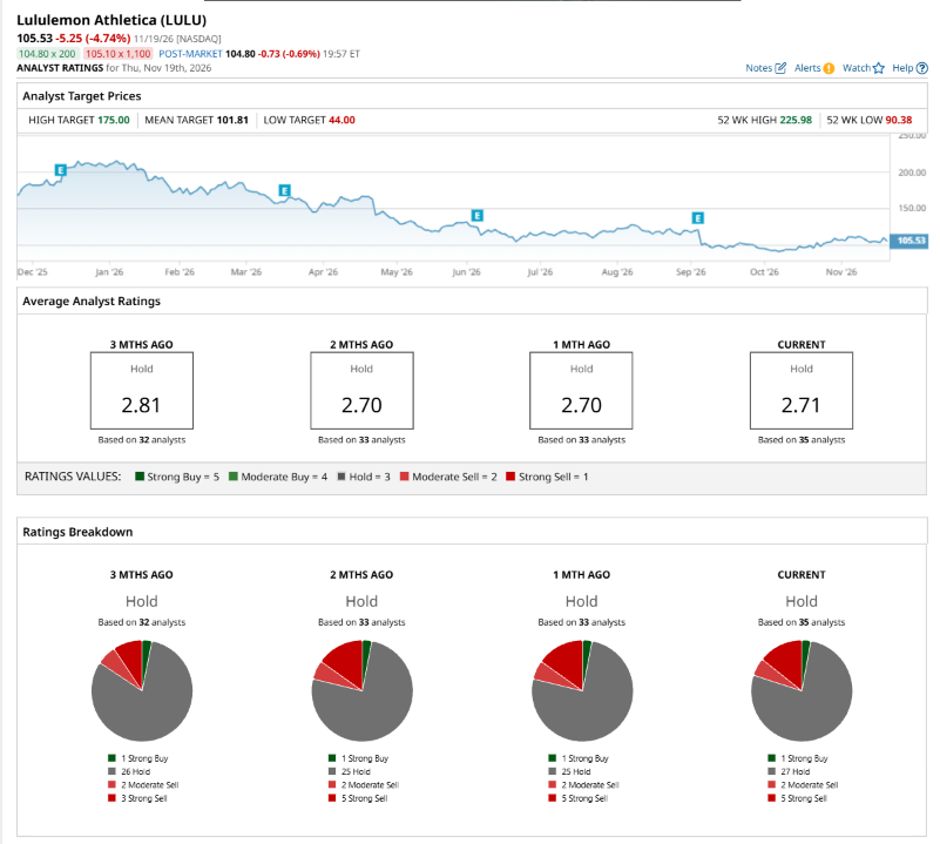
Among the 35 analysts covering LULU stock, the consensus is a “Hold.” That’s based on one “Strong Buy” rating, 27 “Holds,” two “Moderate Sells,” and five “Strong Sells.”
 www.barchart.com
This configuration is more bearish than three months ago, with three analysts suggesting a “Strong Sell.”
On Nov. 13, Morgan Stanley (MS) analyst Alex Straton kept an “Underweight” rating on LULU and raised the price target to $87.
While LULU currently trades above its mean price target of $101.81, the Street-high price target of $175 suggests a notable upside potential of 65.8%.
On the date of publication, Neha Panjwani did not directly have a position in any of the securities mentioned in this article. All information and data in this article is solely for informational purposes. For more information please view the Barchart Disclosure Policy here.
More news from Barchart
Is Serve Robotics Stock’s 669% Options Payout a Bull Trap? You Might Be Shocked By the Answer. Ahead of Sidus Space Earnings, Here's What Barchart Data Says Comes Next for SIDU Stock Palo Alto Networks Stock Soars on Strong FCF Guidance - Any More Upside Left in PANW? 2 Stocks to Buy on a Potential U.S. Ban on Some Chinese Tech