


Crypto traders lost $1.23 billion to forced liquidations over the past 24 hours, nearly double the previous day’s total. Bets on higher prices accounted for $1.02 billion of it as the crypto market cap fell 5.75% to $2.33 trillion.
Long positions made up 82.7% of the crypto liquidations, Coinglass data shows. Bitcoin (BTC) slipped below $68,000 to test its 200-week average. A weekly close below that line on Sunday could expose holders to a deeper retest.
Bitcoin Longs Lose Twice as Much as a Day Earlier
Bitcoin positions accounted for $637.24 million of the total, with longs at 90.8%. That is nearly double the $325.28 million in Bitcoin liquidations BeInCrypto reported a day earlier.
Ethereum (ETH) followed at $256.52 million, where 76.3% came from long bets.
In all, 163,631 traders were liquidated, up from 112,947 the day before. The largest single order was a $17.81 million Ethereum short on Binance, closed at $1,979.21.
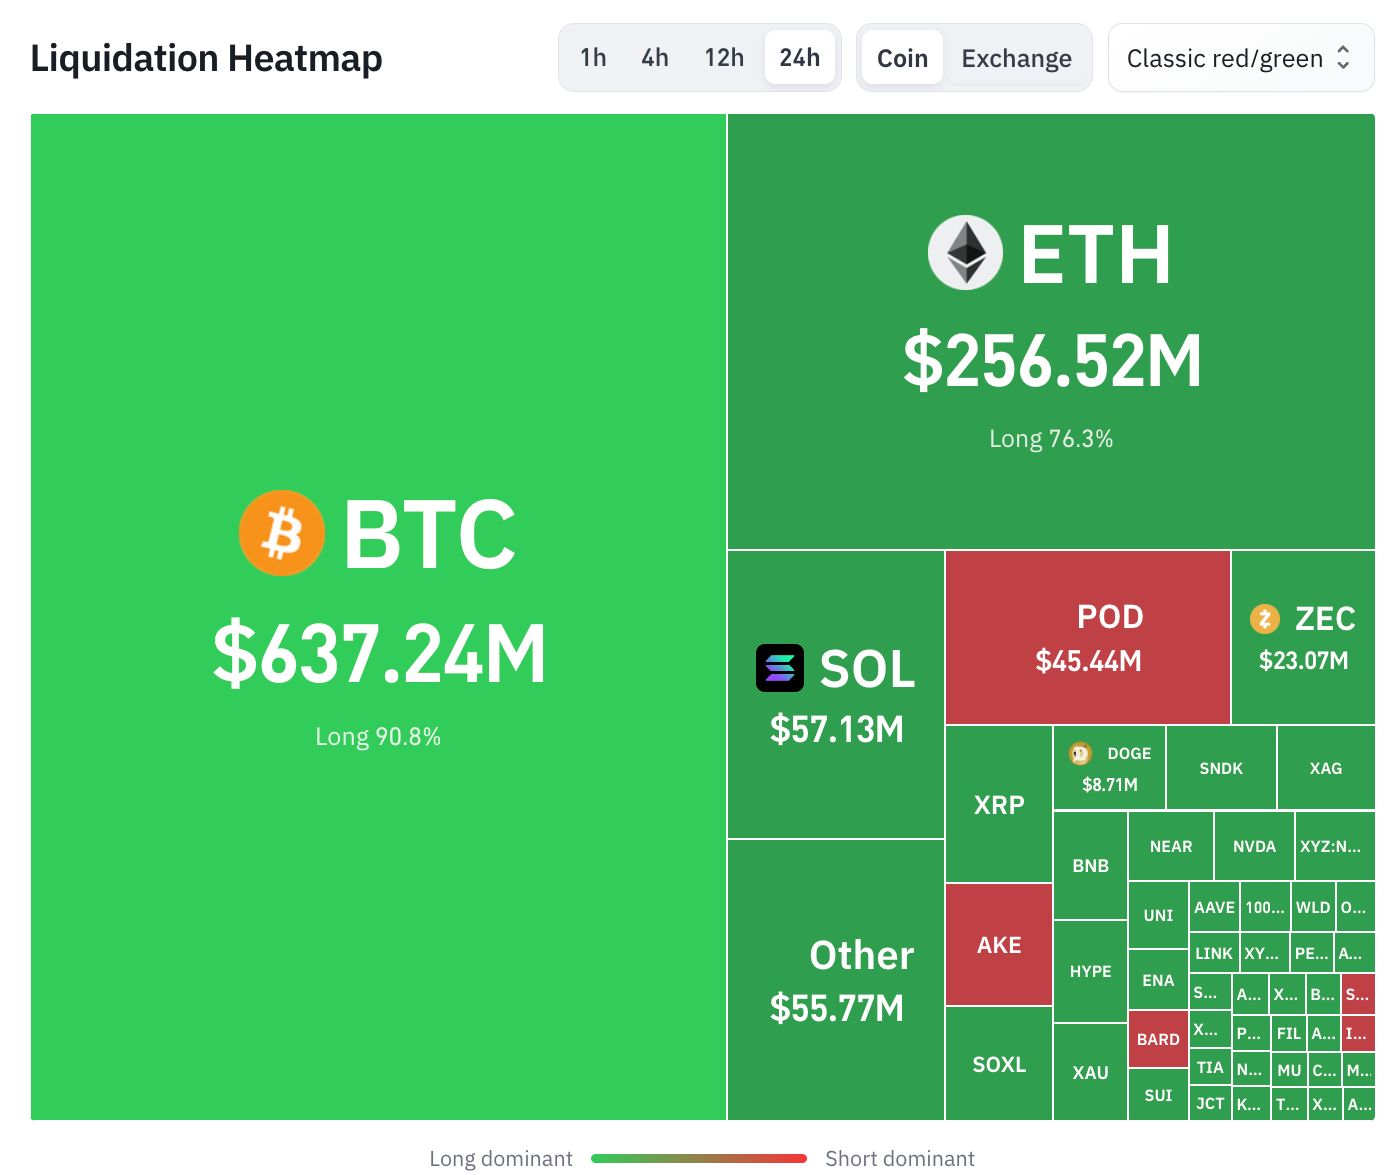 Crypto Liquidations on November 14. Source: Coinglass
About $1 billion of the total hit in the first 12 hours of the window. Liquidations have eased since, with $233.07 million over the past 12 hours and $41.01 million over the past four.
The liquidations hit as a broader sell-off spread across crypto markets.
Follow us on X to get the latest news as it happens
Can Bitcoin Hold Its 200-Week Average?
Bitcoin traded at $67,623, per BeInCrypto Markets data. It fell 3.70% over 24 hours. The cryptocurrency is now testing its 200-week simple moving average (SMA) near $67,922, trading just below it.
BeInCrypto’s analysis of the sell-off noted that the same average caught Bitcoin in July and launched its August rally.
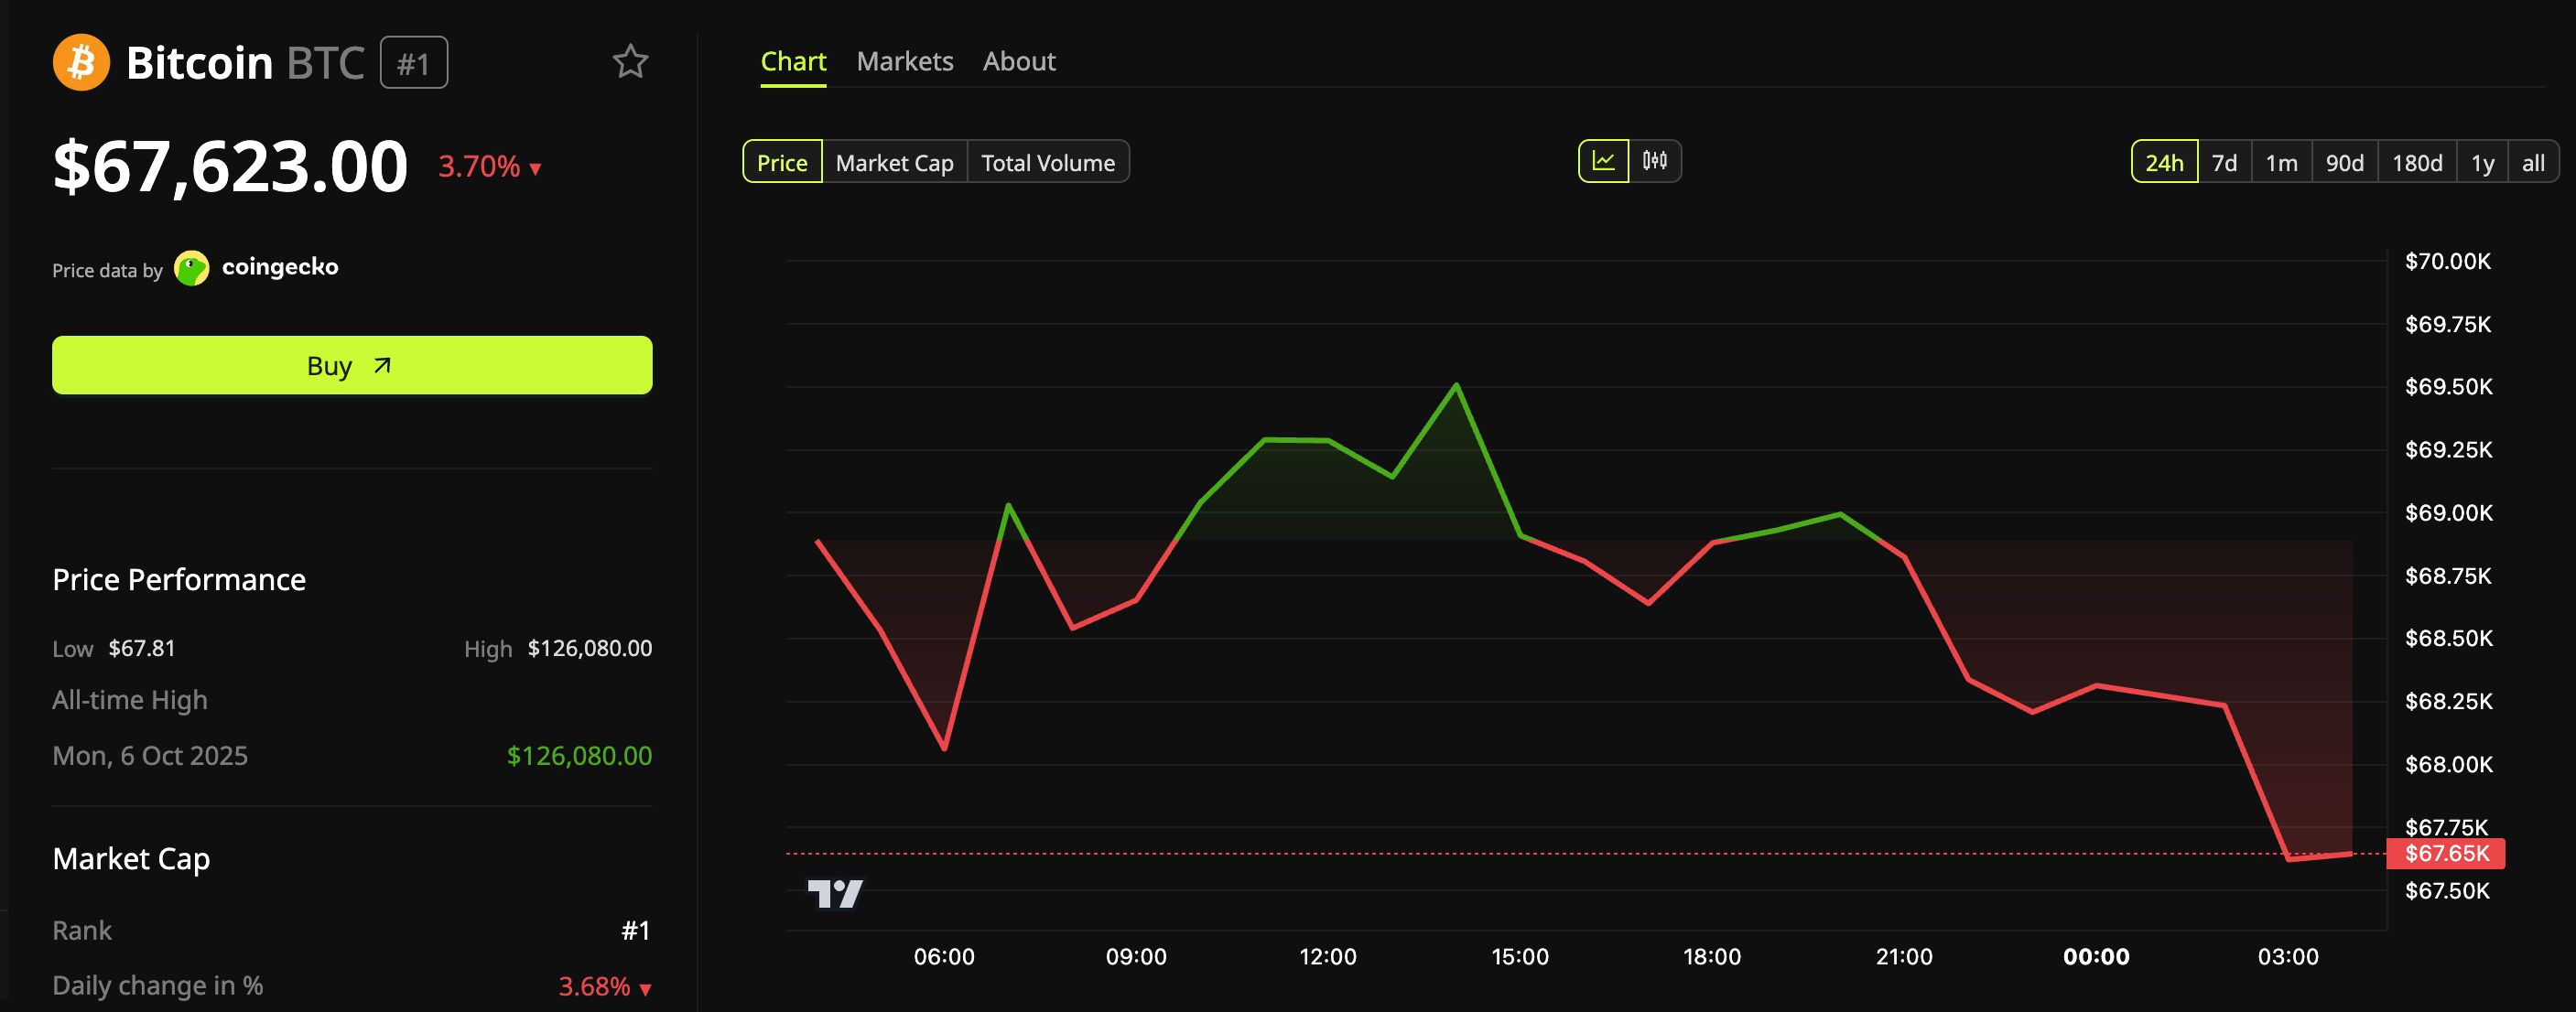 Bitcoin (BTC) Weekly Price Chart. Source: BeInCrypto Markets
The first floor under the average sits between $66,000 and $67,000. That range blocked Bitcoin’s recoveries from June through August.
Should that range fail, the next level is $62,300. Buyers defended that price twice this year, in late February and again before the late-August breakout. The last time Bitcoin slipped beneath it, in July, the drop bottomed near $58,000.
On the upside, $75,000 is the first hurdle if Bitcoin rebounds.
Has Ethereum Lost the Base of Its August Breakout?
Ethereum’s price fell 3.37% to $1,903.78, per BeInCrypto Markets data.
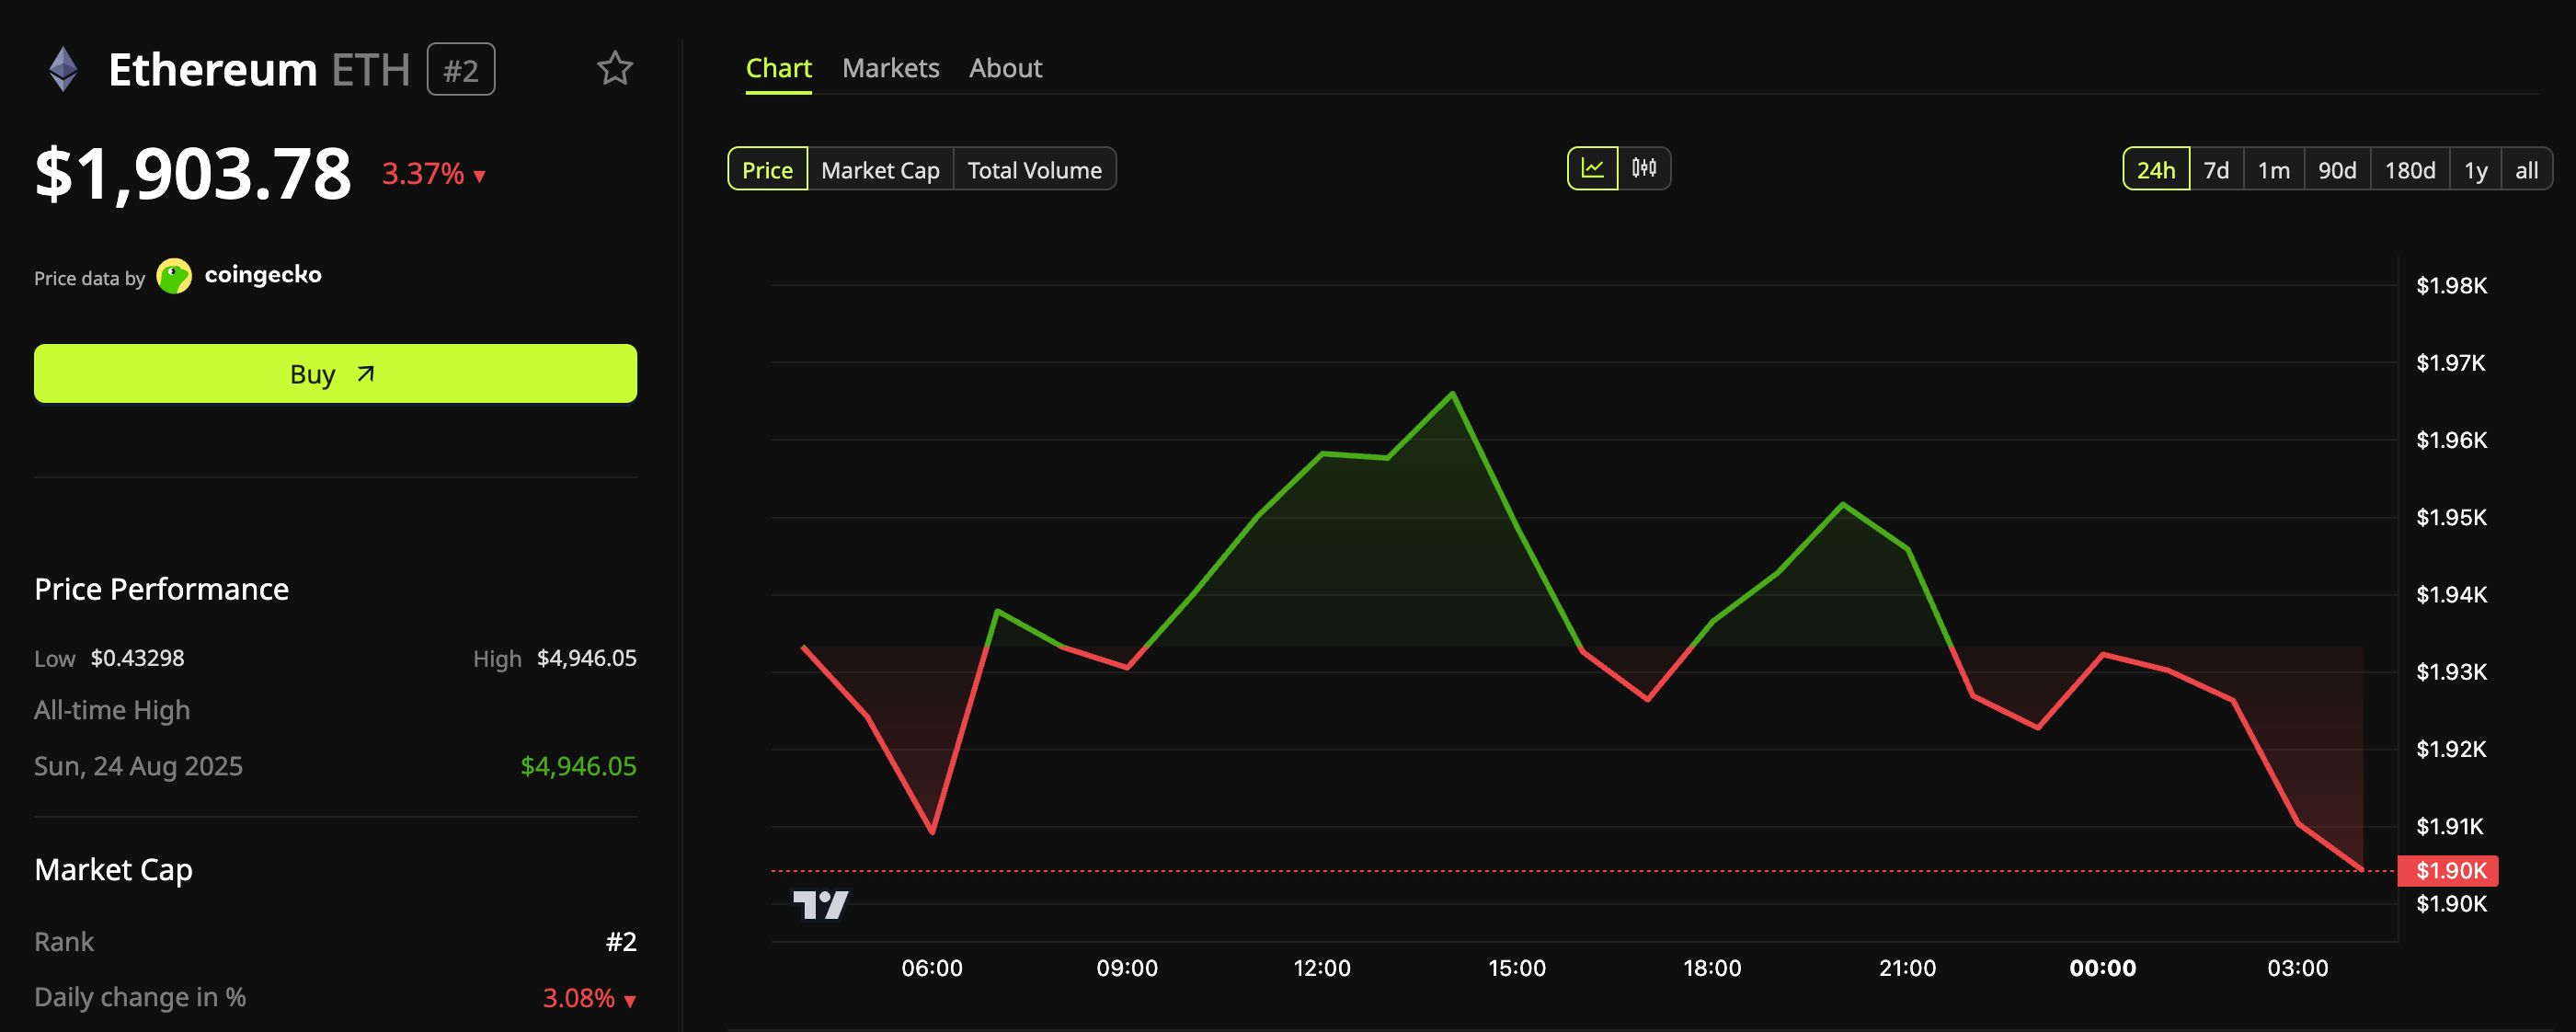 Ethereum (ETH) Price Performance. Source: BeInCrypto Markets
It now trades below $1,920.51, a Fibonacci support level flagged by analyst More Crypto Online. The analyst’s next support sits at $1,832.78.
Beyond Sunday’s weekly close, two dates could set the next direction for both majors. MSCI drops Strategy, the largest corporate Bitcoin holder, from its benchmark indexes on November 30.
The Federal Reserve then announces its rate decision on December 9. Long bets have absorbed most of the liquidations for two straight days, so bullish traders carry the most exposure into both events
Subscribe to our YouTube channel to watch leaders and journalists provide expert insights
https://youtu.be/AlrEgz1suLURead the Original story Crypto Market’s Nearly 6% Slide Costs Bulls $1 Billion in a Day by Kamina Bashir at beincrypto.com