

META
#8
Meta Platforms, Inc. - Class A Common Stock
642.6 2 USD
-0.01%
Рыночная цена
Сектор: Услуги связи
Базовая: USD
Валюта прибыли: USD
Дневной диапазон
Годовой диапазон
Дневное изменение
-0.96%
Месячное изменение
-16.42%
6-месячное изменение
-4.23%
Годовое изменение
-14.27%
Предыдущее закрытие
648.8 5
Открытие
638.1 2
Low
633.2 7
High
648.0 4
Финансовые показатели
2015
Current report, 11 Jun 2015
Meta Platforms, Inc. current report, 11 June 2015
8-K
Current report, 22 Apr 2015
Meta Platforms, Inc. current report, 22 April 2015
8-K
Quarterly report, Q1 FY2015
Meta Platforms, Inc. quarterly report, Q1 FY2015
10-Q
Current report, 28 Jan 2015
Meta Platforms, Inc. current report, 28 January 2015
8-K
2014
Annual report, FY2014
Meta Platforms, Inc. annual report, FY2014
10-K
Current report, 29 Oct 2014
Meta Platforms, Inc. current report, 29 October 2014
8-K
Current report, 28 Oct 2014
Meta Platforms, Inc. current report, 28 October 2014
8-K
Current report, 04 Oct 2014
Meta Platforms, Inc. current report, 04 October 2014
8-K
Quarterly report, Q3 FY2014
Meta Platforms, Inc. quarterly report, Q3 FY2014
10-Q
Current report, 23 Jul 2014
Meta Platforms, Inc. current report, 23 July 2014
8-K
Новости
Бывшая жена Трампа-младшего Ванесса заявила о победе над раком
В Таиланде задержали россиянина в розыске при попытке выехать в Лаос
Французский боец MMA погиб в результате стрельбы в пригороде Парижа
Как маркетплейсы во Франции борются с продажей краденого после протестов
Акции недели: кибербезопасность, Meta, Tesla и нефть
Племянник Тайсона Фьюри вышел в финал юниорского ЧЕ по боксу
Распродажа акций ИИ-чипов «оторвана от фундаментала» — LYNX
Новые акции Meta без права голоса защитят контроль Цукерберга
BofA повысил целевую цену акций Meta на фоне роста ИИ
Argus подтвердил рейтинг акций Meta после урегулирования иска
Фьючерсы TSX снижаются на фоне падения золота и тревог по ИИ
Графики и идеи
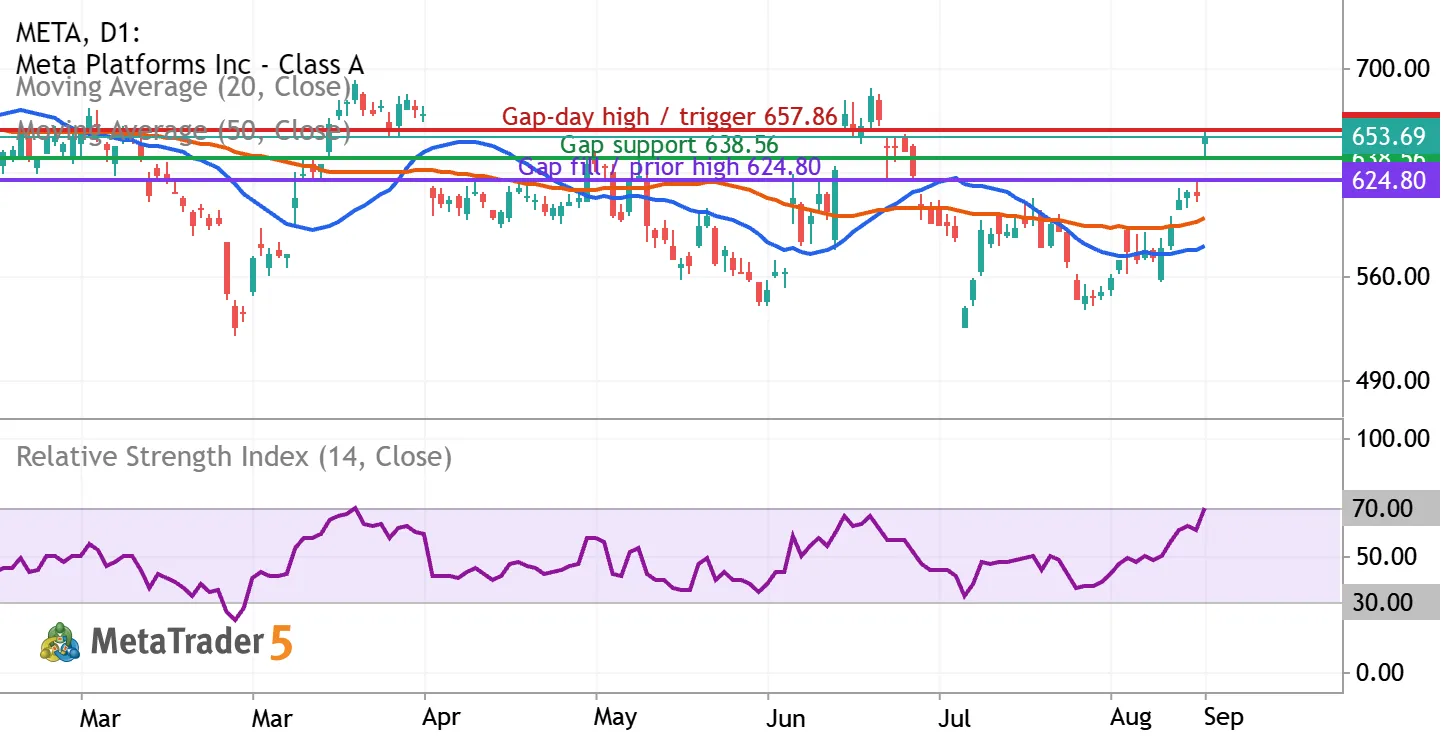
META: gap-up rally puts $638.56 support in focus
Meta Platforms (NASDAQ: META) | Daily chart | September 10, 2026 View: conditionally bullish, with patience after a sharp gap higher. Horizon: 2–4 weeks. META closed September 9 at $653.69, up 6.55%. The session low of $638.56 stayed above September 8’s $624.80 high, leaving an unfilled daily gap. Holding that gap would support continuation; a failure would weaken the breakout. Reading the indicators The blue line is the 20-day simple moving average, the orange line the 50-day simple moving average, and the lower panel is RSI(14), all using closing prices. At the September 9 candle, MetaTrader showed approximately $580.54, $598.58, and 70.43 respectively. Price is above both averages, but the 20-day average remains below the 50-day: this is a strong recovery without a fully bullish


Сейчас для META нет других торговых идей
Посмотрите готовые торговые идеи или выберите символ и создайте свою
Перейти к графикам и торговым идеям