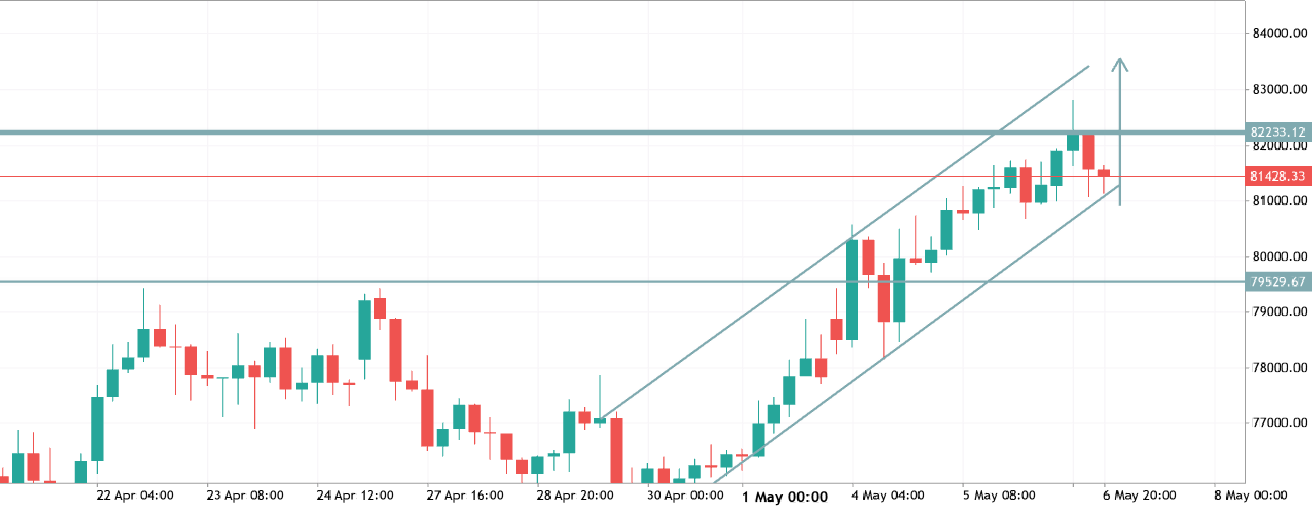
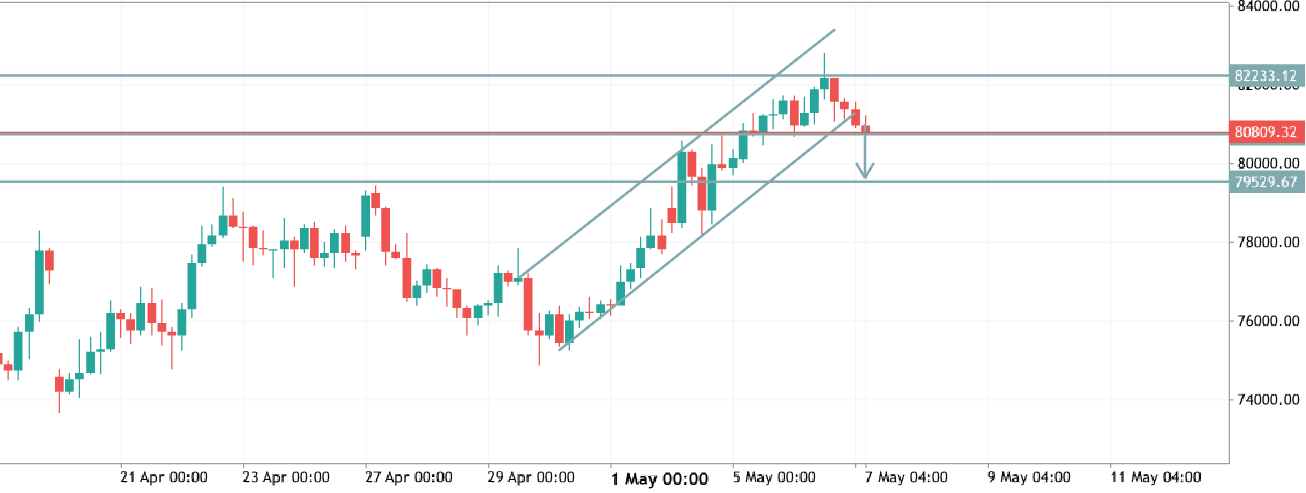
HamadJatoi

Hamad Jatoi

Пакистан

Графики и идеи

BTCUSD BTCUSD Long Bitcoin vs US Dollar
BTCUSD
Short Chart Analysis (BTC/USDT 4H): Trend: Bullish — price is moving inside a clear ascending channel (higher highs & higher lows). Current Behavior: Rejection from resistance around 82,200 , showing short-term selling pressure. Key Support: ~ 79,500 (channel support). Key Resistance: 82,200 → 83,500 zone. Scenarios: Bullish: If price holds above 81,000 and breaks 82,200 , next targets → 83,500 – 84,000 . Bearish: If price drops below 79,500 , it may fall toward 78,000 – 77,000 . Conclusion: Trend is still bullish, but current pullback suggests possible retest of support before next move.
2026.05.06 19:58 0
xauusd analysis XAUUSD Long Gold vs US Dollar
xauusd analysis
Market Structure Price was moving inside a descending channel (downtrend). Recently, it has broken above the channel , signaling a potential trend reversal or at least a strong pullback. Momentum (MACD) MACD shows a bullish crossover with histogram turning positive. Momentum is shifting upward , supporting the breakout. Key Levels Resistance: 4675–4680 → currently being tested Next target: around 4875–4880 Support (flip zone): 4655–4670 Strong support: 4540 Price Behavior Strong bullish candles pushed price above resistance. Price is now holding above breakout zone , which is a bullish sign. A retest of 4655–4670 would be healthy for continuation. Bias Short-term: Bullish Trading Idea Buy on dips near 4655–4675 Target: 4720 → 4875 Stop loss: below 4540 Invalidation If price falls below
2026.05.06 13:59 1
gold analysis for next week XAUUSD Long Gold vs US Dollar
gold analysis for next week
Market structure: Clear downtrend (series of lower highs + descending trendline still respected). Current pattern: Price is compressing into a symmetrical triangle right at ~4610 support/resistance flip zone. Key levels: Support: ~4590–4600 Resistance: ~4635–4650 (triangle top + trendline) Major target zone above: ~4725 Scenarios: Bullish: Break + hold above triangle & trendline → momentum push toward ~4700–4730 Bearish: Rejection here → continuation of overall downtrend → retest 4550 → possibly lower Bias: Neutral → waiting for breakout confirmation (trend is bearish, but structure is coiling). Smart takeaway: No edge inside the triangle — trade the breakout, not the guess.
2026.05.03 08:36 0