HamadJatoi

Hamad Jatoi

Пакистан

Графики и идеи

XAUUSD TRADE IDEA XAUUSD Long Gold vs US Dollar
XAUUSD TRADE IDEA
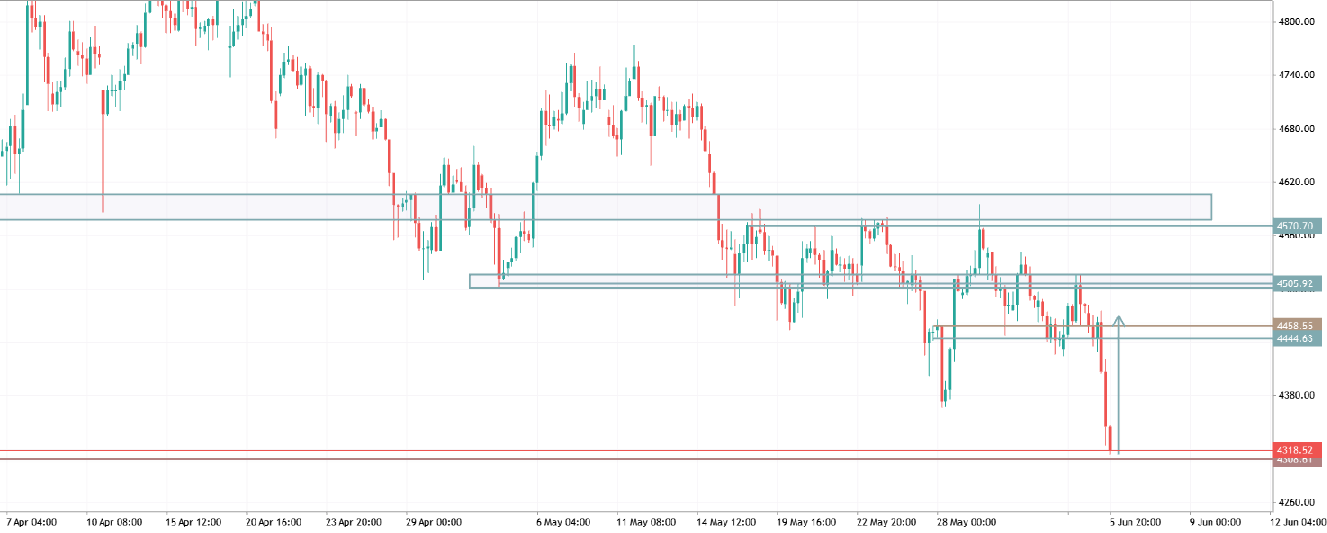
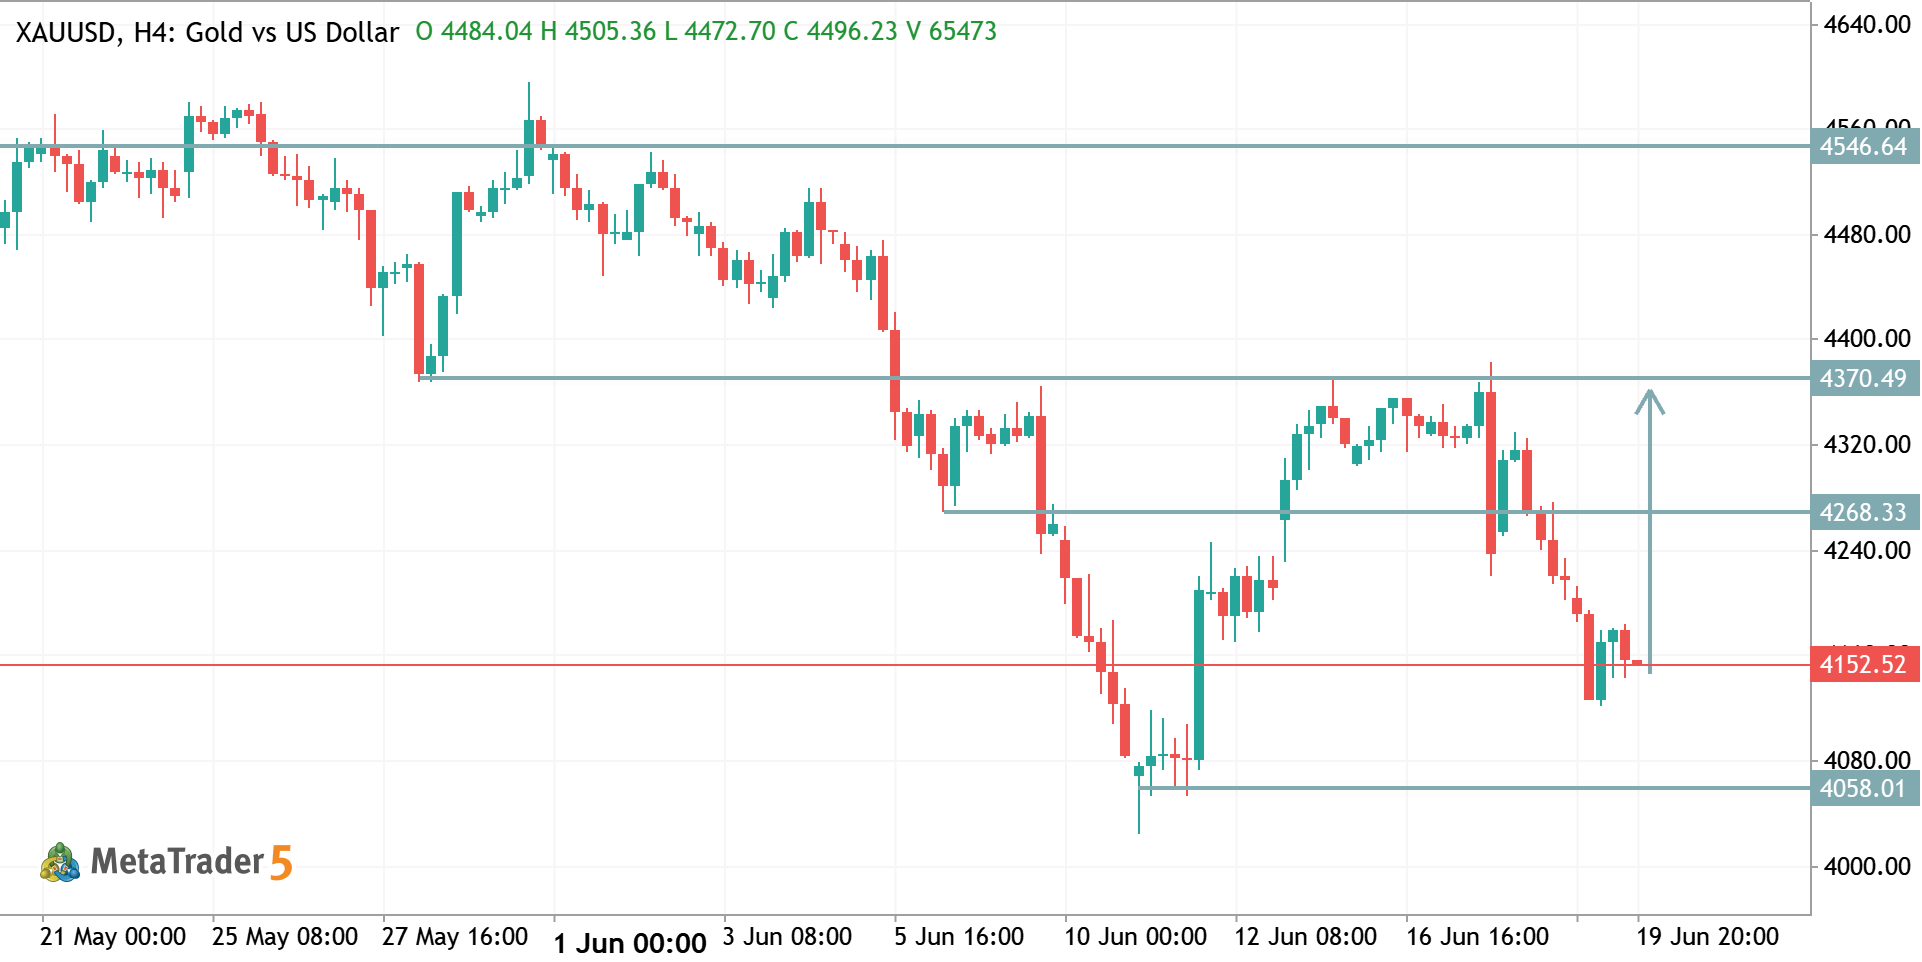
Market Structure: 🔻 Bearish The H4 chart shows a clear sequence of lower highs and lower lows , indicating that sellers remain in control. Key Levels Resistance 1: 4268 Resistance 2: 4370 Major Resistance: 4546 Current Support: 4152 Major Support: 4058 Price Action Price recently rejected the 4268 resistance zone and dropped sharply. The market is currently testing the 4152 support area . A break below 4152 could open the way toward 4058 support . Buyers need a strong recovery above 4268 to regain short-term bullish momentum. Trading Scenarios Bearish Setup (Preferred) Sell below 4152 Targets: 4100 → 4058 Stop Loss: Above 4268 Bullish Setup Buy only after a confirmed H4 close above 4268 Targets: 4370 → 4546 Stop Loss: Below 4152 Conclusion The overall H4 trend remains bearish . As long
2026.06.21 06:32 0
GBPUSD TRADE IDEA GBPUSD Long Pound Sterling vs US Dollar
GBPUSD TRADE IDEA
GBPUSD H4 – Bias: 🟢 Bullish Price is moving inside an ascending channel after a strong rebound from the 1.3320 support zone . Buyers are testing the key resistance at 1.3416 . A breakout and close above 1.3416 could push GBPUSD toward 1.3470 and 1.3530 . Buy Setup Entry: Above 1.3416 Target 1: 1.3470 Target 2: 1.3530 Stop Loss: Below 1.3360 Bearish Risk Rejection from 1.3416 may lead to a pullback toward 1.3360 and 1.3320 . Conclusion: Short-term momentum remains bullish while price stays above 1.3360 . A confirmed breakout above 1.3416 favors further upside. 📈
2026.06.10 13:49 0
XAUUSD TRADE IDEA XAUUSD Long Gold vs US Dollar
XAUUSD TRADE IDEA
Trade Analysis (H1 Chart) Market: Appears bearish overall. Current Structure Price is trading inside a descending channel . Strong bearish momentum pushed price from the 4350–4360 area down toward 4150 support . The latest candle has broken slightly below the lower channel boundary, suggesting possible exhaustion of the sell-off. Key Levels Support: 4150, then 4120. Resistance: 4220, then 4335. Bullish Scenario If 4150 support holds and buyers defend this zone, a corrective rally toward 4220 is possible. A break above 4220 could extend recovery toward the channel midline around 4250–4280 . Bearish Scenario If price closes decisively below 4150 , sellers remain in control. Next downside targets would be 4120 and potentially 4100 . Trading Bias Short-term: Oversold near support; watch for a
2026.06.10 13:36 0
BTCUSD TRADE IDEA BTCUSD Bitcoin vs US Dollar
BTCUSD TRADE IDEA
Market Structure: Bearish The chart shows a strong downtrend with consecutive lower highs and lower lows. Heavy selling pressure pushed price from the 81,000 area down toward 61,000–63,000. Recent price action is moving sideways after the sharp drop, indicating consolidation rather than a confirmed reversal. Key Levels Resistance 1: 64,491 Resistance 2: 67,256 Support 1: 61,633 Current Pivot: 62,845 Bullish Scenario A H4 candle close above 64,491 could trigger a recovery move. Target zones: 67,256 Higher resistance if momentum continues. Bearish Scenario Failure to break 64,491 and a close below 61,633 would favor trend continuation. Sellers could target fresh lows below the recent swing low. Trading Idea Buy Setup: Above 64,491 after a confirmed breakout. TP1: 67,256 SL: Below 61,633
2026.06.09 08:42 0
XAUUSD TRADE IDEA XAUUSD Long Gold vs US Dollar
XAUUSD TRADE IDEA
Market Structure: Bearish 📉 The chart shows a clear sequence of lower highs and lower lows , confirming a sustained downtrend. Price repeatedly failed to hold above the 4505–4570 resistance zone . A strong bearish impulse candle has broken below the recent consolidation range and reached the 4318 support area . Key Levels Resistance 1: 4445–4458 Resistance 2: 4505–4510 Major Resistance: 4570–4600 Current Support: 4318 Next Support: Around 4300 Lower Target: 4260 area if selling pressure continues Trading Bias ✅ Preferred Setup: Sell on Pullback Wait for price to retrace toward 4445–4458 . Bearish rejection in that zone could provide a higher-probability short entry. Targets: TP1: 4318 TP2: 4300 TP3: 4260 ⚠️ Buy Scenario Buying is counter-trend at the moment. Consider longs only if price
2026.06.07 14:02 0
GBPUSD TRADE IDEA GBPUSD Long Pound Sterling vs US Dollar
GBPUSD TRADE IDEA
Entry: 1.3415 – 1.3430 Stop Loss: 1.3390 (below support) Take Profit 1: 1.3470 Take Profit 2: 1.3525 Reasoning Price is holding above the key support zone around 1.3400–1.3415 . Multiple rejections from lower levels suggest buyers are defending the area. Resistance remains near 1.3470 , offering a reasonable short-term upside target. Trade Bias ✅ Short-term Buy while price remains above 1.3400 . If an H4 candle closes below 1.3400 , invalidate the buy setup and look for selling opportunities toward 1.3365 .
2026.06.04 07:56 1
XAUUSD TRADE IDEA XAUUSD Long Gold vs US Dollar
XAUUSD TRADE IDEA
BUY TRADE SETUP (H4) Entry: 4445–4450 Stop Loss: 4425 Take Profit 1: 4465 Take Profit 2: 4505 Take Profit 3: 4570 Reasoning: Strong support zone around 4444–4450 has been defended multiple times. Recent candles show buyers stepping in from support. Risk-to-reward favors longs while price remains above 4444 . Confirmation Entry: Conservative traders can wait for an H4 close above 4465 before entering. Invalidation: H4 close below 4444 would invalidate the bullish setup and increase the probability of a move toward 4410–4380 . Bias: Bullish above 4444 , targeting 4505 and potentially 4570 .
2026.06.04 07:36 0
GBPUSD TRADE IDEA GBPUSD Long Pound Sterling vs US Dollar
GBPUSD TRADE IDEA
Market Structure Price is trading around 1.3460 and has formed a series of higher lows , indicating short-term bullish momentum. An ascending trendline is supporting the recent move higher. Price is consolidating just below a key resistance zone. Key Levels Support: 1.3400–1.3410 Immediate Support: 1.3440–1.3460 Resistance 1: 1.3490–1.3500 Resistance 2: 1.3520–1.3530 Major Resistance: 1.3550+ Bullish Scenario A sustained break and H4 close above 1.3490–1.3500 could trigger a move toward: 1.3525 1.3550 The rising trendline suggests buyers remain in control while price holds above 1.3400 . Bearish Scenario Rejection from the resistance zone could push price back toward: 1.3440 1.3410 A break below 1.3400 would weaken the bullish structure and expose lower levels. Trading Bias Short-term
2026.06.02 04:50 0
BTCUUSD TRADE IDEA BTCUSD Long Bitcoin vs US Dollar
BTCUUSD TRADE IDEA
Market Structure: Bearish 📉 Price has broken below multiple support levels and is currently testing a major demand zone around 71,400–70,500 . Momentum remains strongly bearish with a series of lower highs and lower lows. Key Levels: Resistance 1: 73,400 Resistance 2: 75,400 Resistance 3: 77,300 Support 1: 71,400 (current zone) Support 2: 70,400 Support 3: 69,000 Trading Scenario: If BTC holds above 71,400 and forms bullish confirmation, a corrective move toward 73,400 → 75,400 is possible. If 71,400 breaks decisively, selling pressure could extend toward 70,400 and potentially 69,000 . Trade Setup: Buy: Only after a confirmed bullish rejection from 71,400. Sell: On a H4 close below 71,400 with targets at 70,400 and 69,000. Stop Loss: Above/below the breakout candle depending on entry
2026.06.01 13:54 0