Скринер

#Последние 7 дней
1
NVDA
NVIDIA Corporation - Common Stock
229.28 USD-0.52%-2.88%+8.62%+21.98%5.53 T USD
2
AAPL
Apple Inc. - Common Stock
336.64 USD-1.11%+1.15%+0.54%+34.99%4.91 T USD
3
GOOGL
Alphabet Inc. - Class A Common Stock
351.66 USD+0.97%+2.61%+2.47%+46.40%4.30 T USD
4
MSFT
Microsoft Corporation - Common Stock
535.07 USD+2.38%+2.54%+7.55%+3.61%3.97 T USD
5
AMZN
Amazon.com, Inc. - Common Stock
262.43 USD+3.29%+4.90%+3.57%+20.55%2.83 T USD
6
TSM
Taiwan Semiconductor Manufacturing Company Ltd
453.28 USD-1.03%-5.20%+8.86%+51.98%2.35 T USD
7
SPCX
SpaceX Space Exploration Technologies Corp
162.57 USD+1.25%+2.25%+10.41%+8.38%2.14 T USD
8
META
Meta Platforms, Inc. - Class A Common Stock
718.67 USD-0.31%-1.19%+9.28%+0.79%1.83 T USD
9
AVGO
Broadcom Inc. - Common Stock
361.54 USD+0.39%+1.05%+3.46%+2.45%1.73 T USD
10
TSLA
Tesla, Inc. - Common Stock
382.70 USD+2.05%+3.77%+6.32%-9.68%1.51 T USD

Тепловая карта

Графики и идеи

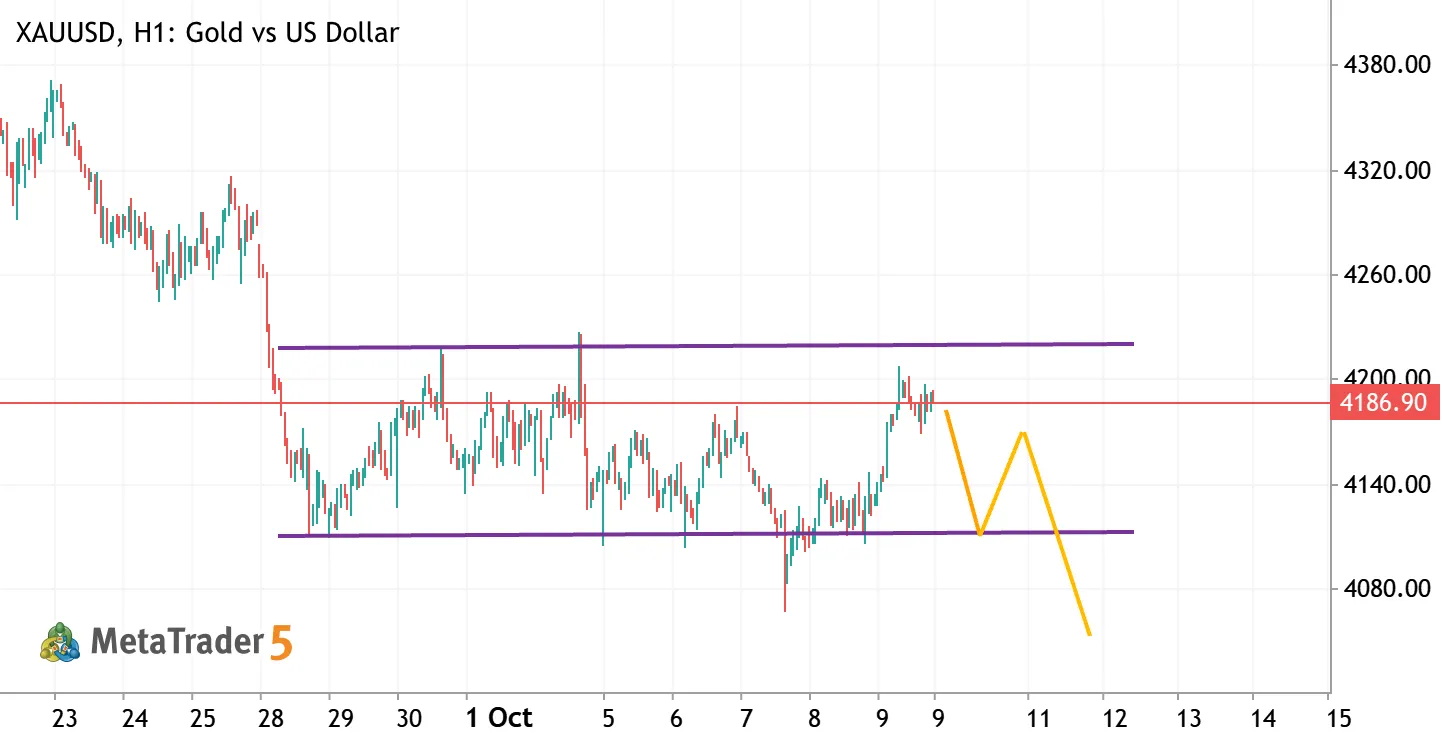
XAUUSD H1 | Range Resistance & Bearish Scenario XAUUSD Short Gold vs US Dollar

XAUUSD H1 | Range Resistance & Bearish Scenario

XAUUSD H1 | Bearish Scenario — Key Levels to Watch Market Structure Gold is currently consolidating within a defined H1 trading range, with resistance around 4215–4225 and support near 4110–4120. The recent recovery has brought price back toward the upper half of this range, where selling pressure may reappear. Key Levels Resistance: 4215–4225 Immediate reference: 4185–4190 Major Support: 4110–4120 Extended Bearish Target: 4050–4070 Bearish Scenario If XAUUSD fails to break the upper resistance area and confirms a bearish rejection, price may decline toward the 4110–4120 support zone. A potential rebound from support could follow. However, a confirmed H1 breakdown below this zone, followed by a failed retest, may open the way toward 4050–4070. Alternative Scenario A sustained H1 close

Gold Price Prediction: 4100-4105 Support Holds the Key XAUUSD Gold vs US Dollar

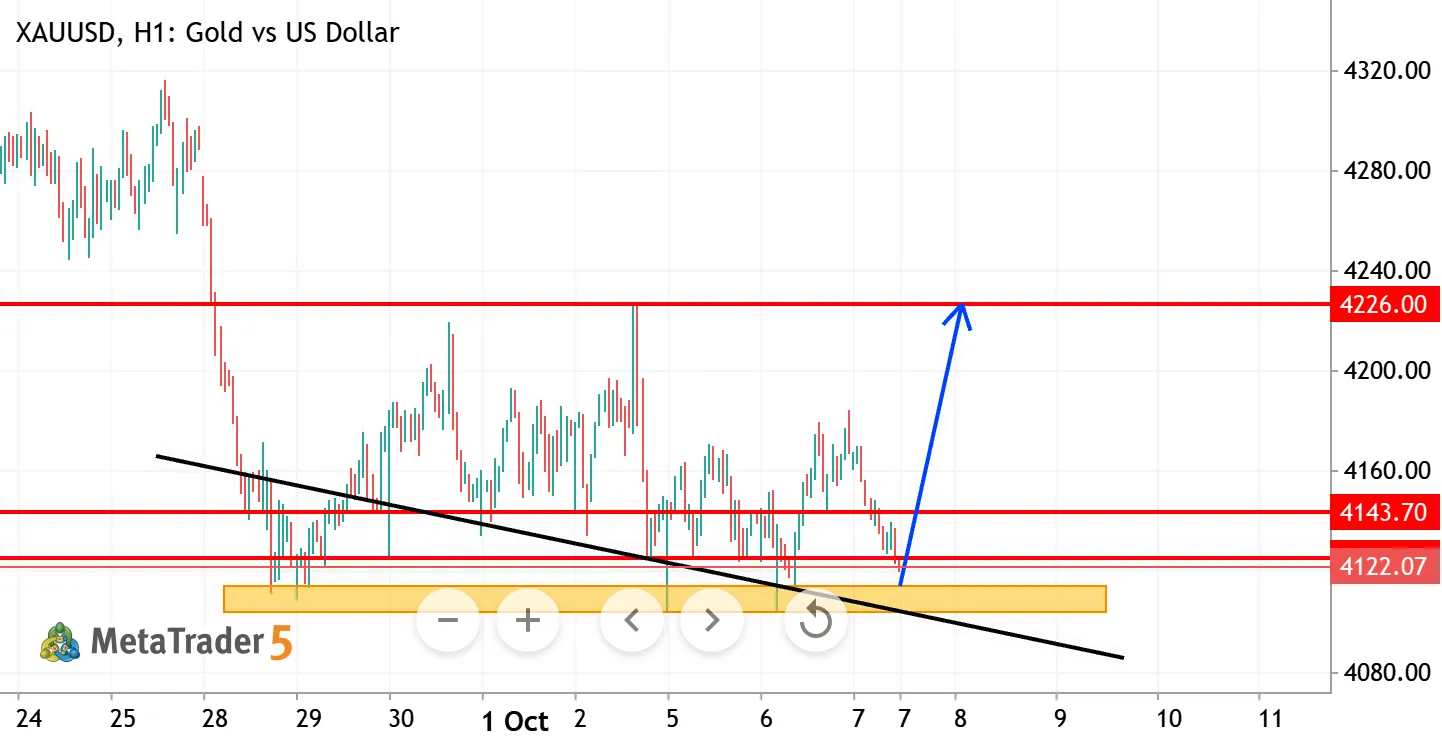
Gold Price Prediction: 4100-4105 Support Holds the Key

Gold is trading around 4120 zone after finding support near the 4105-4125 area. The 1H chart shows a possible bullish recovery from this support zone with 4143 as the first key resistance. A break and hold above 4143 could push price toward 4160-4180 and eventually 4226 where the major descending trendline resistance sits. However, failure to hold 4105-4125 would keep the bearish structure active and could expose lower levels. Trade Plan-Sell Setup Sell Zone: 4160-4180 Sell Trigger: H1-H4 bearish rejection, bearish engulfing or failure to hold above 4160–4180 Targets: 4143, 4125, 4105, 4080 Extended Target: 4050-4020 Invalidation: H4 close above 4226. A sustained breakout above this area would weaken the bearish structure and could open the way toward 4250-4280. Trade Plan-Buy Setup Buy
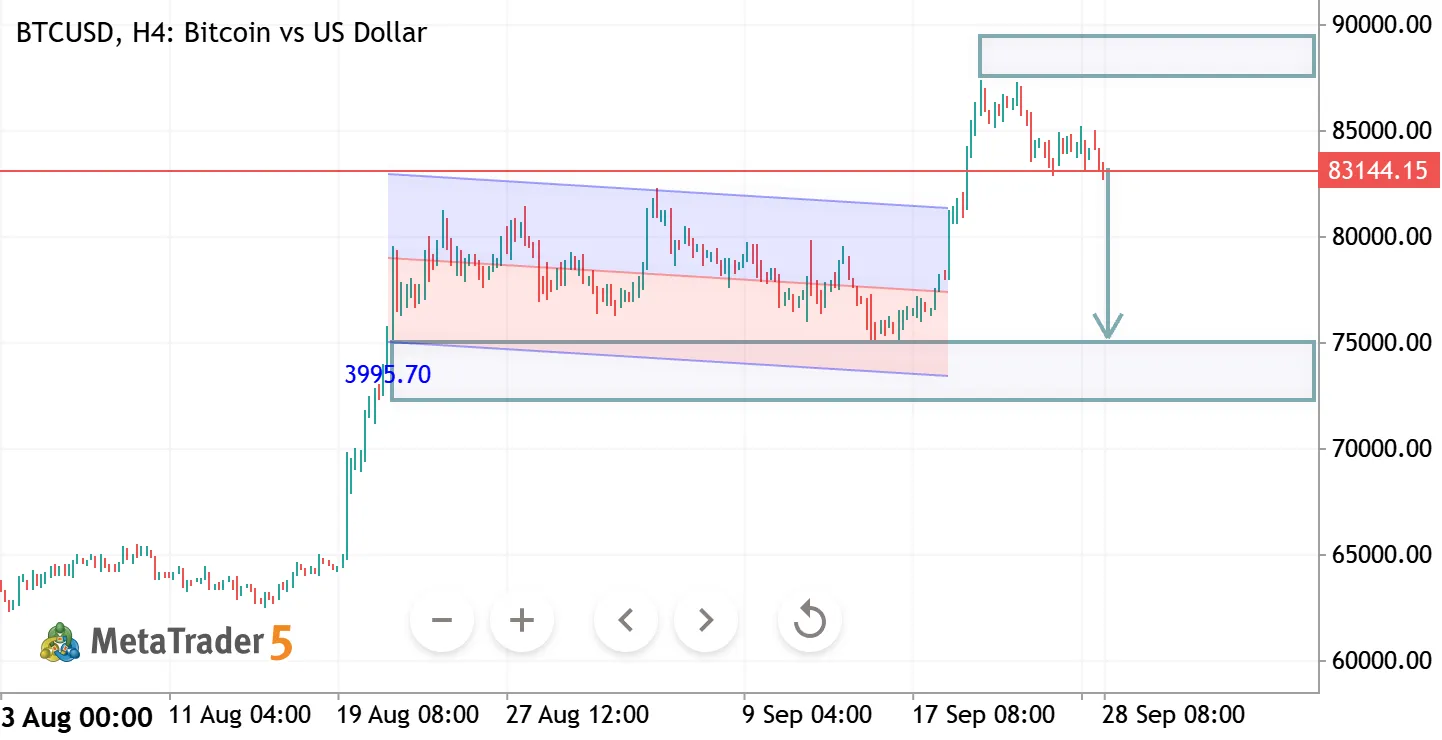
BTCUSD H4 ANALYSIS BTCUSD Bitcoin vs US Dollar

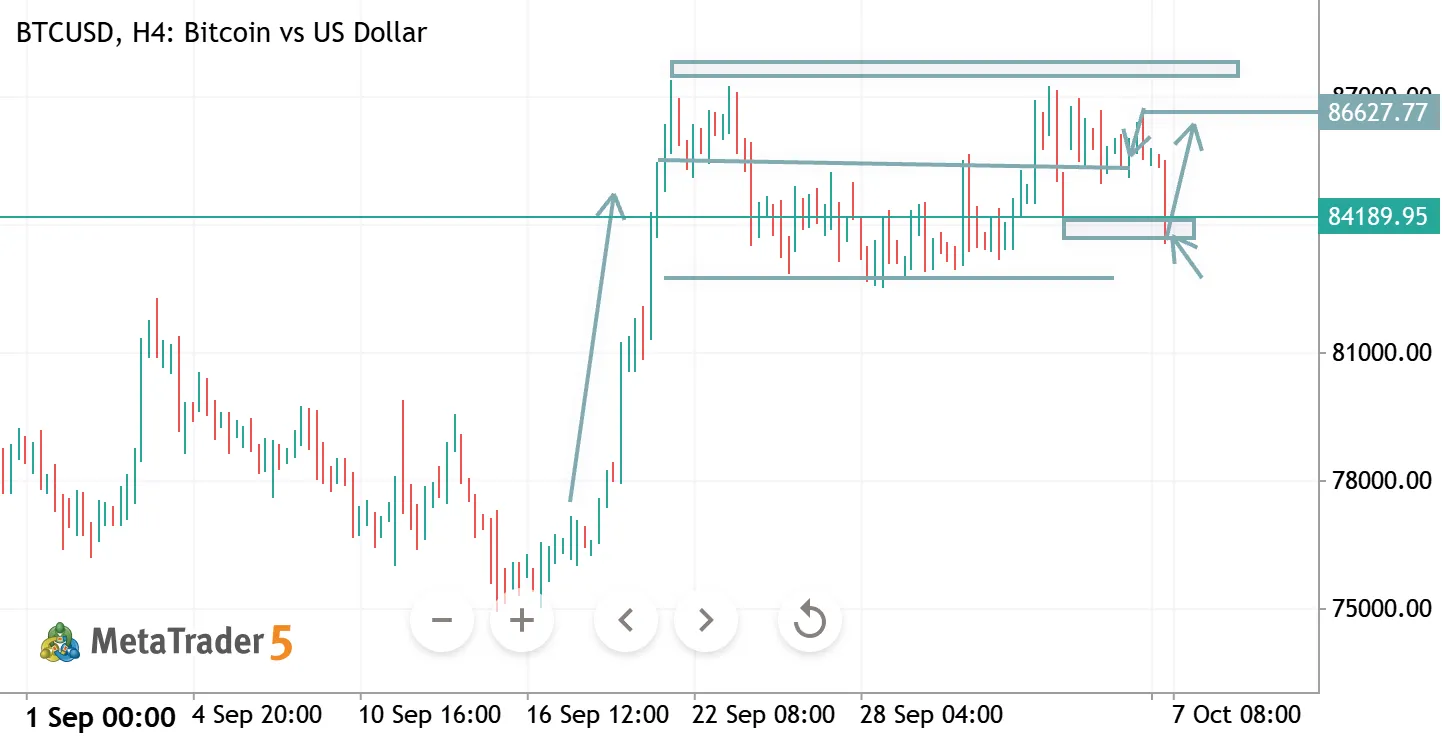
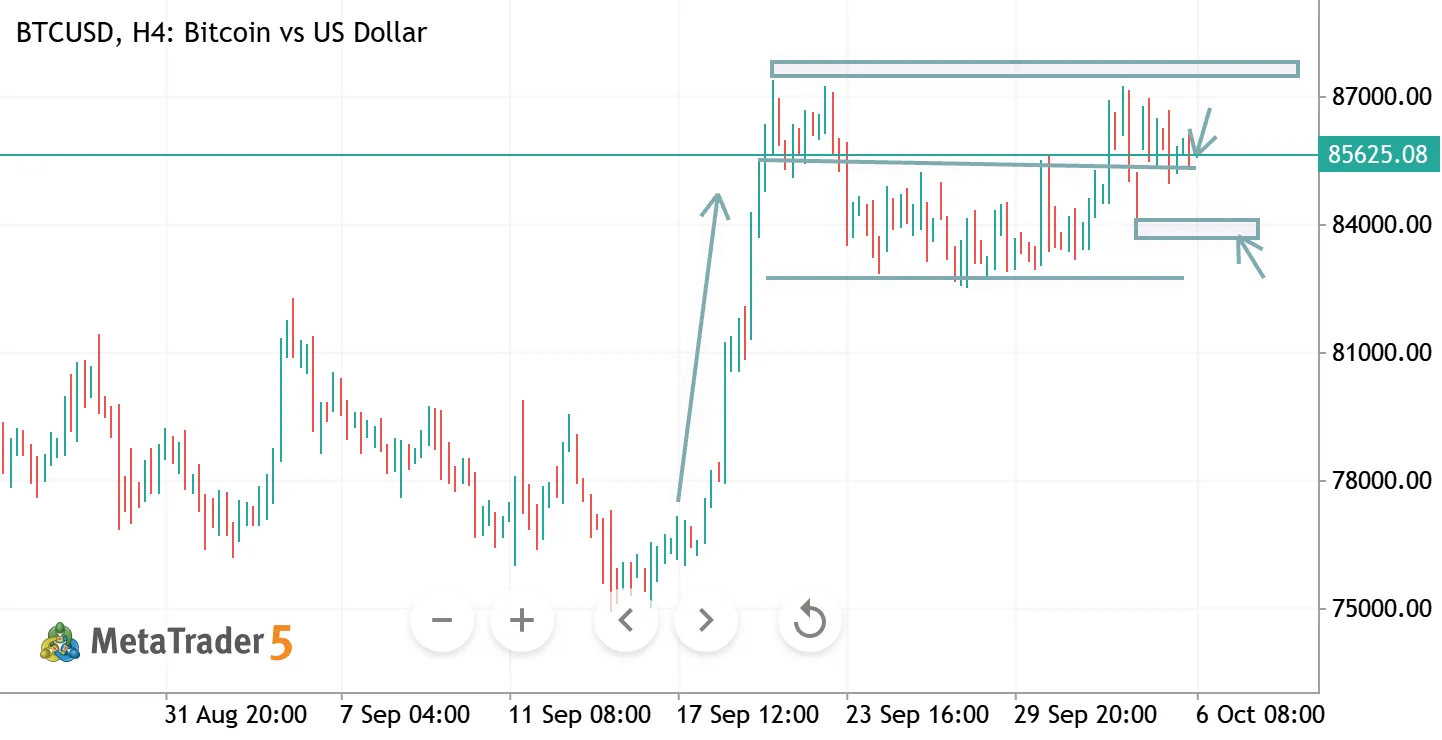
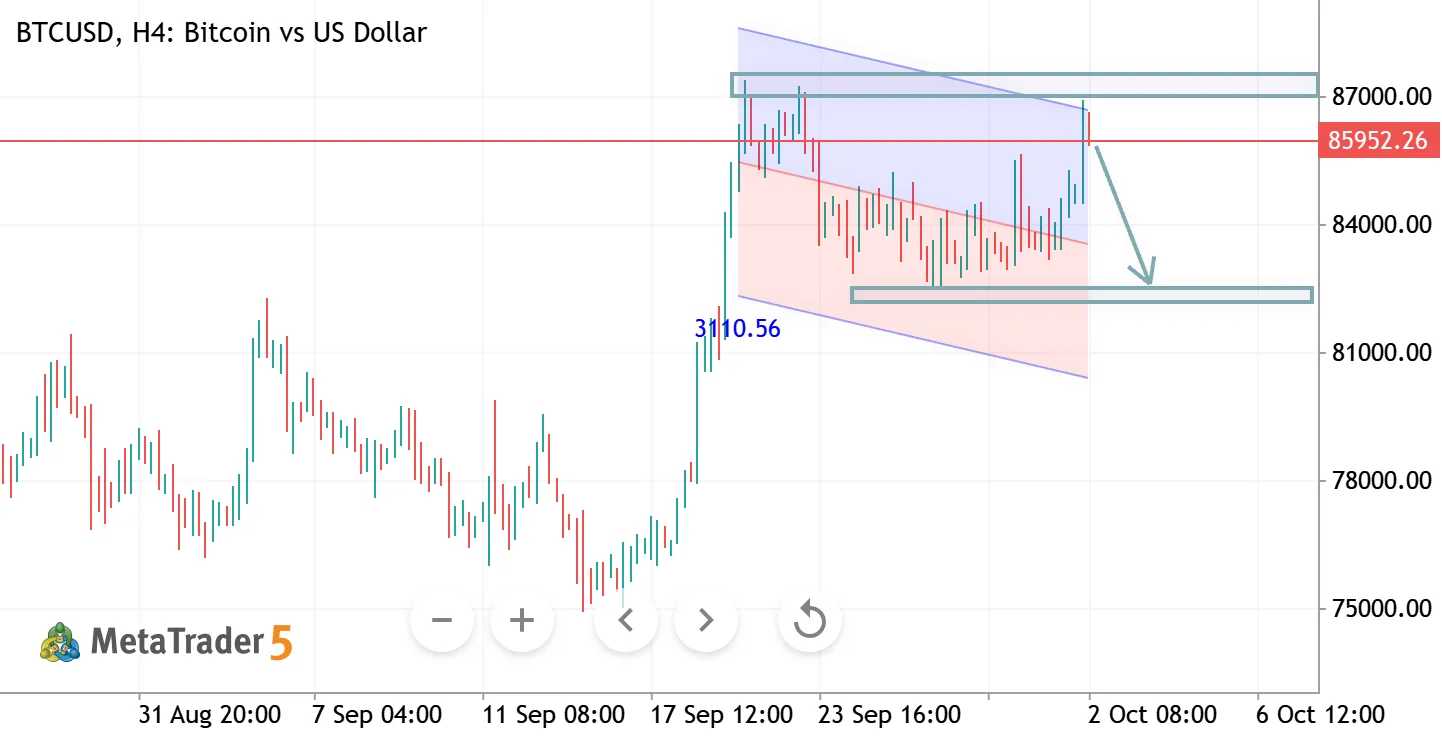
BTCUSD H4 ANALYSIS

GBPUSD – Technical Analysis 📊 GBPUSD is showing signs of a potential bullish reversal after moving within a descending channel. Price is holding around 1.3230, with the chart indicating a possible move toward the 1.3380–1.3400 resistance zone. 🔹 Support: 1.3200–1.3230 🔹 Target Zone: 1.3380–1.3400 🔹 Key Level: Sustained strength above 1.3260 would support the bullish setup. Disclaimer: Technical analysis is based on chart structure and is not financial advice.
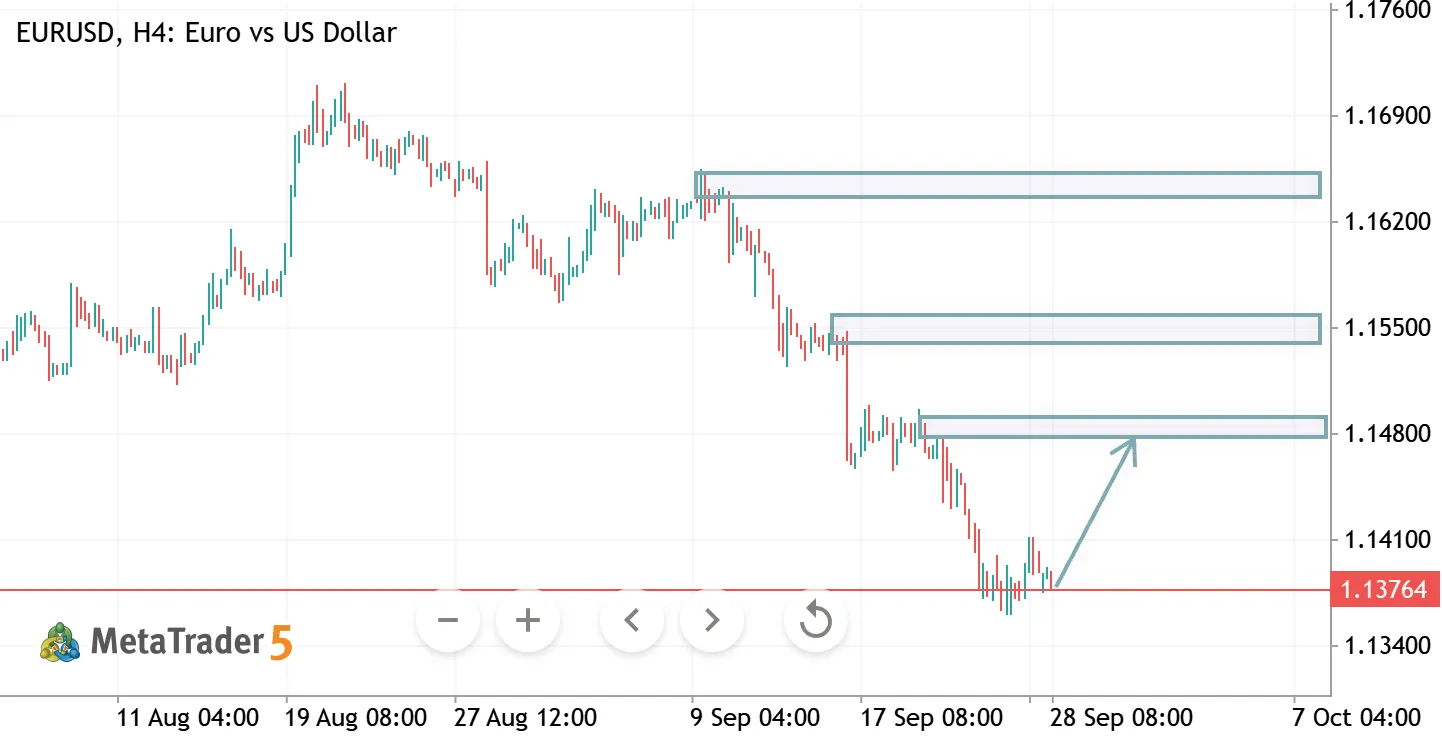
EURUSD H4 ANALYSIS EURUSD Euro vs US Dollar

EURUSD H4 ANALYSIS

EURUSD – Technical Analysis 📊 EURUSD remains under bearish pressure after a strong decline. Price is currently consolidating near 1.1370 support, with a possible corrective move toward the 1.1480–1.1500 resistance zone. 🔹 Key Support: 1.1370 🔹 Resistance: 1.1480–1.1500 🔹 Major Resistance: 1.1530–1.1550 A sustained break above 1.1500 could open the way toward higher resistance, while rejection may resume the bearish trend. Disclaimer: Technical analysis is based on chart structure and is not financial advice.
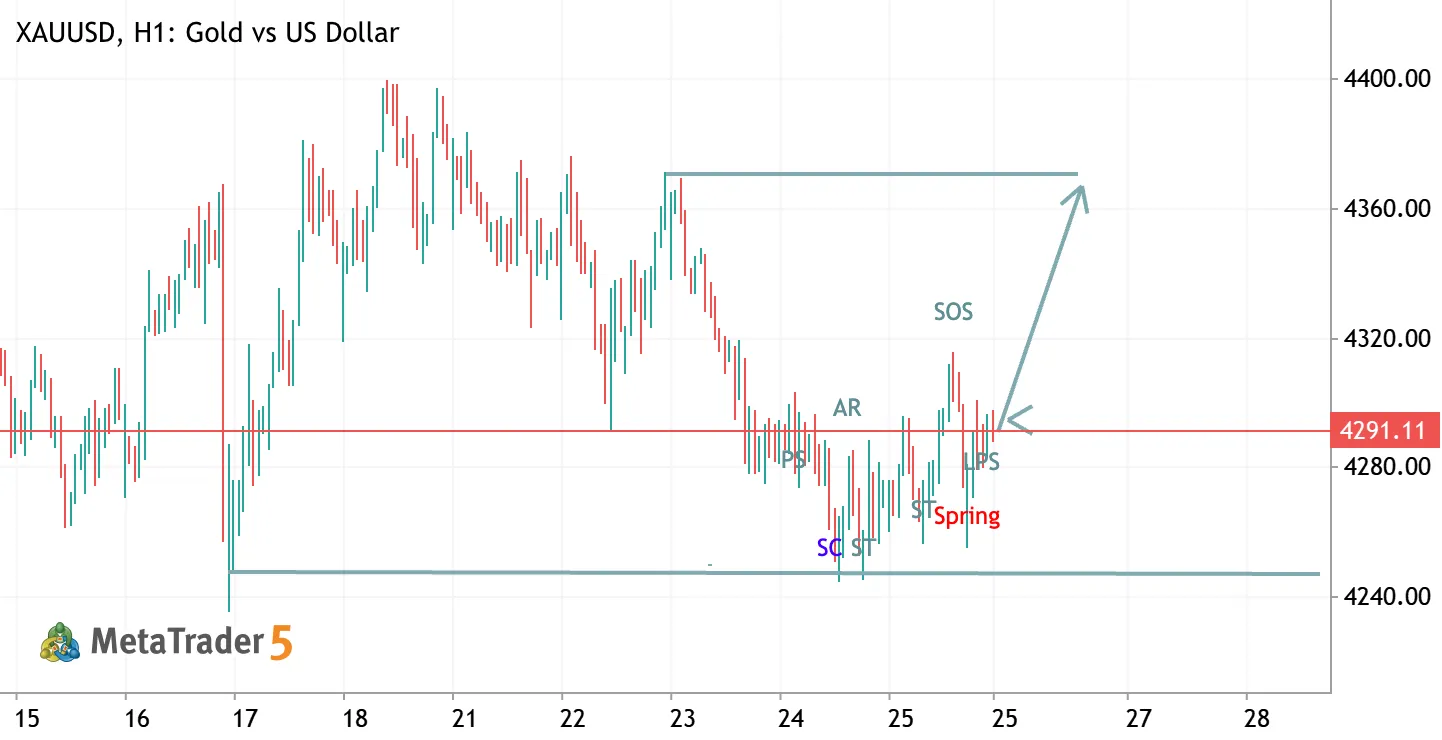
XAUUSD H1 — Wyckoff Accumulation XAUUSD Long Gold vs US Dollar

XAUUSD H1 — Wyckoff Accumulation

XAUUSD H1 is currently showing a potential Wyckoff Accumulation structure. Price has reacted strongly from the lower range after the Spring/ST area and is now showing early signs of strength. If the accumulation range remains valid and support continues to hold, the next potential phase is Markup , which could create a bullish continuation into next week. Investment flow also appears supportive of the bullish scenario. My current bias remains Long , but confirmation is still needed through sustained strength above the accumulation range and continued demand after the SOS. Accumulation → SOS → Markup