

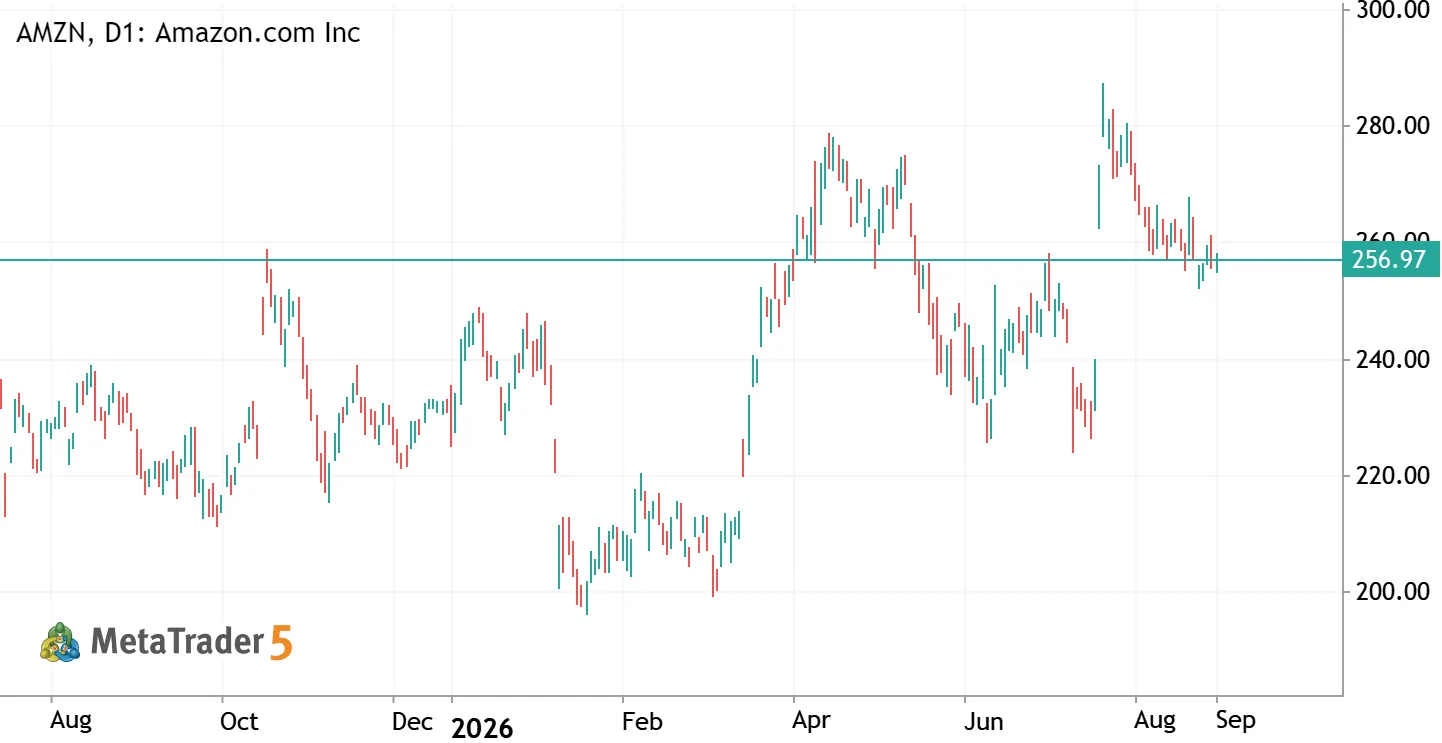
Amazon (NASDAQ: AMZN) | Daily chart | September 9, 2026
View: neutral while the base develops; bullish only after confirmation. Horizon: 2–6 weeks. The latest completed regular session, September 8, closed at $256.97, down 0.60%. This analysis uses that close.
Price structure
The daily chart shows a pullback from the July peak, with price now testing a potential base. Support sits at $254.75 (September 8 low), followed by $253.40 and $251.93 (September 2 and September 1 lows). Resistance is $259.50–261.12, then $264.36 and $267.56, the August 31 and August 28 highs. These are areas to watch, not guaranteed turning points.
Preferred bullish setup
Wait for a daily close above $261.20, ideally on volume above its 20-session average, then a successful retest of $260.50–261.50. A retest that holds and turns higher would suggest improving demand. An illustrative entry near $261 with a protective stop at $258 risks $3 per share. Targets are $267.50 and $270, offering approximately 2.2R and 3R before costs. The second target is a rounded projection of the roughly $252–261 base above its upper boundary. Watch $264.36 for an early rejection. If price gaps beyond the entry zone, reassess the reward/risk instead of chasing.
Failure scenario
A failed retest cancels the breakout entry. A daily close below $251.90 would undermine the broader base and shift attention to $250, then the $245 area. Those lower levels are scenario references. While price remains inside the range, patience is a valid position.
Business backdrop
Amazon reported Q2 revenue of $200.6 billion, up 20%, and AWS revenue growth of 37%. Operating income rose to $27.5 billion. However, trailing twelve-month free cash flow was negative $7.6 billion amid heavy infrastructure investment. Reported net income also included $53.4 billion of non-operating pre-tax other income, primarily from Anthropic investments; headline earnings should not be treated as recurring operating profit. My interpretation: operating momentum supports recovery potential, but cash demands and valuation sensitivity can prolong volatility.
Risk discipline
Size any position from the entry-to-stop distance and a predetermined loss budget. Gaps and slippage can exceed the planned loss. Targets are conditional, and the setup expires if confirmation does not develop within the stated horizon. Educational market analysis, not personalized investment advice.
Sources
AMZN daily price history: https://stockanalysis.com/stocks/amzn/history/
Amazon Q2 2026 results, July 30: https://ir.aboutamazon.com/news-release/news-release-details/2026/Amazon-com-Announces-Second-Quarter-Results/default.aspx
Levels and scenarios are the author’s analysis.

 MQL5 프로필
새 코멘트