BTC/USD: Bearish Breakdown & Fibonacci Golden Zone Retest BTCUSD Short Bitcoin vs US Dollar

BTC/USD: Bearish Breakdown & Fibonacci Golden Zone Retest

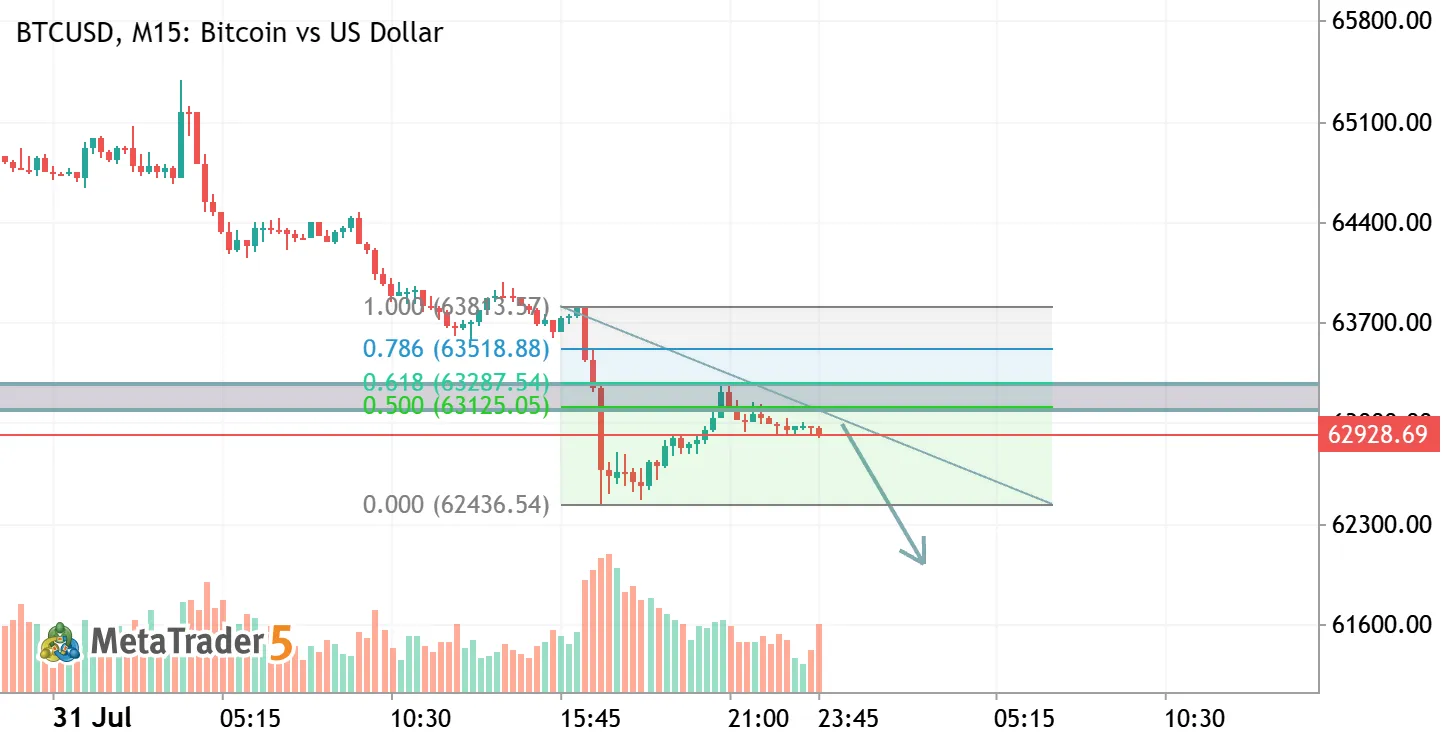
Direction: Short / Sell Asset: BTCUSD Timeframe: M15 📍 Key Trade Levels Entry Zone: $62,900 – $63,120 (Current market price retesting broken support) Stop Loss (SL): $63,550 (Above the 0.786 Fibonacci level / high of the recent pull-back) Take Profit 1 (TP1): $62,440 (Recent local swing low) Take Profit 2 (TP2): $62,000 (Extended target as projected by the trend arrow) 📊 Setup Rationale Support Breakout: Price aggressively broke down below the previous key horizontal support zone ($63,120 – $63,280). Fibonacci Golden Zone Confluence: The retracement move tapped directly into the 0.50 ($63,127) and 0.618 ($63,288) Fibonacci retracement level, which now acts as strong resistance. Bearish Market Structure: Lower lows and lower highs are clearly established on the short timeframe following

BTCUSD: Bearish Continuation Setup After Support Bounce BTCUSD Short Bitcoin vs US Dollar

BTCUSD: Bearish Continuation Setup After Support Bounce

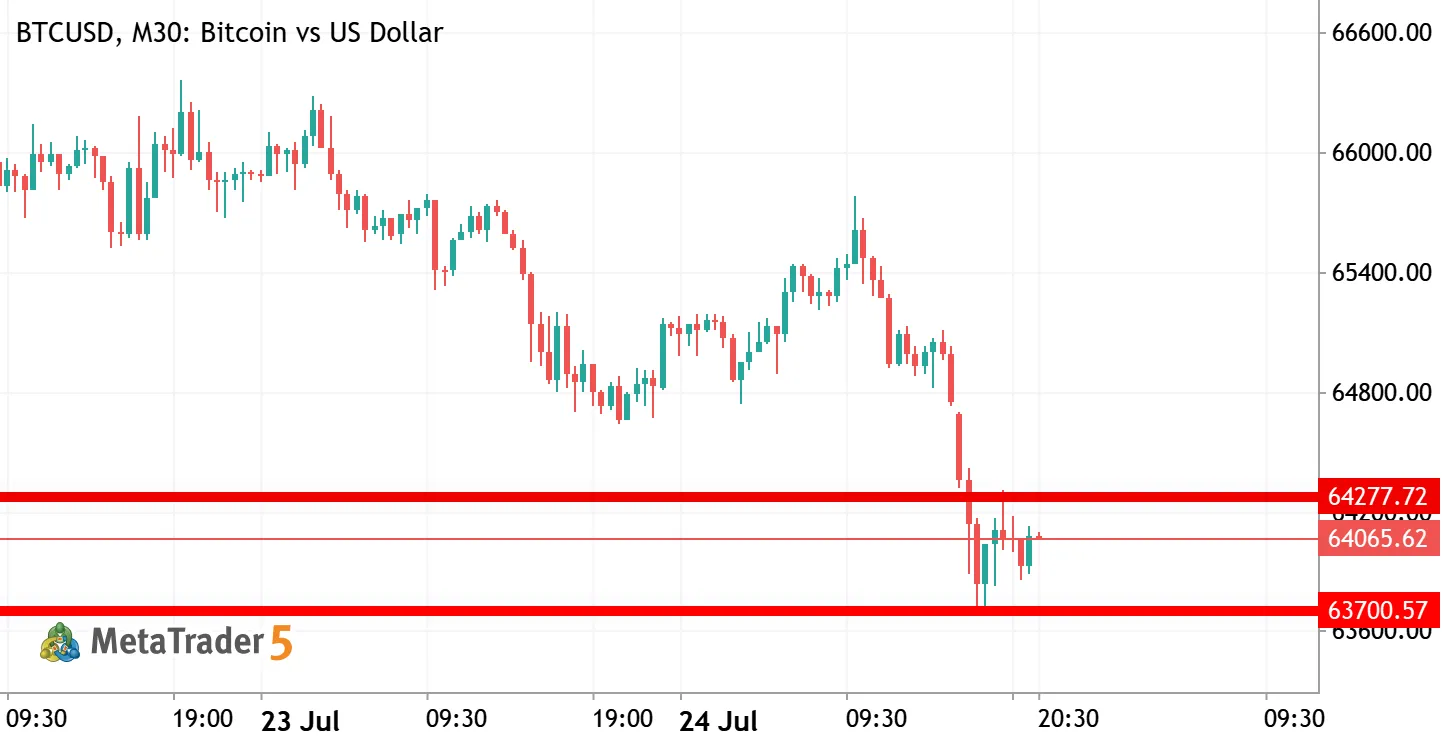
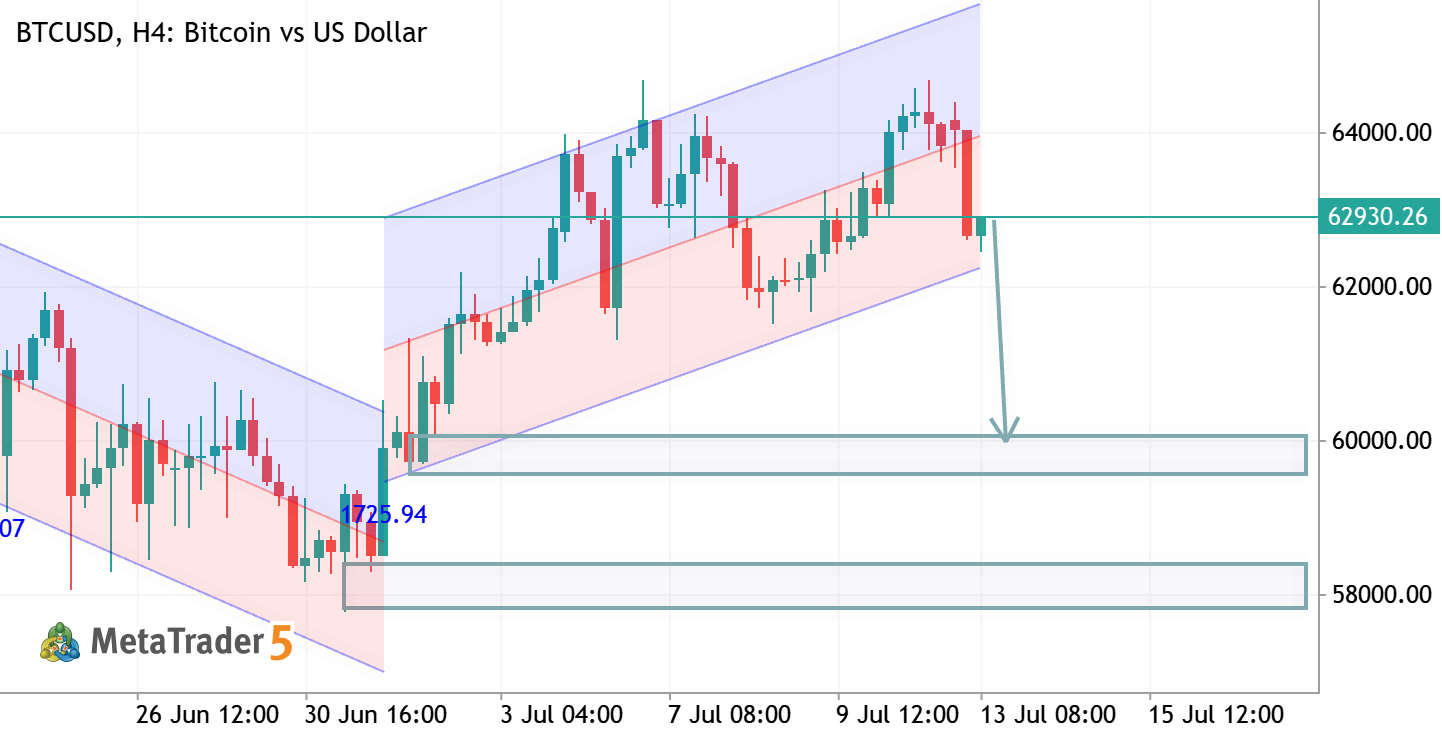
📉 BTCUSD Market Structure Analysis Bitcoin recently bounced from the key support area around 63,700–64,000. However, price is now approaching a previous bullish reaction zone, which may act as resistance after the recent breakdown. I'm watching this area for a possible bearish rejection. If sellers regain control, BTC could continue its downside movement toward lower liquidity areas. Key levels: 🔴 Resistance / rejection zone: Previous bullish reaction area 🟢 Support: 63,700–64,000 Confirmation from price action will be important before considering the next move.
BTCUSD TRADE IDEA BTCUSD Bitcoin vs US Dollar

BTCUSD TRADE IDEA

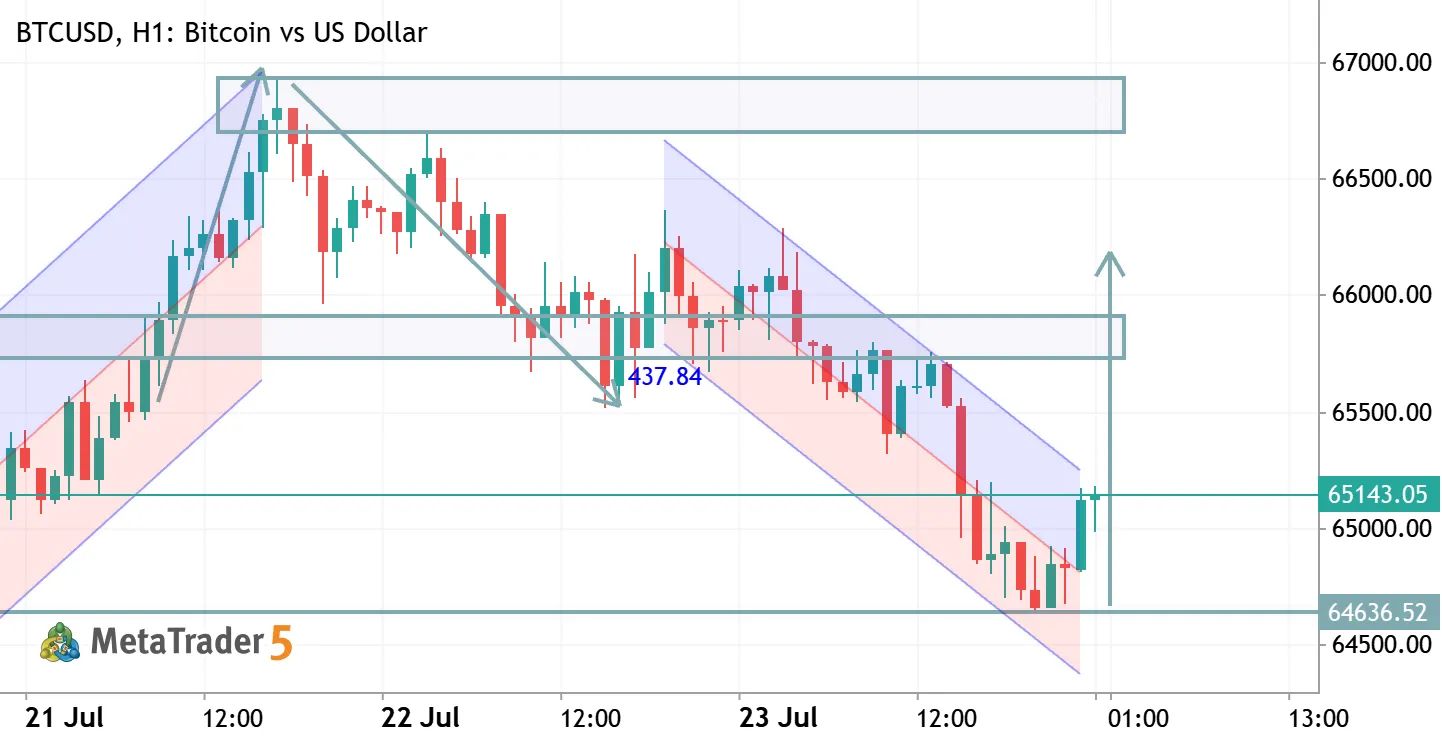
BTCUSD (H1) Bias: Buy Price has bounced from the lower boundary of the descending channel and is attempting a bullish breakout. A sustained close above 65,100–65,200 strengthens the bullish continuation. Buy Entry: 65,100–65,200 (or on a confirmed retest after breakout) Take Profit 1: 65,600 Take Profit 2: 66,000 Take Profit 3: 66,700 Stop Loss: Below 64,650 Summary: Momentum is turning bullish after rejecting channel support. A confirmed breakout above resistance favors further upside toward 65.6K–66.7K
BTCUSD H4 ANALYSIS BTCUSD Bitcoin vs US Dollar

BTCUSD H4 ANALYSIS

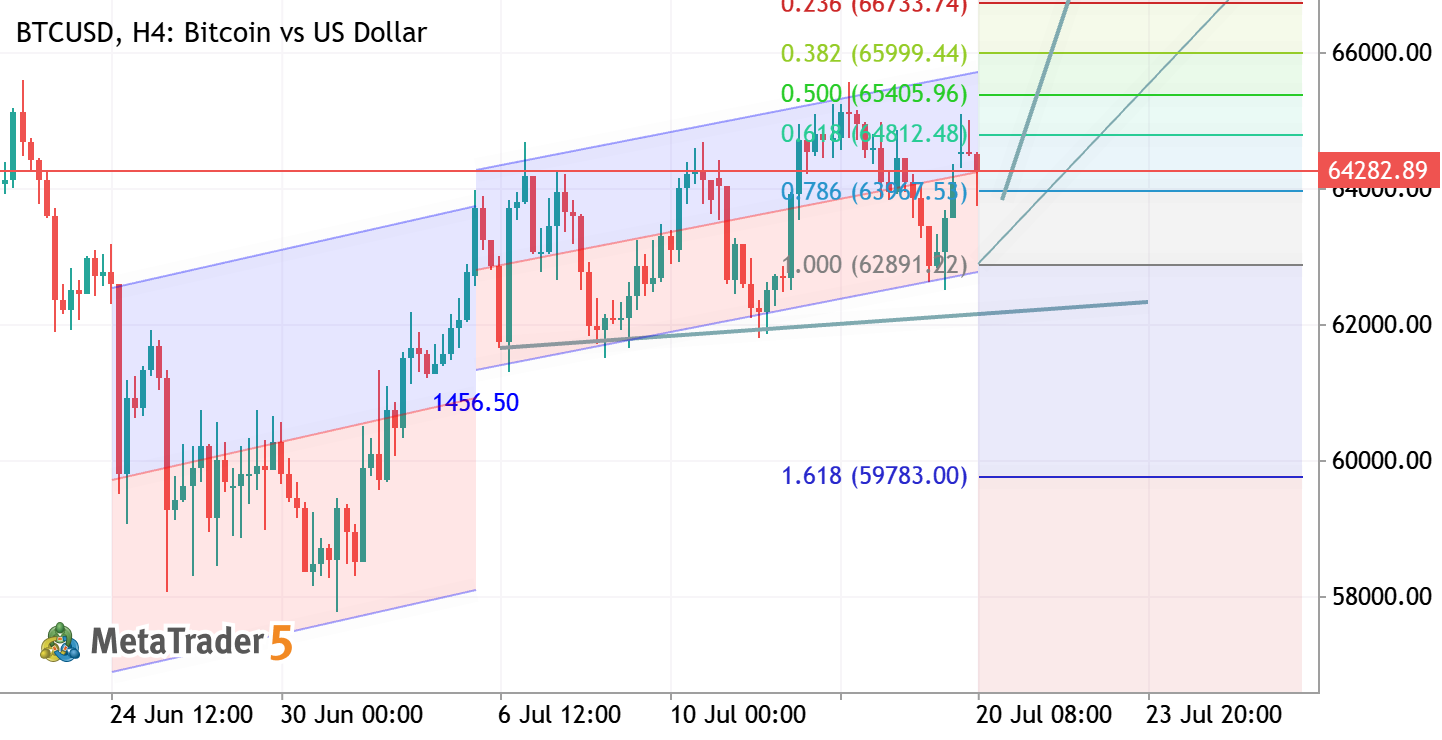
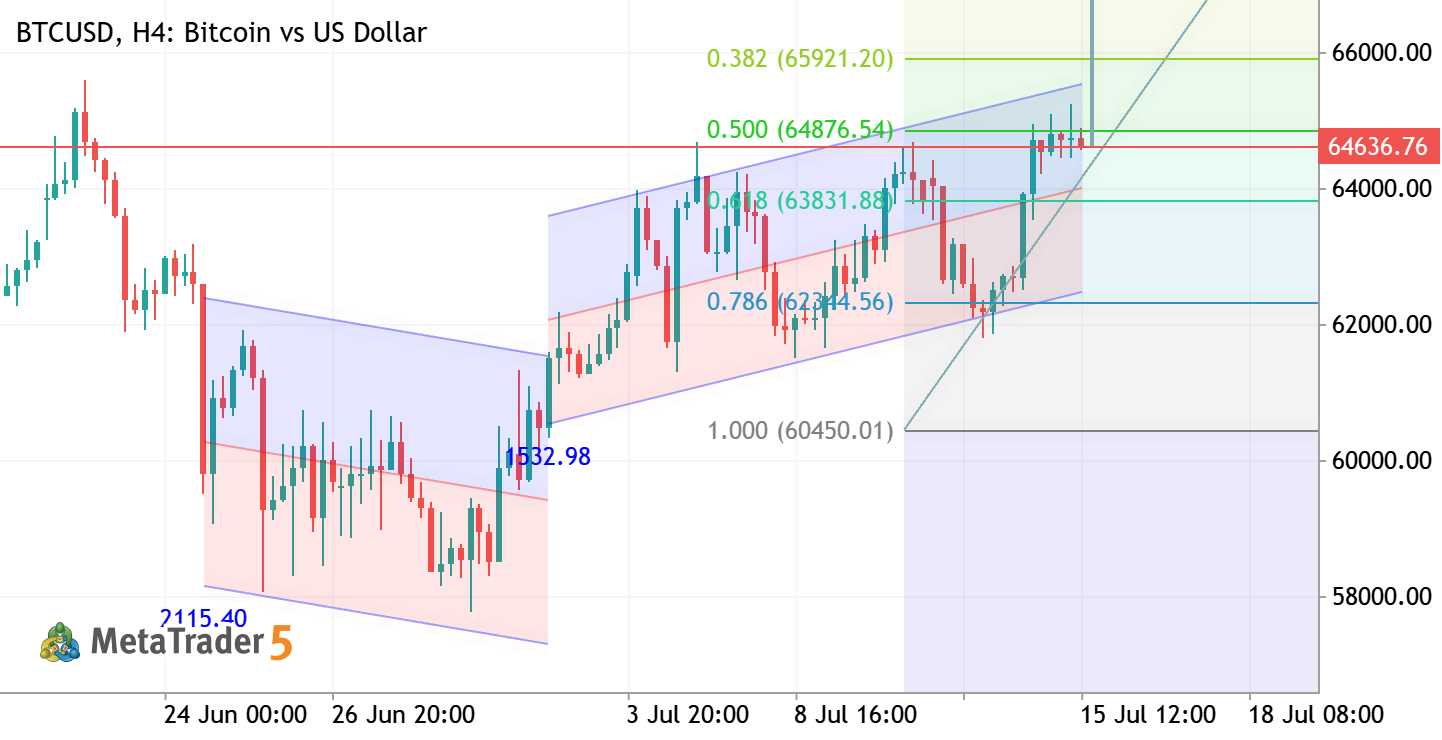
BTCUSD H4 Analysis Bitcoin remains in a strong bullish trend, trading inside an ascending channel while respecting Fibonacci support levels. As long as price holds above the key demand zone, buyers are likely to target the next resistance area. 📈 Bias: Bullish 🎯 Targets: 68,300 → 69,700 ⚠️ Key Support: 63,700–64,000 Trend remains bullish. Watch for a breakout above resistance or a pullback to support for higher-probability entries. Always manage risk.
BTCUSD TRADE IDEA BTCUSD Short Bitcoin vs US Dollar

BTCUSD TRADE IDEA

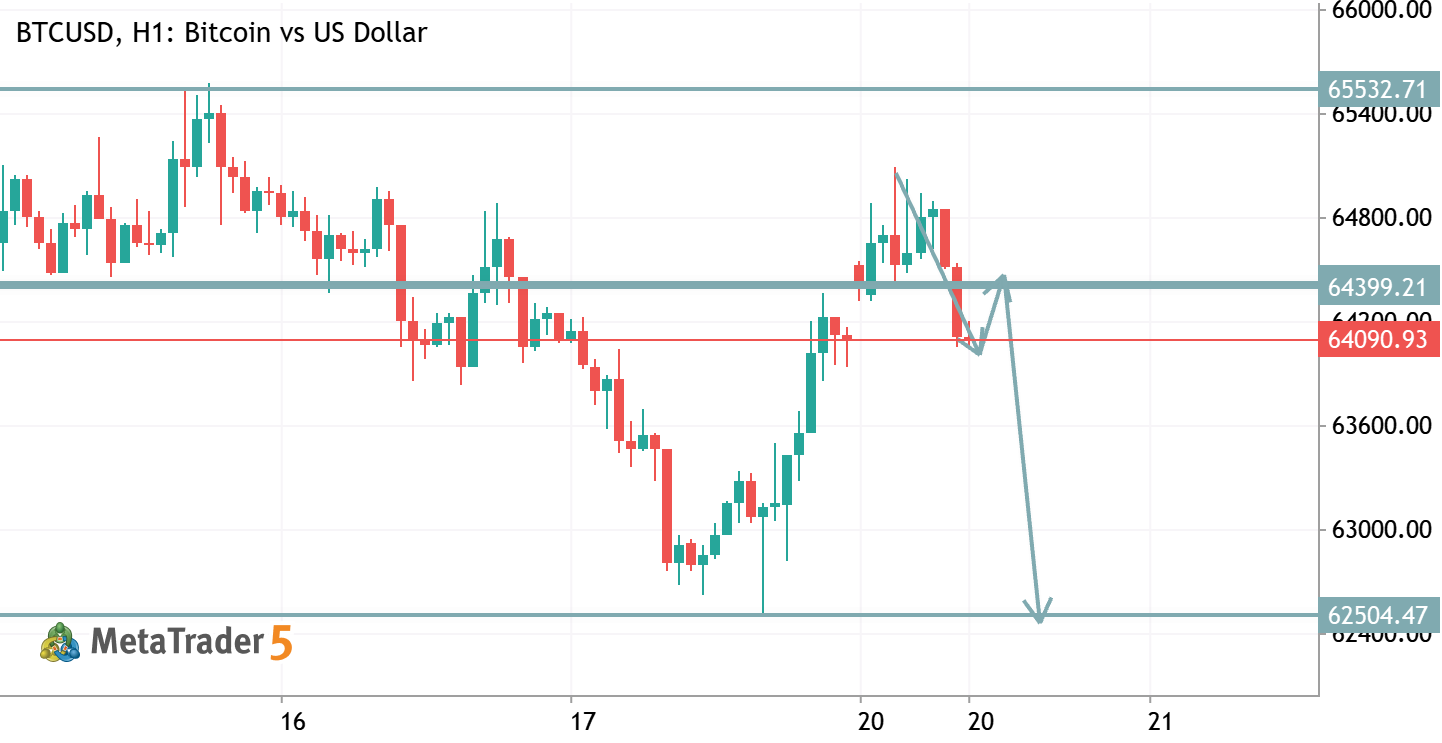
BTCUSD (H1) Bias: Bearish below 64,400 resistance. Key Resistance: 64,400 – 64,550 . Key Support: 64,160 , then 62,500 . Price is rejecting the resistance zone after a strong rally, suggesting sellers are defending this level. A confirmed H1 close below 64,160 increases the probability of a move toward 62,500 . If price breaks and closes above 64,550 , the bearish setup is invalidated and buyers may regain control. Trade Idea: Sell below 64,160 after confirmation. Targets: 63,500 → 62,500 . Stop Loss: Above 64,550 .
BTCUSD TRADE IDEA BTCUSD Long Bitcoin vs US Dollar

BTCUSD TRADE IDEA

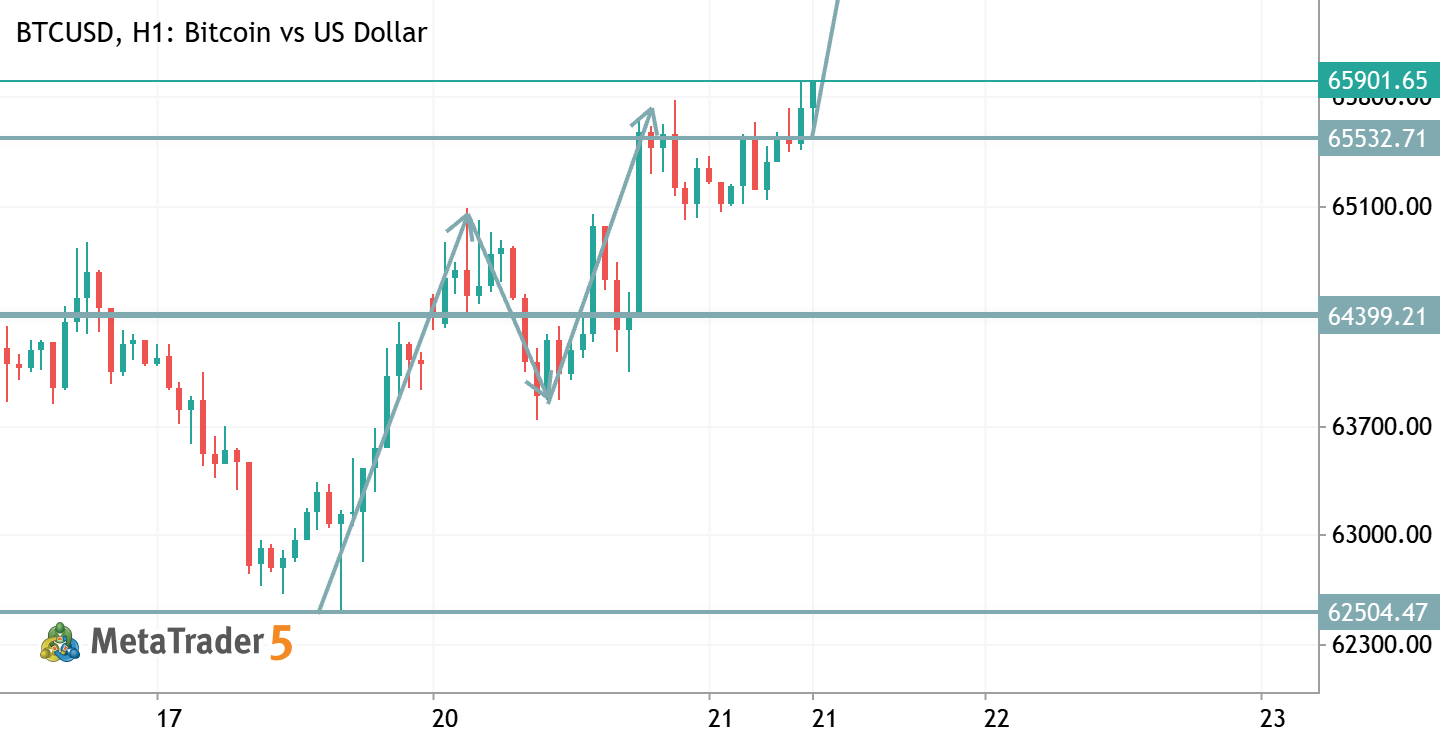
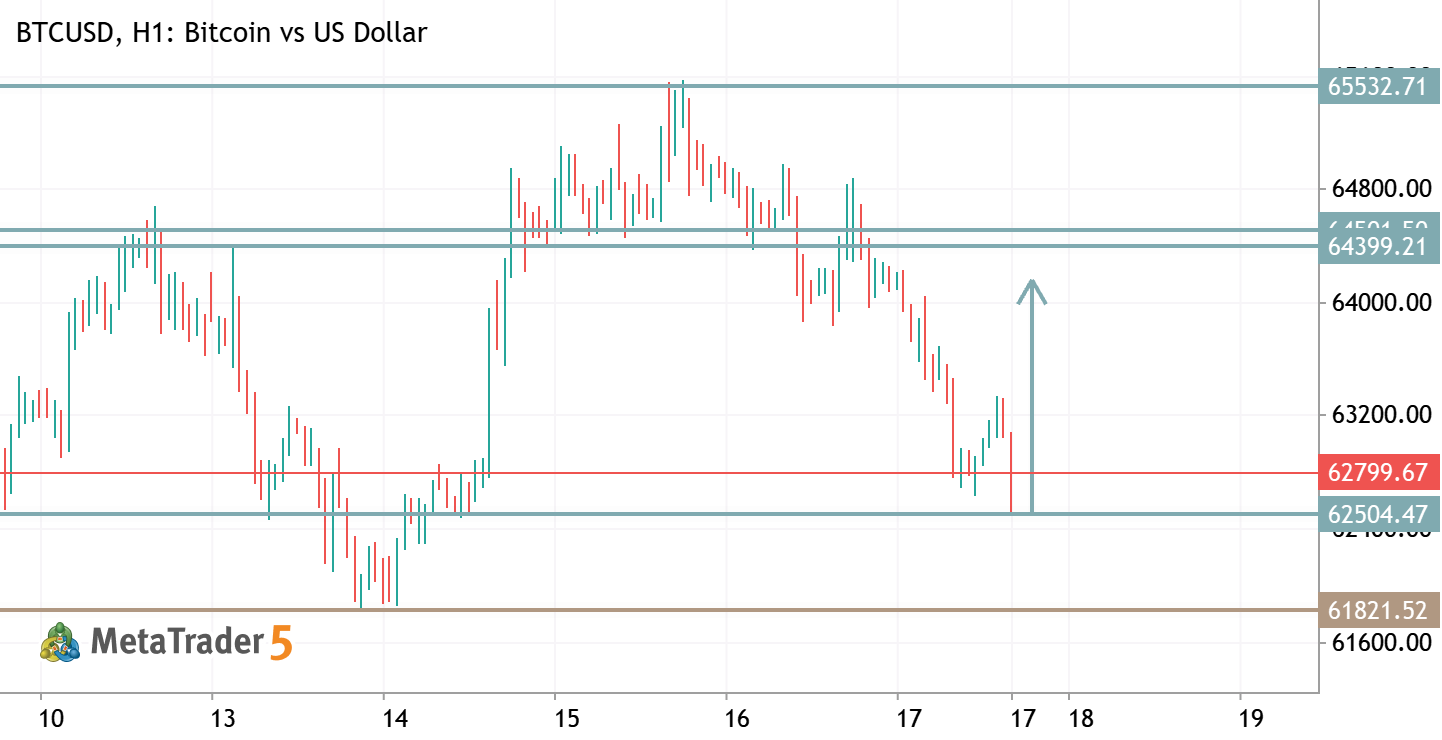
BTCUSD (H1) – Buy Bias: Bullish if price holds above 62,500–62,600 support. Entry Zone: 62,500–62,650 Stop Loss: Below 61,820 Take Profit 1: 63,400 Take Profit 2: 64,400 Take Profit 3: 65,530 Outlook: Price is testing a key support zone. If buyers defend 62,500 and a bullish H1 candle closes above 62,820 , the probability of a move toward 63,400 and 64,400 increases. A break below 61,820 invalidates the bullish setup.
BTCUSD H4 ANALYSIS BTCUSD Bitcoin vs US Dollar

BTCUSD H4 ANALYSIS

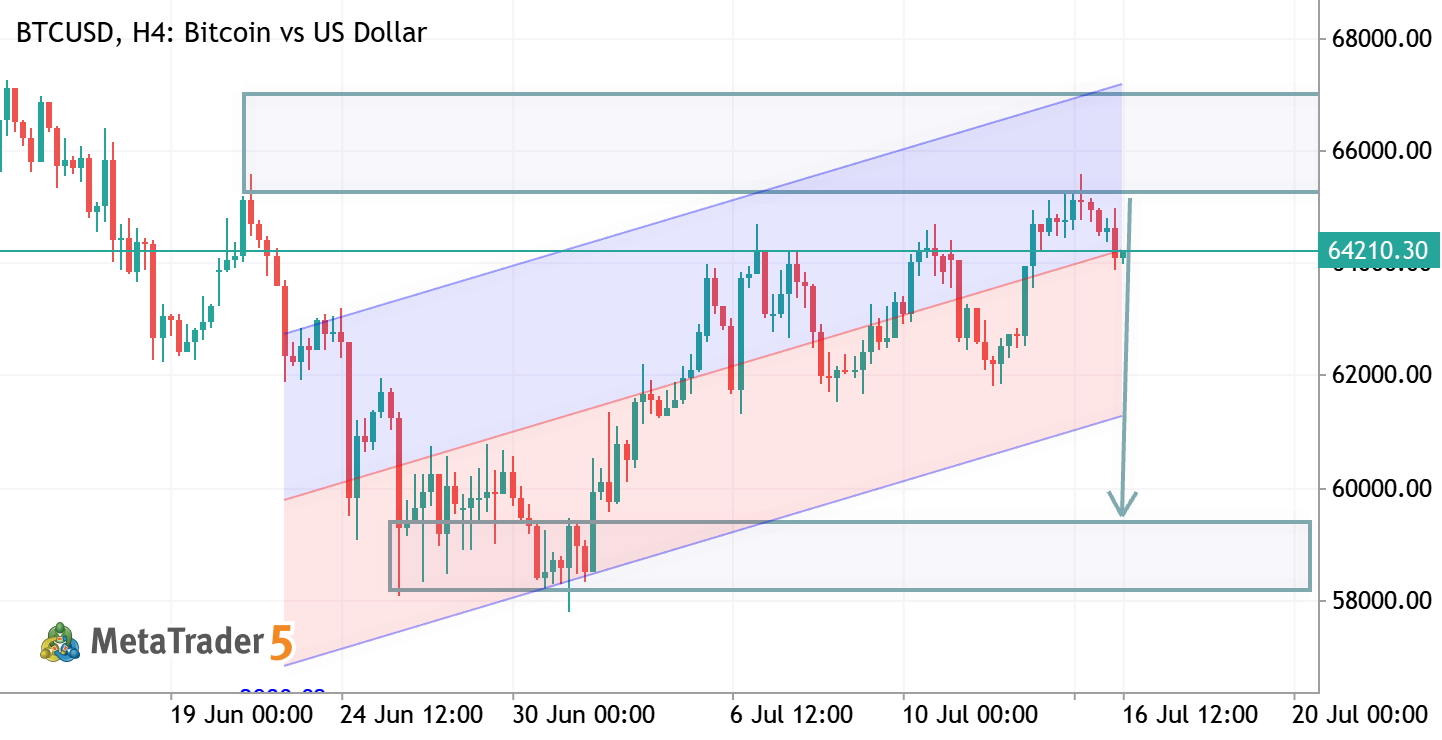
BTCUSD – H4 Analysis BTCUSD is trading inside an ascending channel and testing a key resistance zone around 64K. The overall trend remains bullish as long as price holds above channel support. A confirmed breakout above resistance could open the door for a continuation toward 66K–68K, while rejection from this level may trigger a healthy pullback toward the lower channel before the next bullish move. Bias: Bullish above support. Wait for a confirmed breakout or a pullback for better entries.
BTCUSD TRADE IDEA BTCUSD Long Bitcoin vs US Dollar

BTCUSD TRADE IDEA

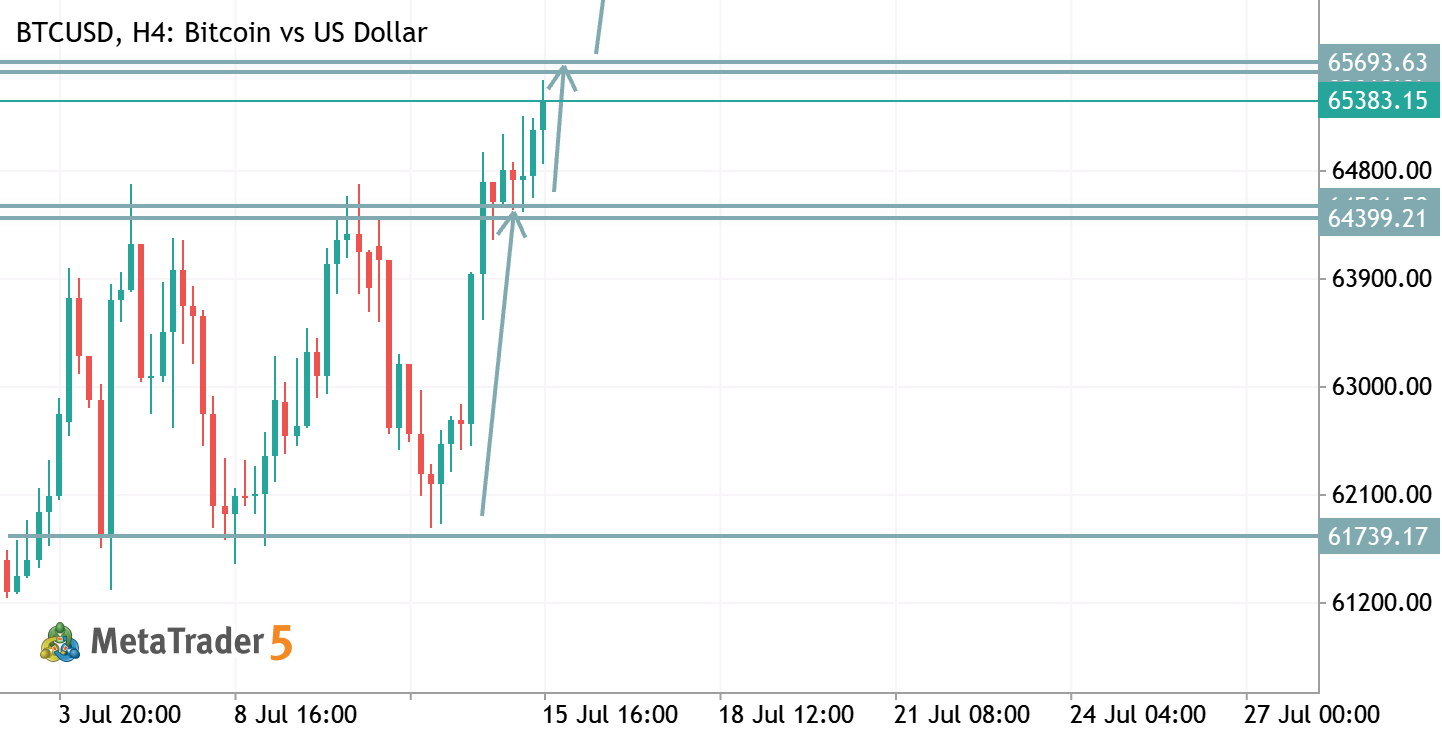
BTCUSD (H4) Trend: Bullish recovery approaching a major resistance zone. Resistance: 64,400–65,400 (first supply zone), 67,200 (major resistance). Support: 61,700 . Short Setup: Wait for a bearish rejection or bearish engulfing candle around 64,400–65,400 . Entry: After confirmation of rejection. Stop Loss: Above 65,600 (or above the rejection high). Take Profit 1: 63,000 . Take Profit 2: 61,800 . Bias: Price is testing a key resistance area. If buyers fail to break and hold above 65,400 , a pullback toward support is the higher-probability short setup. Avoid entering before bearish confirmation.
BTCUSD TRADE IDEA BTCUSD Short Bitcoin vs US Dollar

BTCUSD TRADE IDEA

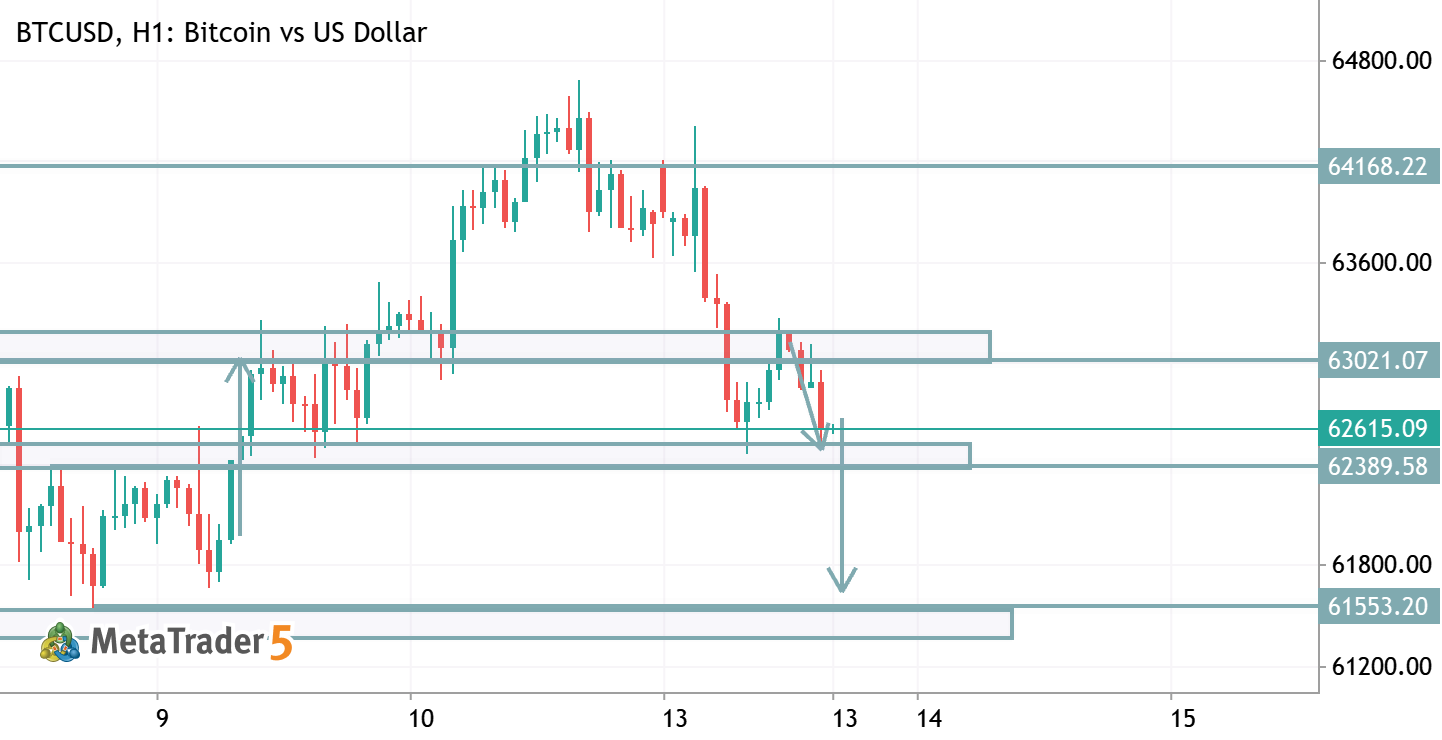
BTCUSD (H1) – Bias: Bearish below 63,020 resistance. Current Zone: Price is testing the 62,400–62,600 support area. Sell Scenario: A confirmed H1 candle close below 62,400 could trigger further downside toward 61,550 . Bullish Invalidation: If price reclaims and closes above 63,020 , buyers may target 64,170 resistance. Key Levels: Resistance: 63,020 → 64,170 Support: 62,400 → 61,550 Outlook: Short-term momentum favors sellers unless BTC breaks and holds above 63,020 .