
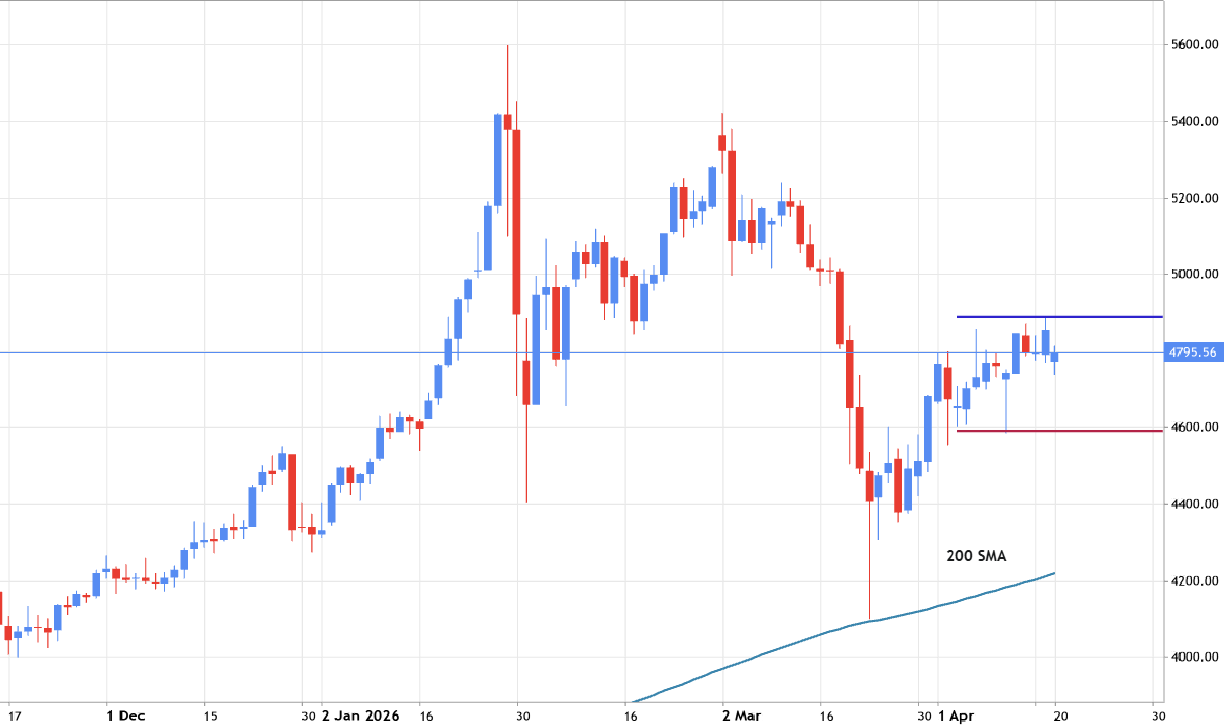
The daily price is located above 200 SMA in the bullish area of the chart. The price is on ranging within 4589/4889 s/r channel waiting for the secondary correction to be started or for the strong bullish trend to be continuing.
Trading Summary: waiting for direction
5

 MQL5 프로필
새 코멘트
The price was already to be reversed to the primary bearish market condition. For now, the price is on secondary ranging to be near and below 200 SMA for waiting for the direction of the strong bearish trend to be resumed or for the primary bullish reversal to be started.
The price is crossing 200 SMA for the bearish reversal to be started ... on open daily bar for now ...
Wow. This is new wesite. Good Idea
You’re asking a very good question 👍
When price is above the 200 SMA, it simply means the market is in a bullish trend. But that does NOT mean you should jump in immediately.
Right now, the market is ranging between key levels (4589 – 4889), so it’s in a waiting phase, not a clear entry zone.
👉 What you should do instead: Wait for a breakout above resistance (4889) then look for buys Or wait for a pullback to support (4589) then look for confirmation to buy Avoid entering in the middle of the range (this is where most beginners lose money)
📌 Key lesson: Trend = direction Entry = timing
Even in a bullish market, bad timing bad trade
You’re on the right path by asking questions—keep learning 💯📈
Greetings my name is Collins I haven't trade any day and I'm willing to learn that's why I downloaded this app so I can learn....
Here you said that the market price is located above 200 SMA" those mean it's not okay to jump into the market and start trading?