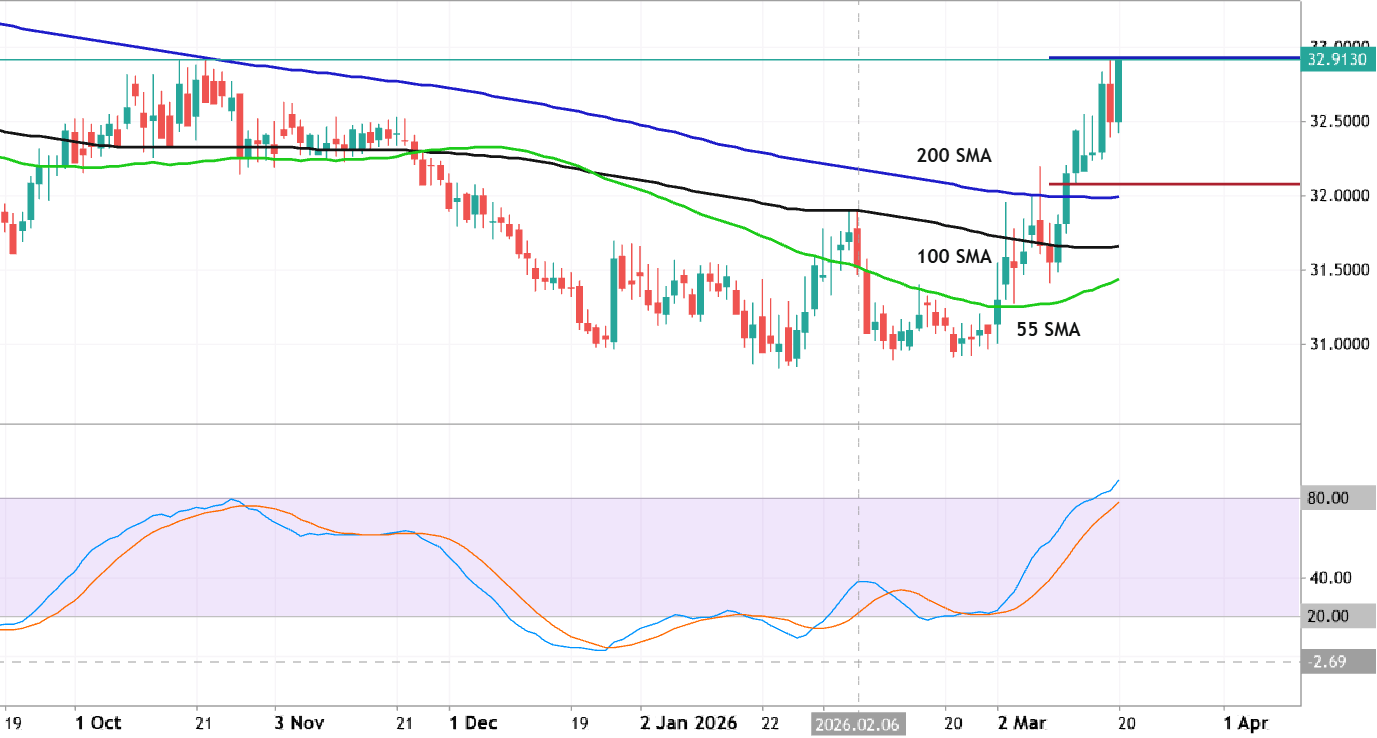
Daily price broke 200 SMA to above for the good daily breakout with the primary bullish reversal. The price is testing the resistance level at 32.93 to above for the daily bullish trend to be continuing. But the Stochastic Oscillator is indicating the overbought level for the price movement so the alternative way for the price movement is the secondary daily ranging within 32.07/32.93 s/r channel waiting for direction of the strong bullish trend to be continuing or the bearish reversal to be started. Trading Summary: waiting for direction.
Daily price was bounced from resistance level at 32.93 to below for the secondary correction. For now, the price is trying to cross the 32.07 support and 200 SMA to below for the primary bearish reversal to be started with 31.86 as the nearest target to re-enter.

새 코멘트
Daily price was bounced from resistance level at 32.93 to below for the secondary correction. For now, the price is trying to cross the 32.07 support and 200 SMA to below for the primary bearish reversal to be started with 31.86 as the nearest target to re-enter.