

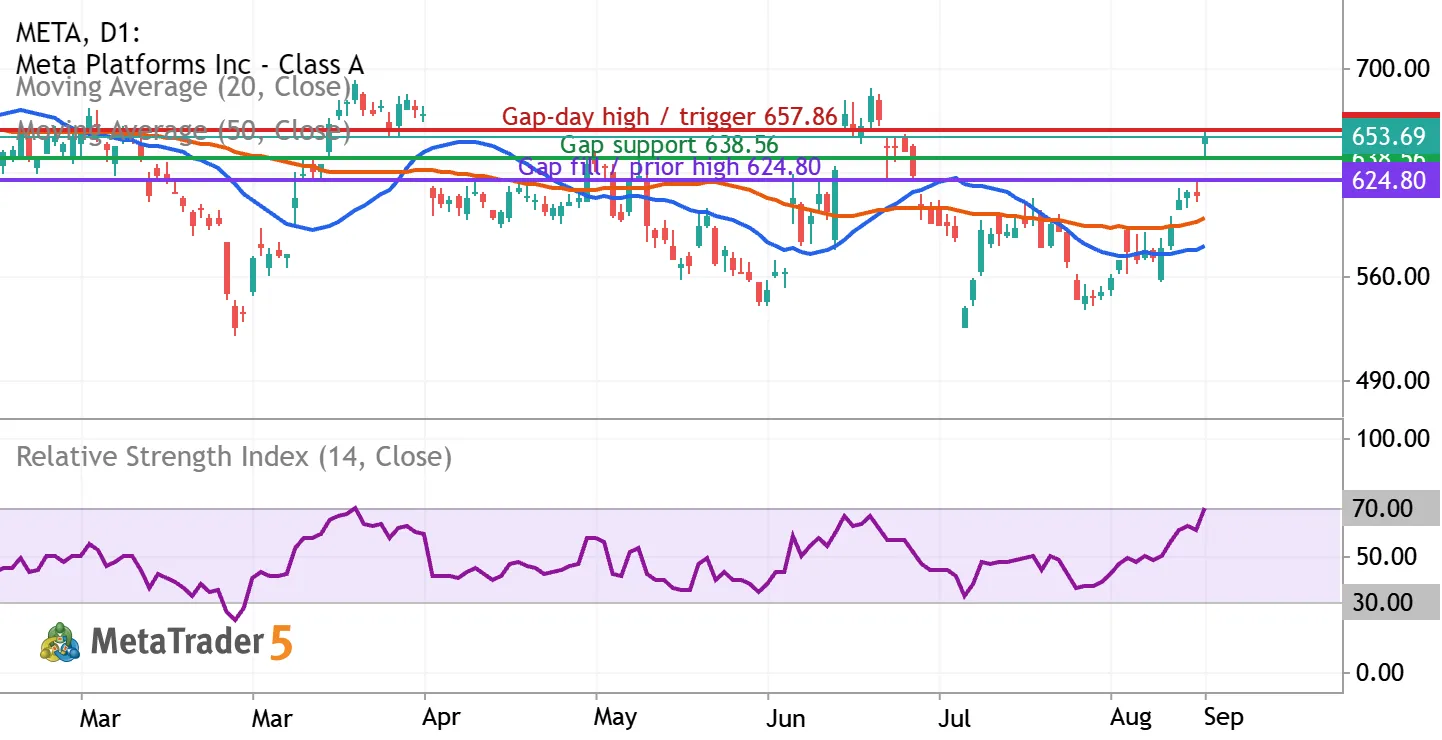
Meta Platforms (NASDAQ: META) | Daily chart | September 10, 2026
View: conditionally bullish, with patience after a sharp gap higher. Horizon: 2–4 weeks. META closed September 9 at $653.69, up 6.55%. The session low of $638.56 stayed above September 8’s $624.80 high, leaving an unfilled daily gap. Holding that gap would support continuation; a failure would weaken the breakout.
Reading the indicators
The blue line is the 20-day simple moving average, the orange line the 50-day simple moving average, and the lower panel is RSI(14), all using closing prices. At the September 9 candle, MetaTrader showed approximately $580.54, $598.58, and 70.43 respectively. Price is above both averages, but the 20-day average remains below the 50-day: this is a strong recovery without a fully bullish moving-average alignment yet. RSI near 70 signals strong but stretched momentum. It can remain elevated during a trend, so it is neither an automatic sell signal nor a reason to chase.
The three chart levels
Green $638.56: the gap-day low and first support test.
Red $657.86: the gap-day high; a sustained close above it would confirm further progress.
Purple $624.80: the previous session’s high and the lower boundary of the daily gap. Trading back to it would fill the gap between the two sessions’ ranges.
Preferred pullback setup
Wait for a pullback toward $638.56–642 and evidence that buyers defend it. One confirmation would be an hourly close back above $640 after testing support, followed by a successful retest near $640. An illustrative entry at $640 with a protective stop at $632 risks $8 per share. The first target is $657.80, about 2.2 times that risk before costs. A sustained break above $657.86 could extend the move toward the $680–686 area, where July highs provide a reference. The $680 objective would represent 5R from the example entry, but requires continuation beyond the first target.
This setup is not active at $653.69. Buying there while keeping a $632 stop offers little reward to the nearby high. If price runs directly higher without a retest, let it go and reassess after a new base forms.
What would change the view
A daily close below $638.56 weakens the gap-hold case. A close below $624.80 invalidates this particular continuation thesis and shifts attention to $609.74 and $604.35, the September 8 and September 3 lows. The example trade stop at $632 is separate from that broader invalidation level; do not widen it to accommodate a failing trade.
Fundamental context
Meta reported Q2 revenue of $60.80 billion, up 28%, while operating income fell 8% to $18.78 billion and operating margin narrowed to 31% from 43%. Expenses included $2.40 billion of legal charges and $1.18 billion of severance. Full-year capital expenditure guidance was $130–145 billion. My interpretation: strong business growth supports the recovery case, while spending and margin pressure justify demanding price confirmation. These quarterly figures provide context, not an explanation of the September 9 rally’s specific catalyst.
Risk and sources
Size any position from a predetermined loss budget and the entry-to-stop distance. Gaps and slippage can exceed planned losses. Reassess if confirmation does not develop within the stated horizon. Educational market analysis, not personalized investment advice.
Daily prices: https://stockanalysis.com/stocks/meta/history/
Company results: https://investor.atmeta.com/investor-news/press-release-details/2026/Meta-Reports-Second-Quarter-2026-Results/default.aspx
Indicators and annotated chart: MetaTrader. Trading scenarios are the author’s analysis.

 MQL5 프로필
새 코멘트