

The commodity complex showed quite a change over the past 24 hours, going from every sector in the green to nearly every sector in the red.
It should be noted the same flip of the daily calendar page meant the end of the old noncommercial positioning week and the beginning of the new.
Don’t Miss a Day: From crude oil to coffee, sign up free for Barchart’s best-in-class commodity analysis.
The Grains sector was mostly lower, though soybean meal was a standout exception on strong commercial buying.
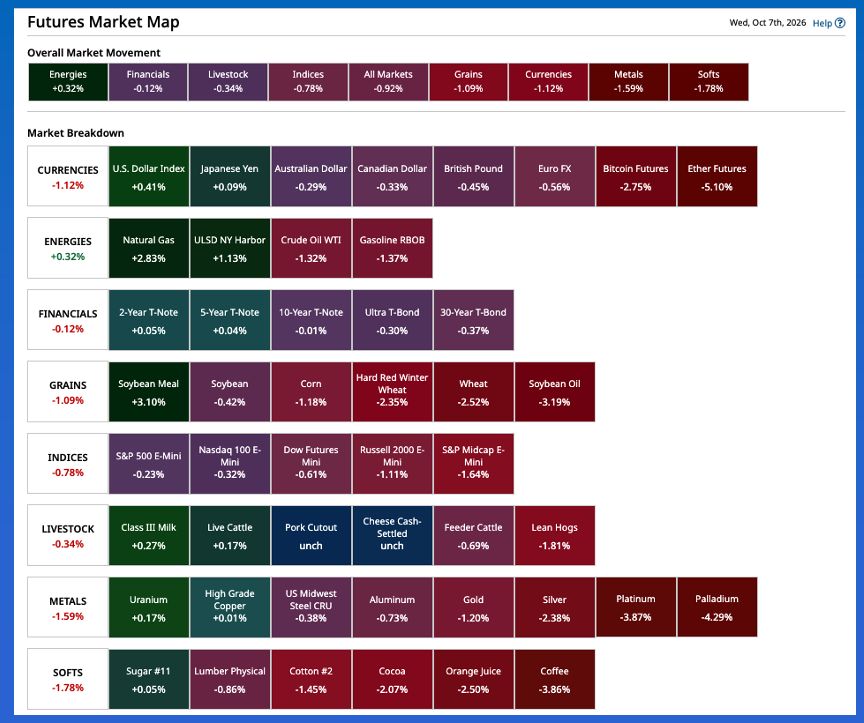
Afternoon Summary: As markets across the commodity complex move toward a close Wednesday, we get closer to being over the Hump (as in Day) this week. This means we are on the downhill slide toward the weekly close, the only price that matters if we combine the Wilhelmi Element[i] and the Goldilocks Principle[ii]. We also have to keep in mind that Wednesdays are the first day of the new noncommercial positioning week, often leading to Watson getting busy again. What stood out to me today? US Treasury yields initially extended recent increases before slipping back a bit. Similarly, the US dollar index firmed as much as 0.67 also before pulling back. In other news, the commodity complex was in the red Wednesday, literally. As of this writing only the Energies sector was in the green, a day after I talked about how every sector of the complex was glowing red. Maybe this was nothing more than the difference between the last day of one noncommercial positioning week (Tuesday) and the start of the next noncommercial positioning week (Wednesday). We know market fundamentals didn’t magically change overnight, despite the excuses many in the BRACE Industry[iii] will be making up this afternoon and evening.
Corn: The corn market closed lower Wednesday. For now, I’m not going to read a lot into one day’s move, though futures spreads did stand out to me. December (ZCZ26) closed 6.0 cents lower, after falling as much as 7.5 cents, and lost 0.75 cent to March which lost 0.5 cent to May which lost 0.5 cent to July. The consistency of the spread activity indicates the commercial side was putting pressure on the market during Hump Day. If so, this isn’t overly surprising for a couple reasons: First, the rally seen through the early part of this week (Dec26 was up 11.25 cents from last Friday’s settlement) likely sparked sales of newly harvested or soon to be harvested bushels. Second, most of the US Plains and Midwest[iv] are seeing, and could continue to see, favorable harvest weather this week, likely creating more commercial hedge pressure. As I said in the opening Summary, let’s wait to see where the market closes this coming Friday, though we know in advance the last couple hours of the day will be skewed by USDA’s next Keno game (October WASDE). As for tonight through tomorrow morning, it will be interesting to see what happens with the National Corn Index, national average basis, and open interest changes in the corn market.
Soybeans: The oilseed sub-sector was mostly lower at Wednesday’s close, but I have to once again tip my cap to the soybean meal market. Here we see the December issue (ZMZ26) settled $11.00 higher and gained a $1.60 on the January issue, moving the spread back to an inverse of $1.20. The recent high daily close was an inverse of $1.80 on September 24. We will get the final numbers for the 2025-26 marketing year export shipments in tomorrow morning’s weekly export sales and shipments update, for business through Thursday, October 1. The previous update showed soybean meal exports running 14% ahead of the 2024-25 marketing year. In its previous WASDE Keno game USDA estimated a 13.4% year-over-year increase in bean meal exports. As for soybeans, the November issue (ZSX26) closed this first day of the Goldman Roll with a loss of 5.5 cents after dropping as much as 10.25 cents. The carry in the Nov-January futures spread firmed by 0.75 cent, raising the question of if this was due to renewed commercial pressure for the same reasons discussed in corn, or from the Index rolling its long Nov positions to January. We will get a hint with tonight’s National Soybean Index and national average basis calculations.
Wheat: Is anyone shocked by the fact the wheat sub-sector posted a double-digit selloff this first day of the new noncommercial positioning week after finishing with double-digit gains Tuesday? If you are, maybe the commodity complex is not where you should be putting your money. Particularly the newbies introduced to the complex by predictive market websites focusing on wheat and natural gas markets. (There is no amount of whisky[v] that makes that sound like a good idea.) The December SRW issue (ZWZ26) closed 17.75 cents lower after falling as much as 19.5 cents. Additionally, Dec lost 1.25 cents to March which lost 1.25 cents to May. This put the nearby spread at a carry of 14.5 cents and covering 60% calculated full commercial carry, as compared to the end of September settlement covering 62%. (Keeping in mind a Down Escalator Simulator[vi] is still in play with SRW wheat, with the September-December finishing August covering 67%.) Over in HRS, where harvest should be wrapping up soon, December (MWZ26) was down 9.5 cents after dropping as much as 14.0 cents and lost 1.5 cents to March, the spread covering 60%.
[i] The only price that matters is the close.
[ii] Daily charts are too hot, monthly charts are too cold, but weekly charts are just right.
[iii] Brokers/Reporters/Analysts/Commentators/Economists whose fabrication of reasons why markets move each day is one of the reasons I came up with Rule #5: It’s the What not the Why.
[iv] However, the eastern Corn Belt could see heavy rains associated with the remnants of Hurricane Isaias this coming weekend. I made this a footnote so I didn’t have to try to pronounce the name of the storm.
[v] Or as Mark Twain said, “Too much of anything is bad, but too much good whiskey is barely enough.”
[vi] The nearby futures spread follows the same track as the one before it.
On the date of publication, Darin Newsom did not have (either directly or indirectly) positions in any of the securities mentioned in this article. All information and data in this article is solely for informational purposes. For more information please view the Barchart Disclosure Policy here.
More news from Barchart
What Did We See in the Commodities Complex During Hump Day? Focusing on Bonds’ Past Performance Is the Biggest Mistake You Could Make in 2026 Nasdaq Futures Slip as Rising Bond Yields Weigh on Chip Stocks, FOMC Minutes on Tap Corn, Soybeans, and Wheat: What Is Really Driving Grain Volatility?