


One of my New Year’s resolutions was to become more familiar with the various screeners Barchart offered. Roughly 300 days into 2026, I’m making good on it.
An idea I’ve had for a while was to try to confirm – or bust – the myth that the stock market produces 8%-10% returns a year.
More Top Stocks Daily: Go behind Wall Street’s hottest headlines with Barchart’s Active Investor newsletter.
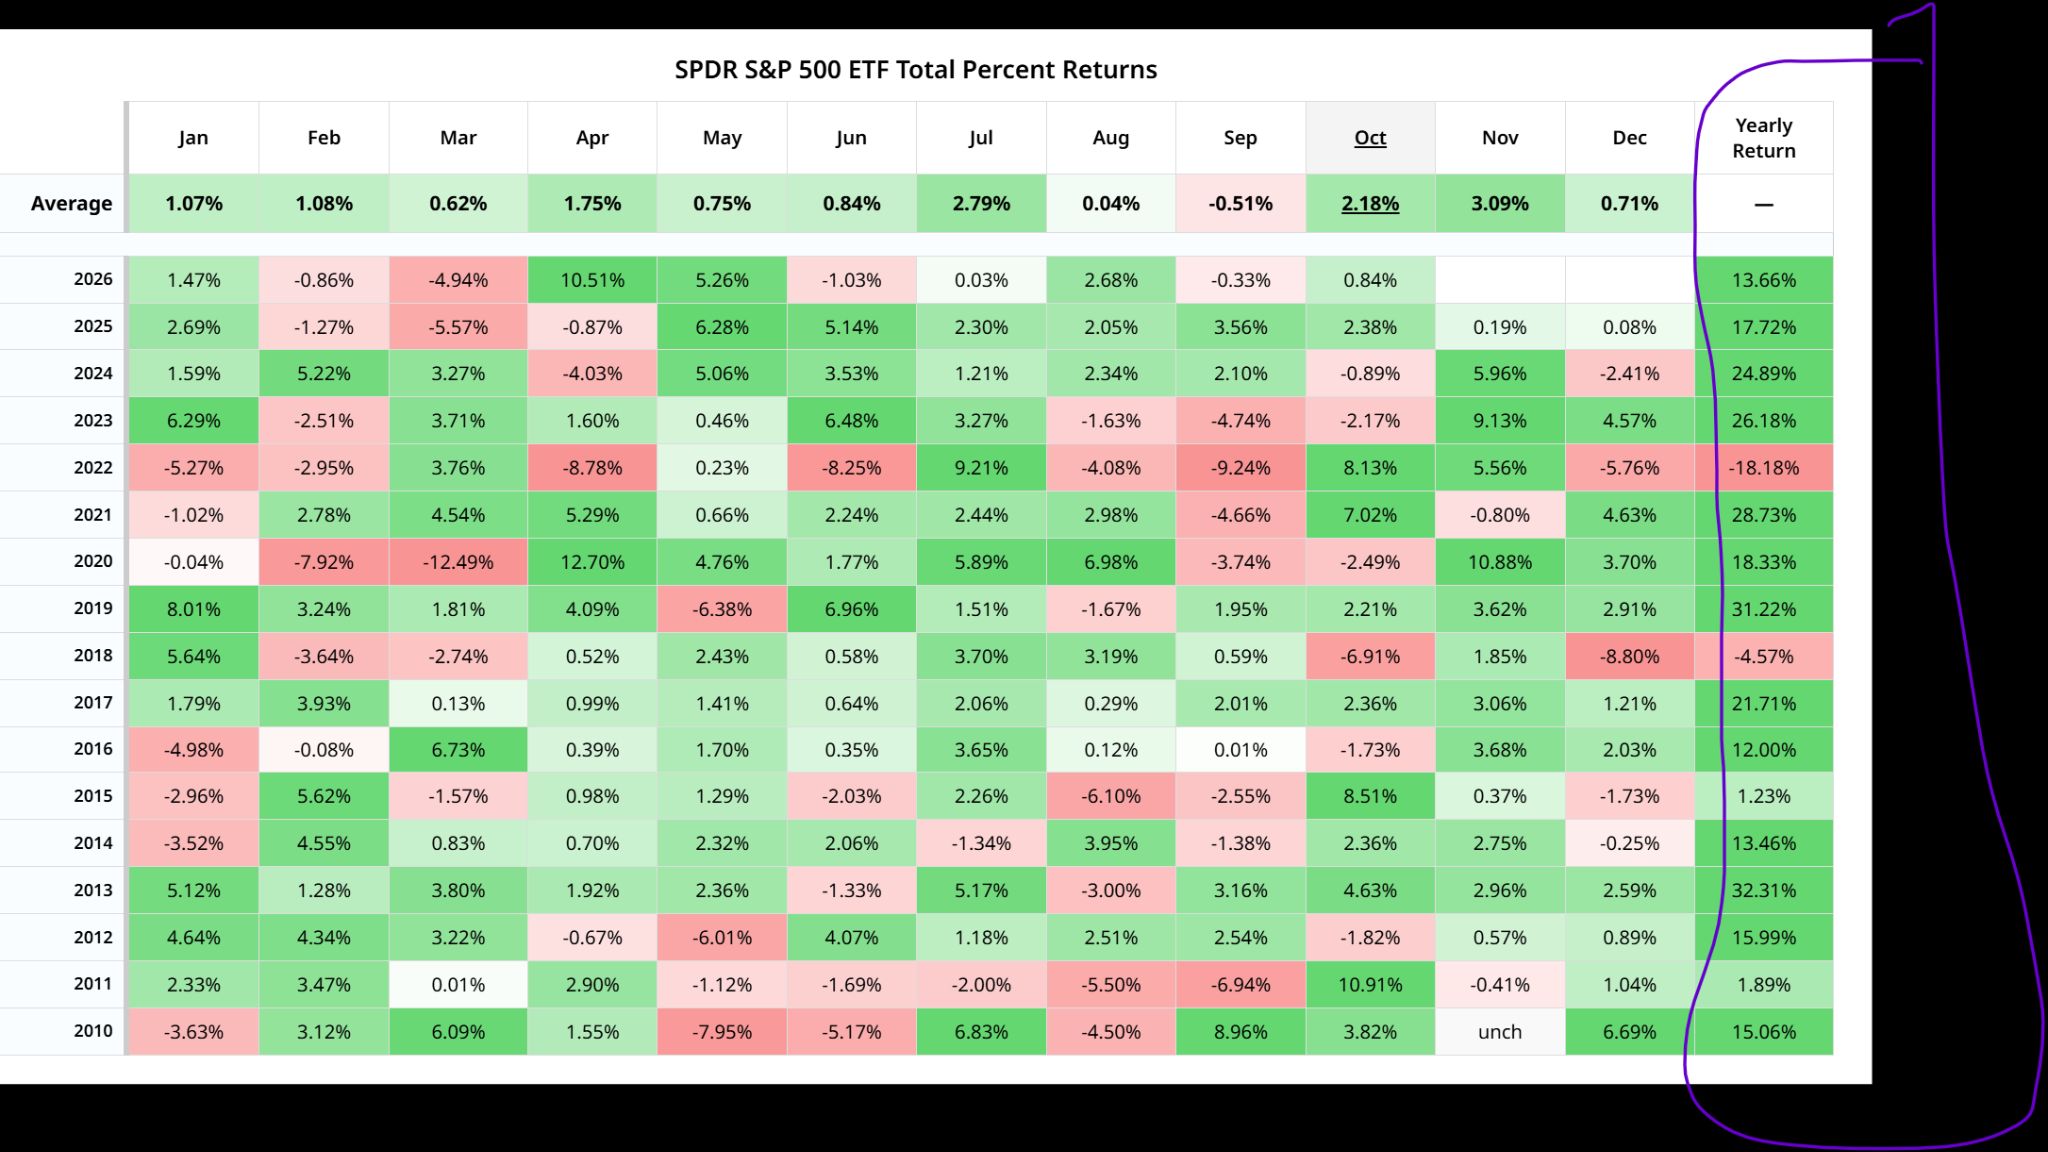
I found that this “guaranteed” return is a lot messier than people may think. With AI dominance driving the S&P 500 Index ($SPX) recently, the market has actually averaged closer to 15% a year over the past five years.
 www.barchart.com
But before that, earlier in the 21st century, it performed far worse than that 8%-10%. This table goes back to 2010. If it went back to 2008, we’d see the S&P 500 hung a -37% return. Go back to 2000-2002, and we’d see three consecutive years of negative returns.
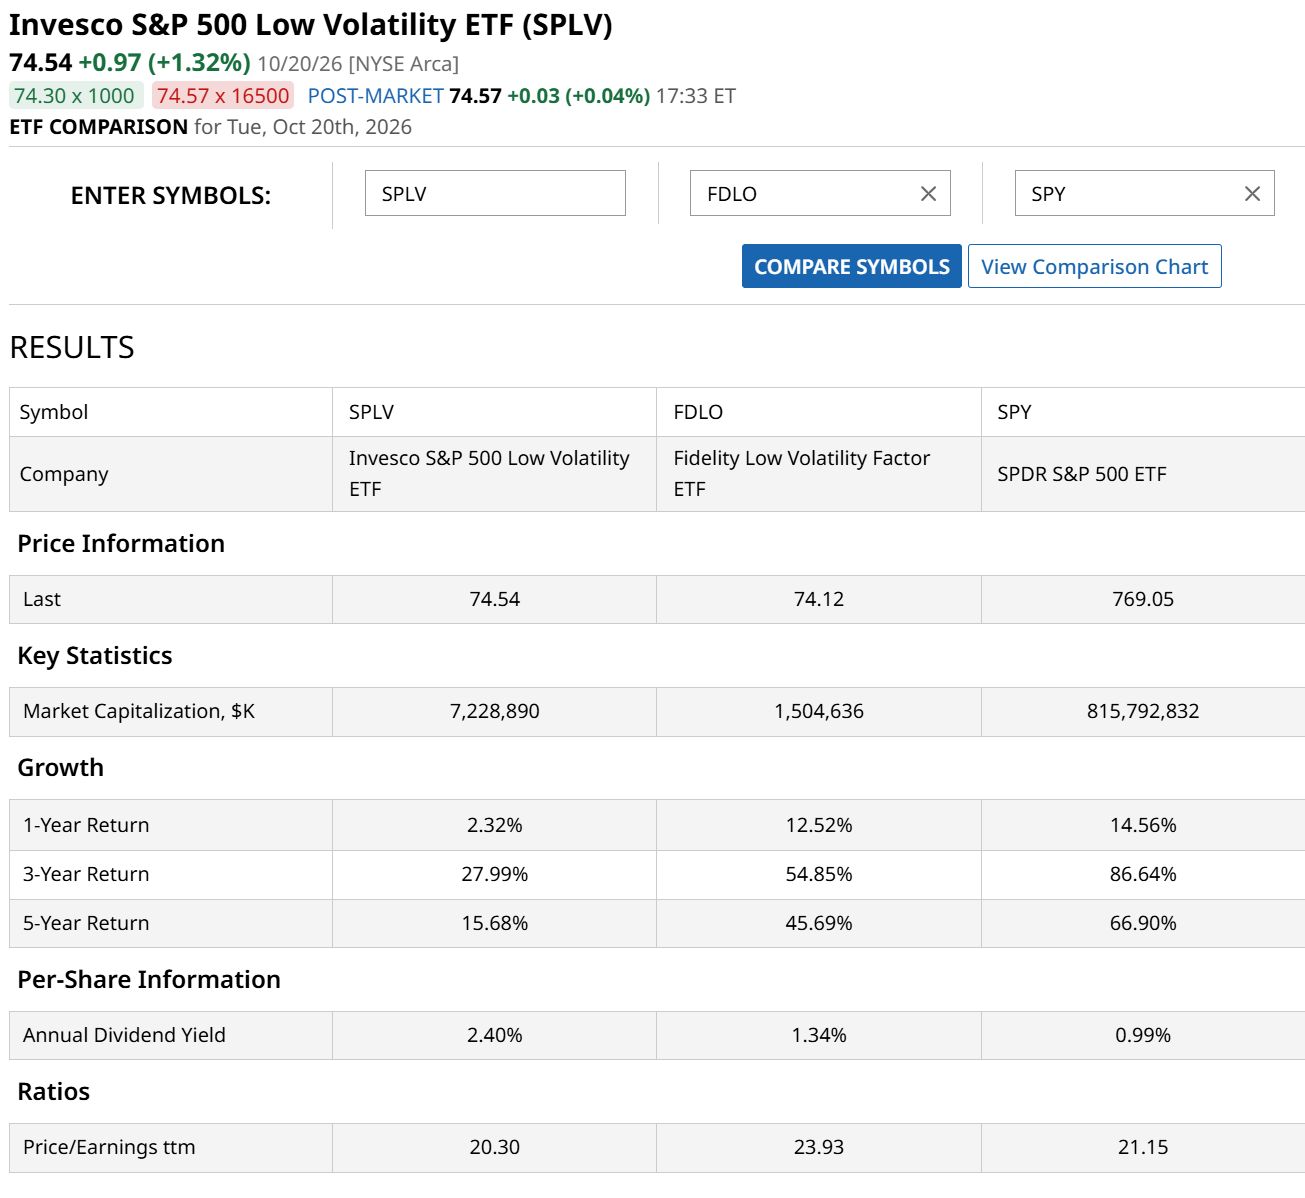
Since we now know that 8%-10% returns across major indexes are not a guarantee, I set out to find the next best thing. I wanted to hunt for stocks within the S&P 500 that have shown a consistent return pattern for several years.
I don’t mean the best 5-year performers, as that can include stocks that went up 400% in six months and did little before and after. I also had no interest in screening for low-volatility stocks for the sake of low volatility.
 www.barchart.com
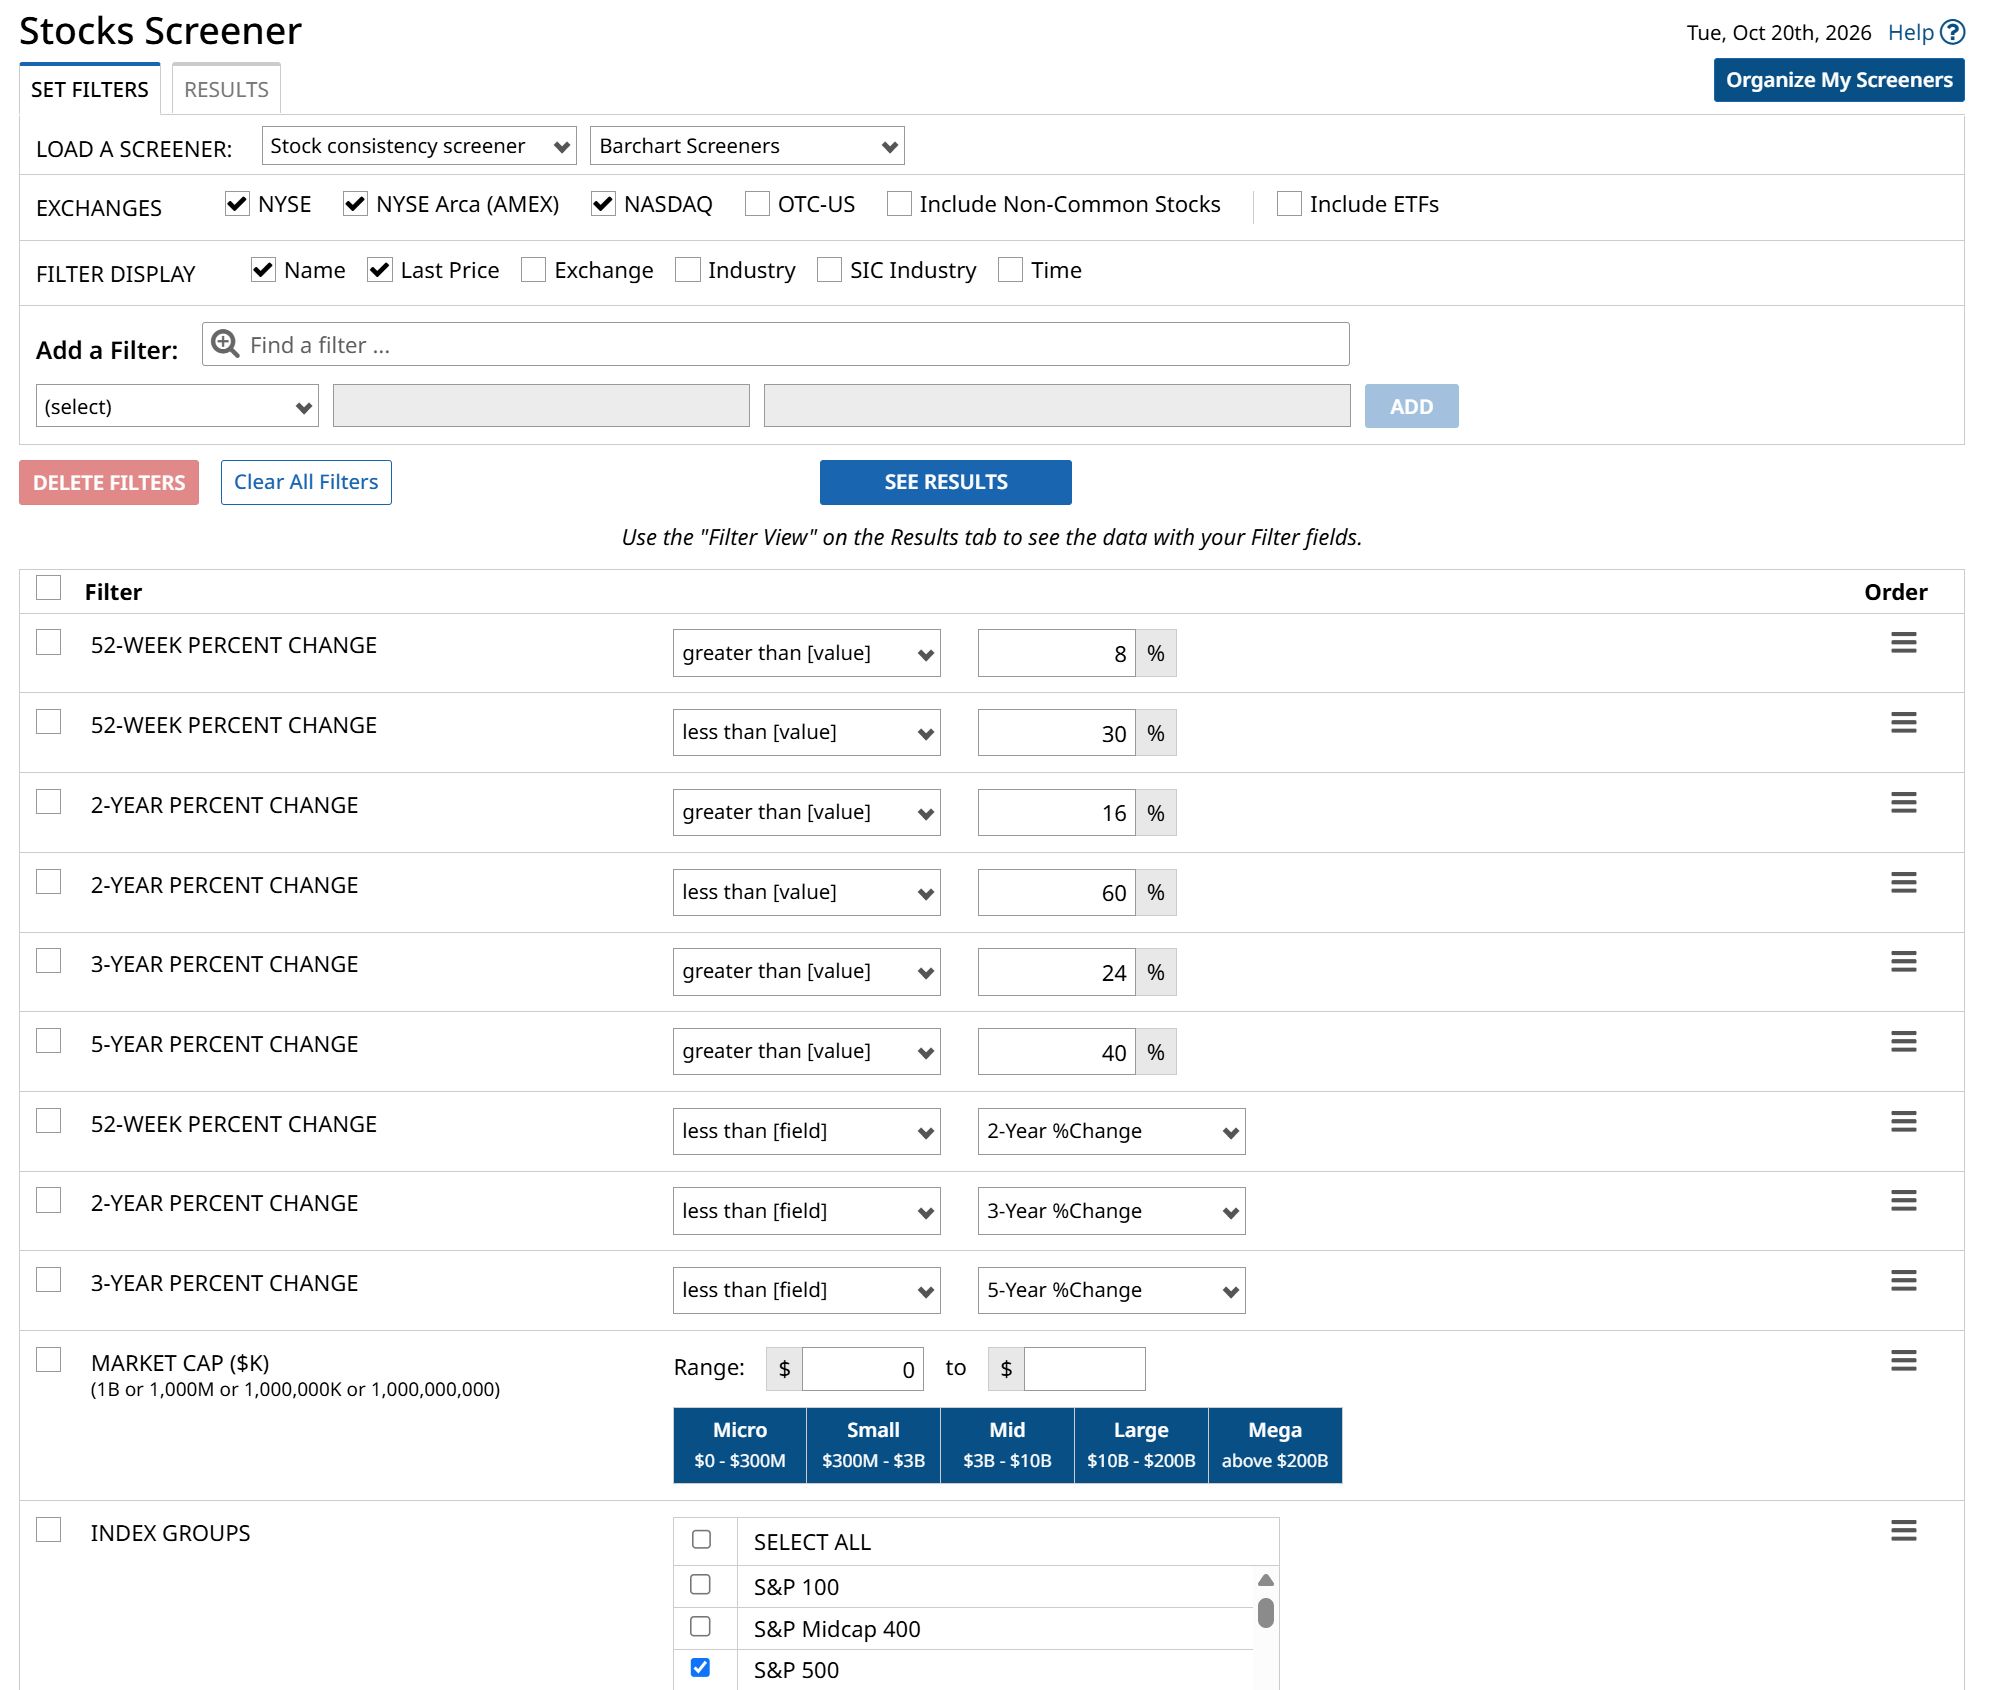
So, here’s what I tried. I set up this screener of S&P 500 stocks. I used these parameters so that a stock had to produce smoother, not specular, returns. That’s why you see minimum returns that average a non-compounded 8% per year for the past five years.
 www.barchart.com
To eliminate the stocks that caught fire recently and in so doing have pumped up their long-term performance numbers, I added another layer to the screener. I capped the shorter-term performance measures (52-week and 2-year), so that we won’t see a 50%-200% near-term gainer here.
And, I added some constraints so that the surviving stocks would be more of an up-the-stairs pattern. Thus, you see that the 52-week (1-year) return must be below the 2-year return, and the same relationship must be true for other successively longer time frames.
Which S&P 500 stocks have been the most consistent performers in recent years?
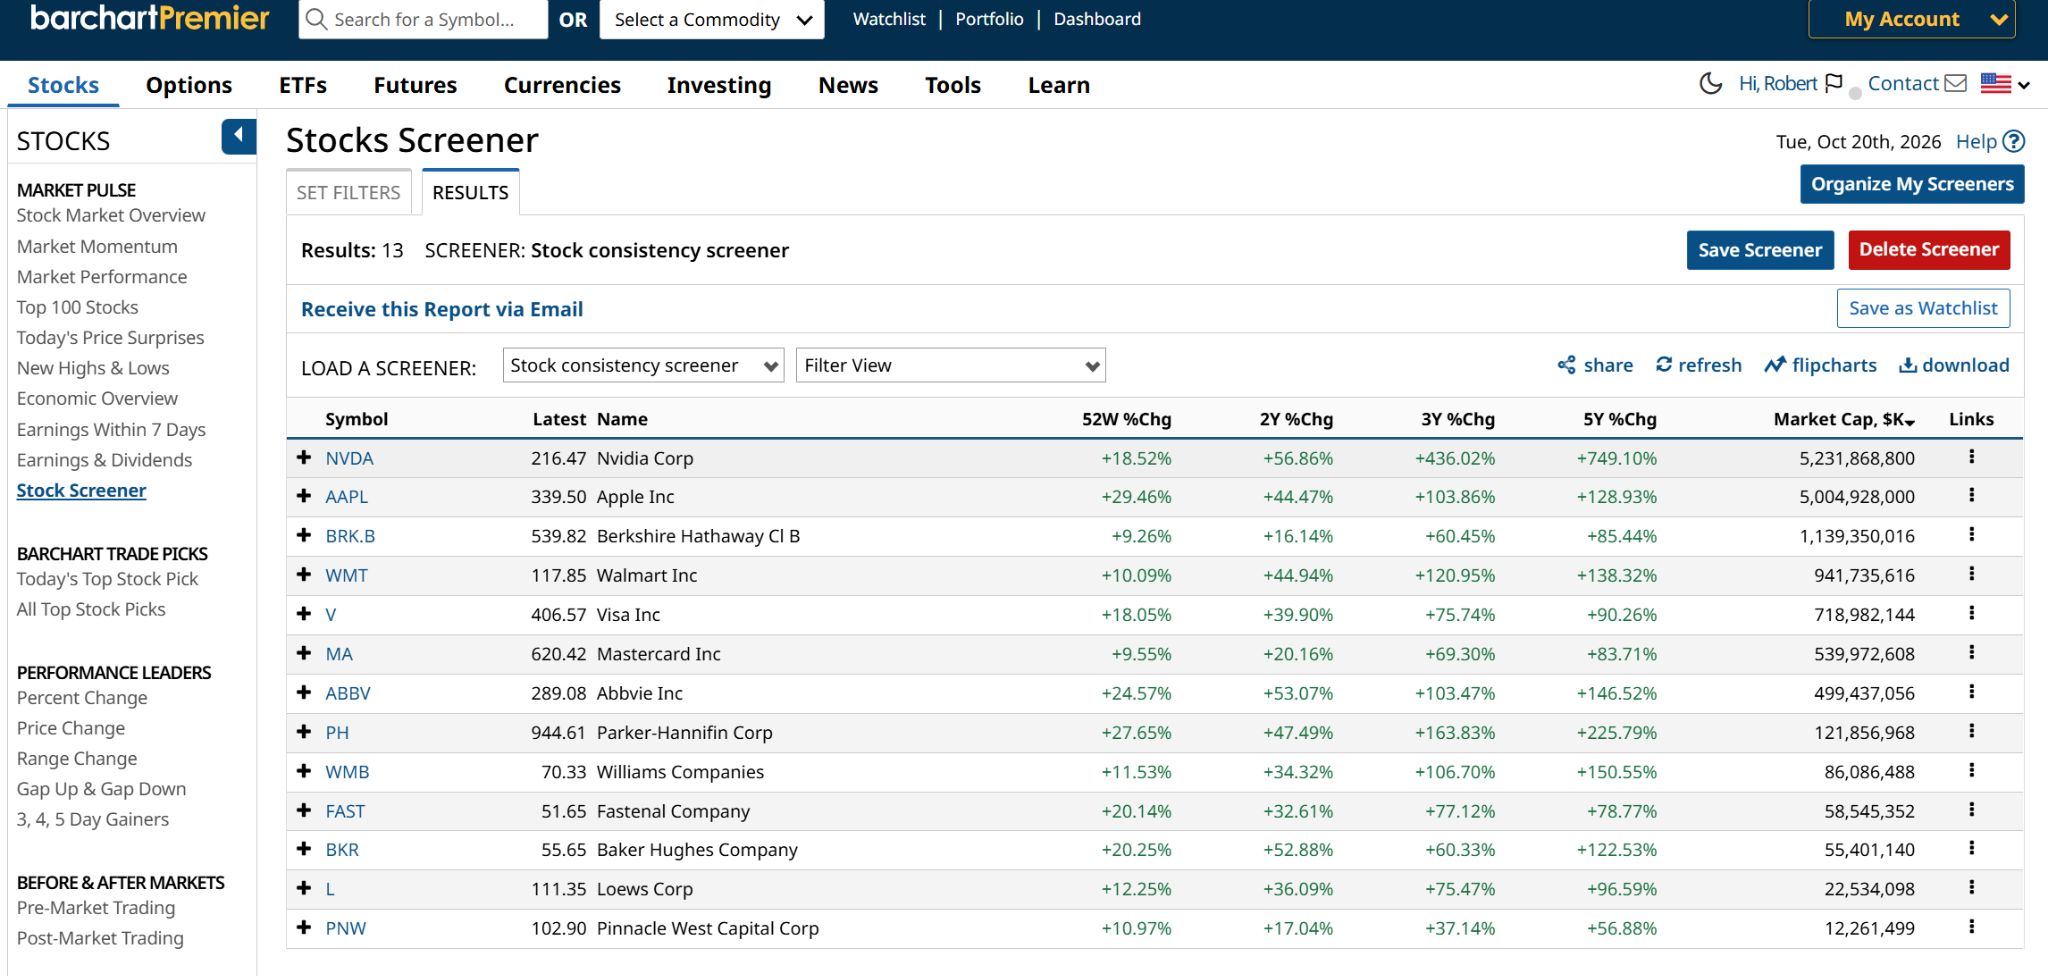
From 500 stocks I ended up with just these 13, sorted in order of their current market capitalization.
 www.barchart.com
What is notable to me is the fairly diverse group of company sizes that appear on the list. I would have suspected that mostly very big stocks would be here, since they all appreciated at least 40% over the past five years. Seven of the 13 names do have market capitalization levels of around $500 billion or more. But there are also four stocks under $60 billion.
As my last step, I wanted to see if any of these look poised to continue upward. If so, as I start to think about creating a set of stocks I can buy and hold one day, I won’t look exclusively at deep-value contrarian names, which is my nature.
I used my favorite Barchart feature, Flipcharts, and here are a few that have monthly charts (long-term view) that have a fighting chance.
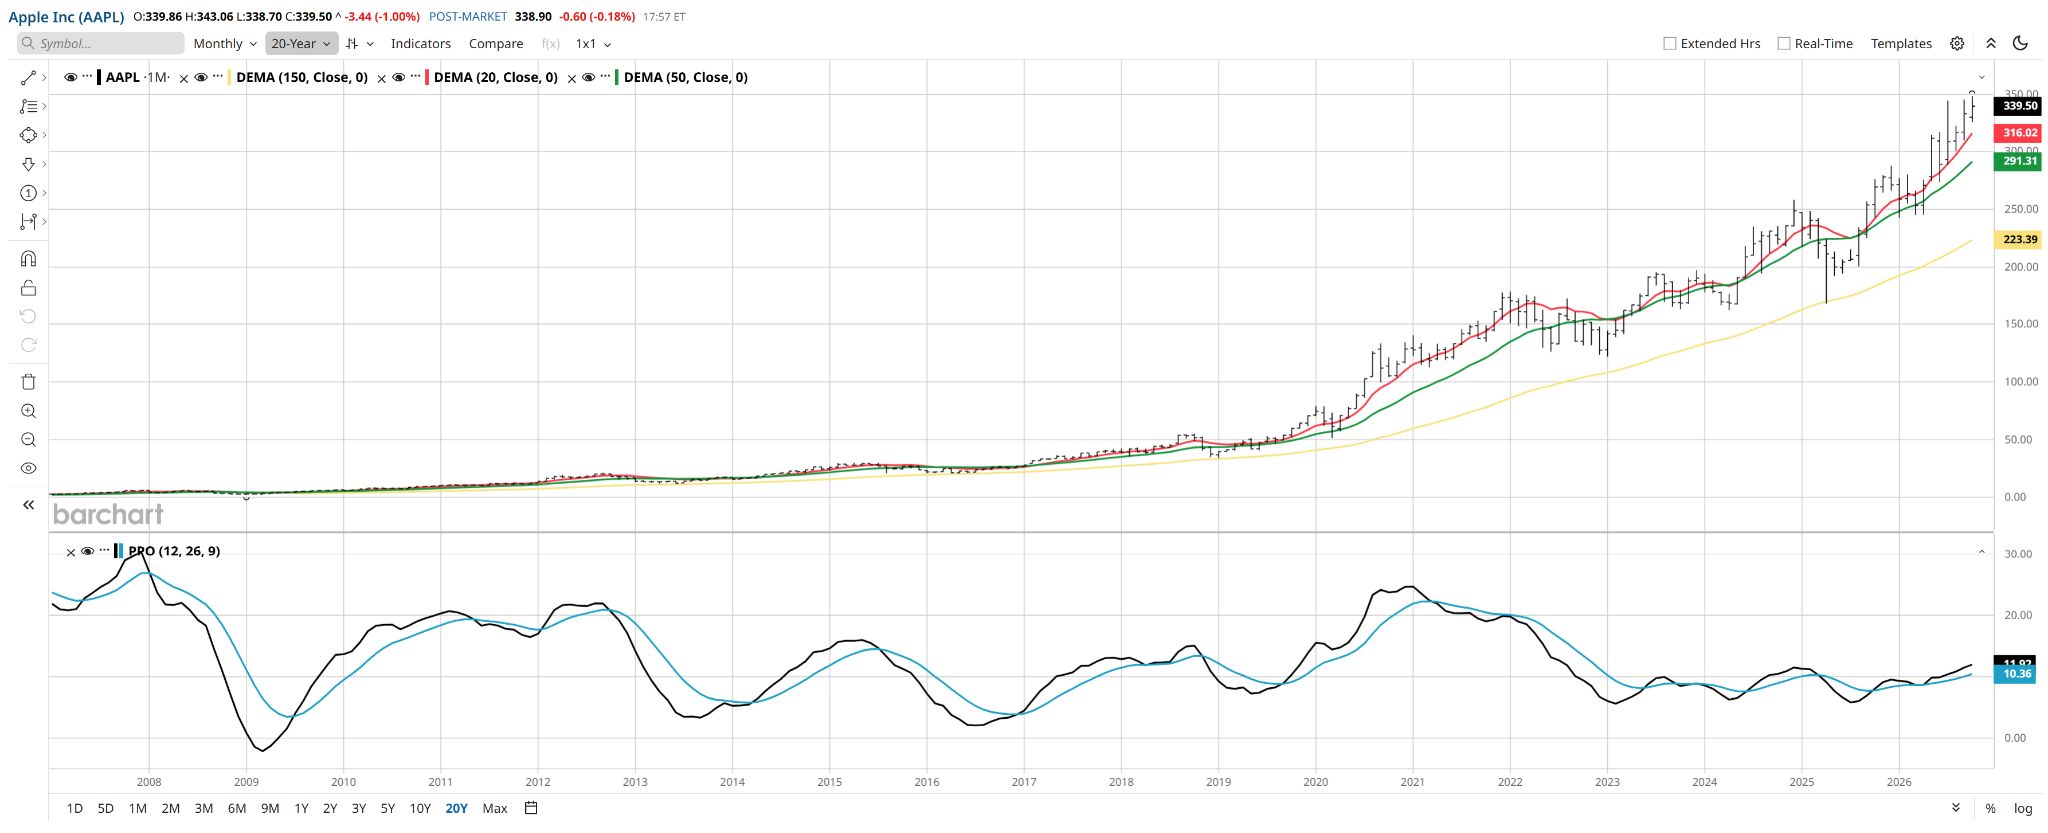
Apple (AAPL): Yes it is already way up, but it’s Apple!. And the monthly percentage price oscillator (PPO) is not topping as it did back in 2025, which was a good long-term warning sign for the stock at that time.
 www.barchart.com
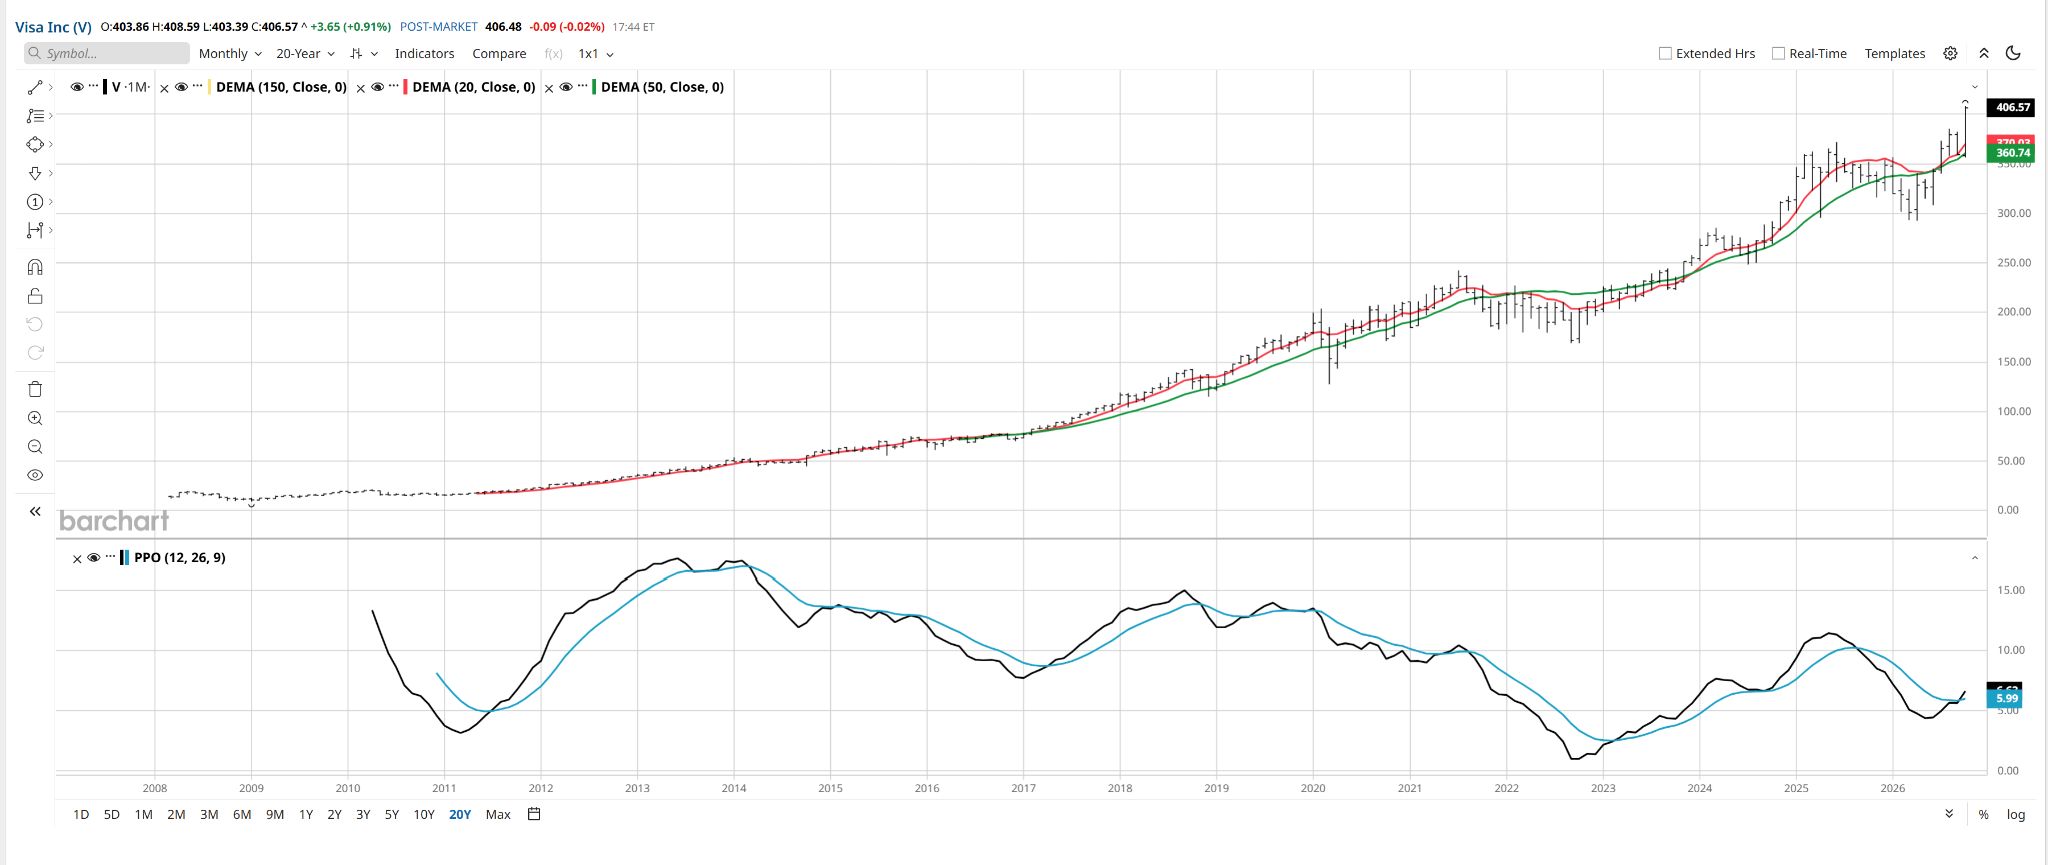
Visa (V) and its financial sector pals look very risky to me near term. But this is a monthly chart and it actually looks pretty good. Not as good as it did when the long-term PPO crossed upward (black line through blue line), but still not bad.
 www.barchart.com
My guesstimate here: if the stock pulled back about 10% and didn’t totally break down, or fell 25% to the $300 area where it has bounced twice already, maybe there’s a long-term buy here. That might also be telling us that while rates may still head higher, we are getting closer to a long-term bond rate peak.
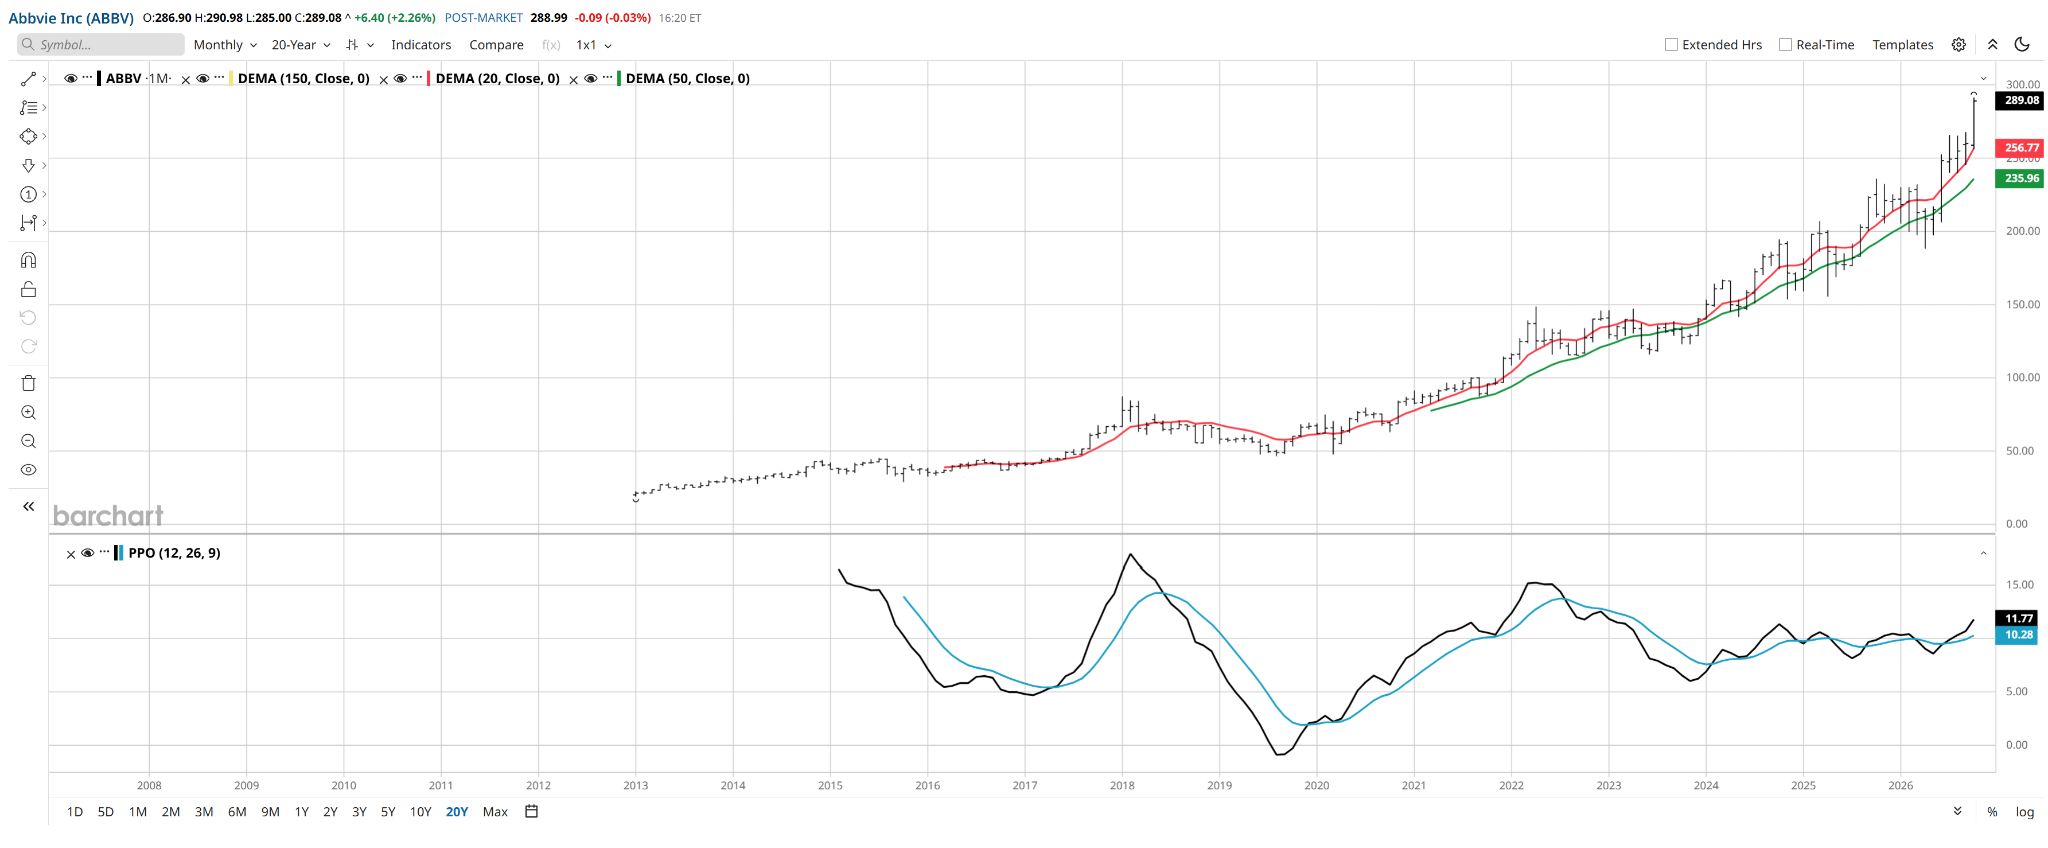
Finally AbbVie (ABBV) looks a lot like AAPL, pattern-wise. And as with all of these, there’s an “up and to the right” look to the charts, which might signal there’s core institutional long-term demand here.
 www.barchart.com
I’m glad I finally did this. Albeit more than nine months later than I hoped. And now that I’m getting more proficient in using the very efficient and productive Barchart.com stock screener, I’ll be dreaming up many more tests to try to pinpoint ideas. And to bust a few market myths along the way.
Rob Isbitts is a semi-retired CIO, former fiduciary investment advisor, Barchart columnist, and straight-talker. Download his new free e-book on hedged bond investing for retirement at ETFYourself.com. His research and model portfolios are at ROAR.PiTrade.com.
On the date of publication, Rob Isbitts did not have (either directly or indirectly) positions in any of the securities mentioned in this article. All information and data in this article is solely for informational purposes. For more information please view the Barchart Disclosure Policy here.
More news from Barchart
Dear Spotify Stock Fans, Mark Your Calendars for October 22 Billionaire Bill Ackman Says Netflix Told Him 'We're Never Going to Do It' on Ads, Then Announced an Ad Model 'Literally 3 Weeks' Later Costing Him $400 Million The 13 Best S&P 500 Stocks to Buy Now, According to Barchart’s Screeners Nvidia Rumors Just Gave Ambarella Stock a Big Boost