


Reportedly, Morgan Stanley is expecting the S&P 500 to be between 4,000 and 10,000 during 2027.
In other news, the S&P 500 looks to have moved into a long-term downtrend at the end of October, with the extended selloff during November putting the Index within sight of its previous 4-month low .
Don’t Miss a Day: From crude oil to coffee, sign up free for Barchart’s best-in-class commodity analysis.
Applying Morgan Stanley's math to the Grains sector, and the 2027 outlook is - well - unclear is a safe word to use.
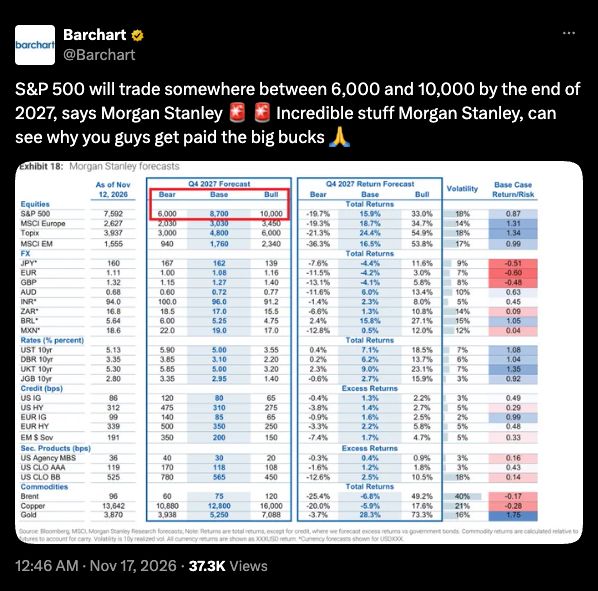
Morning Summary: Barchart, on one of its social media pages, posted an outlook from Morgan Stanley that told us the S&P 500 ($INX) will trade between 6,000 and 10,000 by the end of 2027. As the social media person at Barchart said, “Incredible stuff Morgan Stanley, can see why you guys get paid the big bucks”. She was absolutely correct. Morgan Stanley is projecting the S&P 500 should be somewhere in a 4,000-point range over the next year. Given the Index closed Monday at 7,416, we are talking somewhere between 19% lower and 35% higher by the end of 2027. What a good call. The rest of us can sleep easy for the next 13 months. As I’ve talked about in Monthly Analysis, from a technical point of view the Index moved into a long-term downtrend at the end of October and has since extended its selloff to a low of 7,350 during November. A technical number to keep in mind is the previous 4-month low of 7,313, with a move below that mark this month possible triggering another round of selling. Could it happen today? Asian markets closed lower nearly across the board with the Nikkei down 1.3%. European markets are also lower at midday. Both raise the Chicken or the Egg Debate[i] once again.
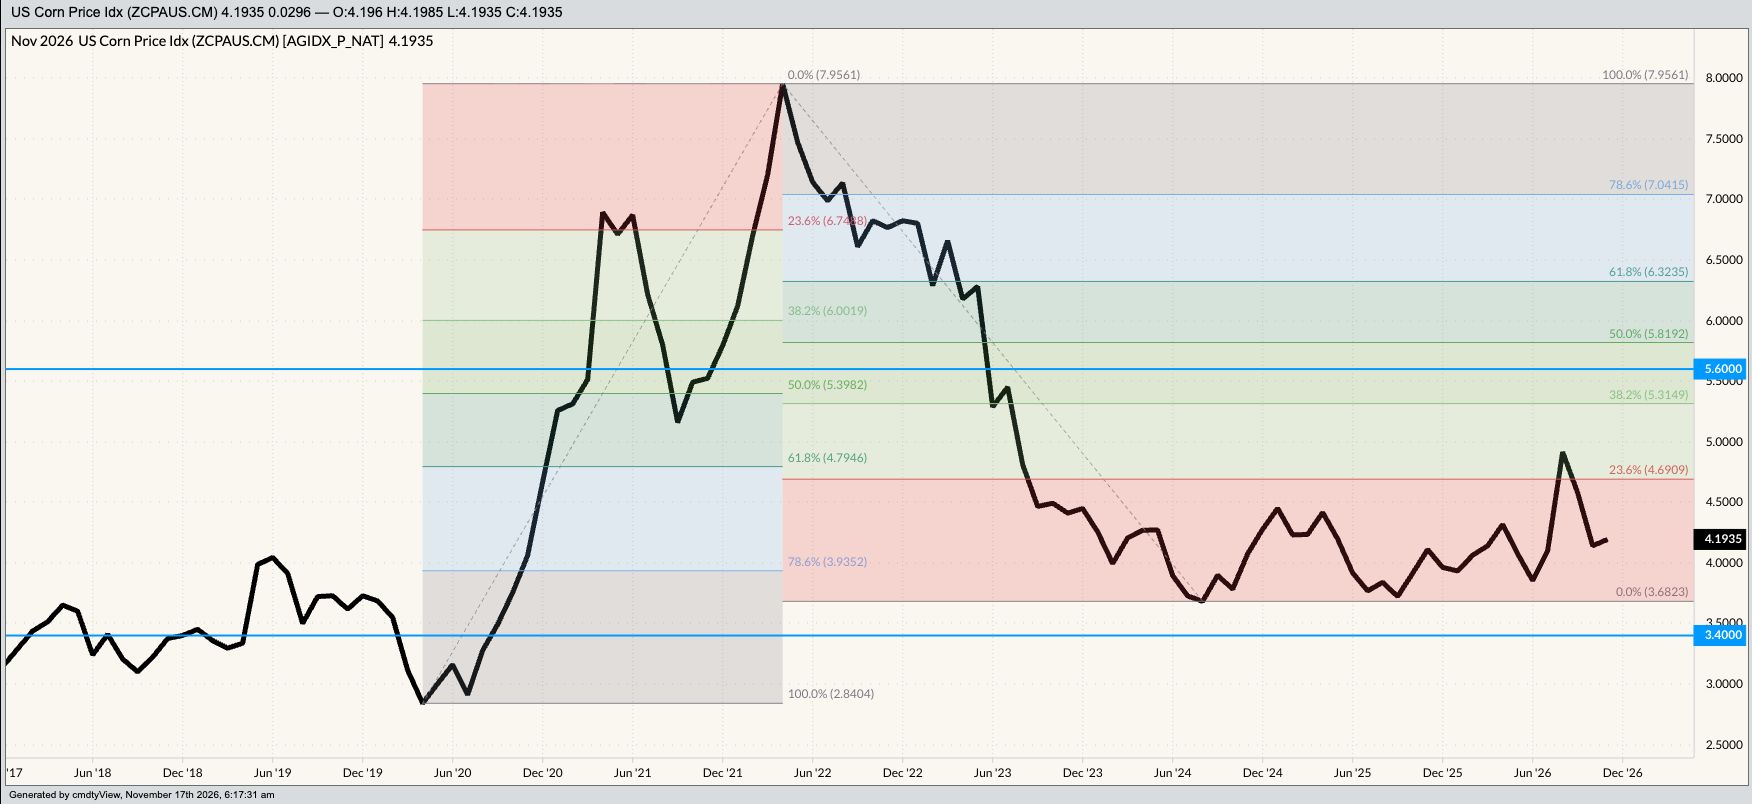
Corn: If we apply the brilliance of Morgan Stanley to the corn market, what do we have to look forward to during 2027? Let’s start by determining what to use as a beginning value. Historically, I’ve relied on the National Cash Indexes as intrinsic values of the market, as part of the economic Law of Supply and Demand[ii] and the Unknown Variable Solution[iii], though the accuracy of these Indexes has been called into question during 2026[iv]. But let’s set that aside for a moment and use Monday’s calculation (ZCPAUS.CM) near $4.17 as a starting point. A loss of 19% takes the Index down to roughly $3.38 while an increase of 35% projects a high-end of $5.63. Given we are talking about corn, a market with a characteristic Round Number Reliance[v], we can make the range for 2027 roughly between $3.40 and $5.60. As for early Tuesday morning, the market saw follow-through buying from Monday with December adding as much as 3.75 cents while March gained as much as 3.25 cents. Trade volume was moderate at roughly 40,000 contracts and 35,000 contracts respectively. National average basis firmed to 31.5 cents under December futures as compared to last Friday’s final figure of 32.0 cents under December.
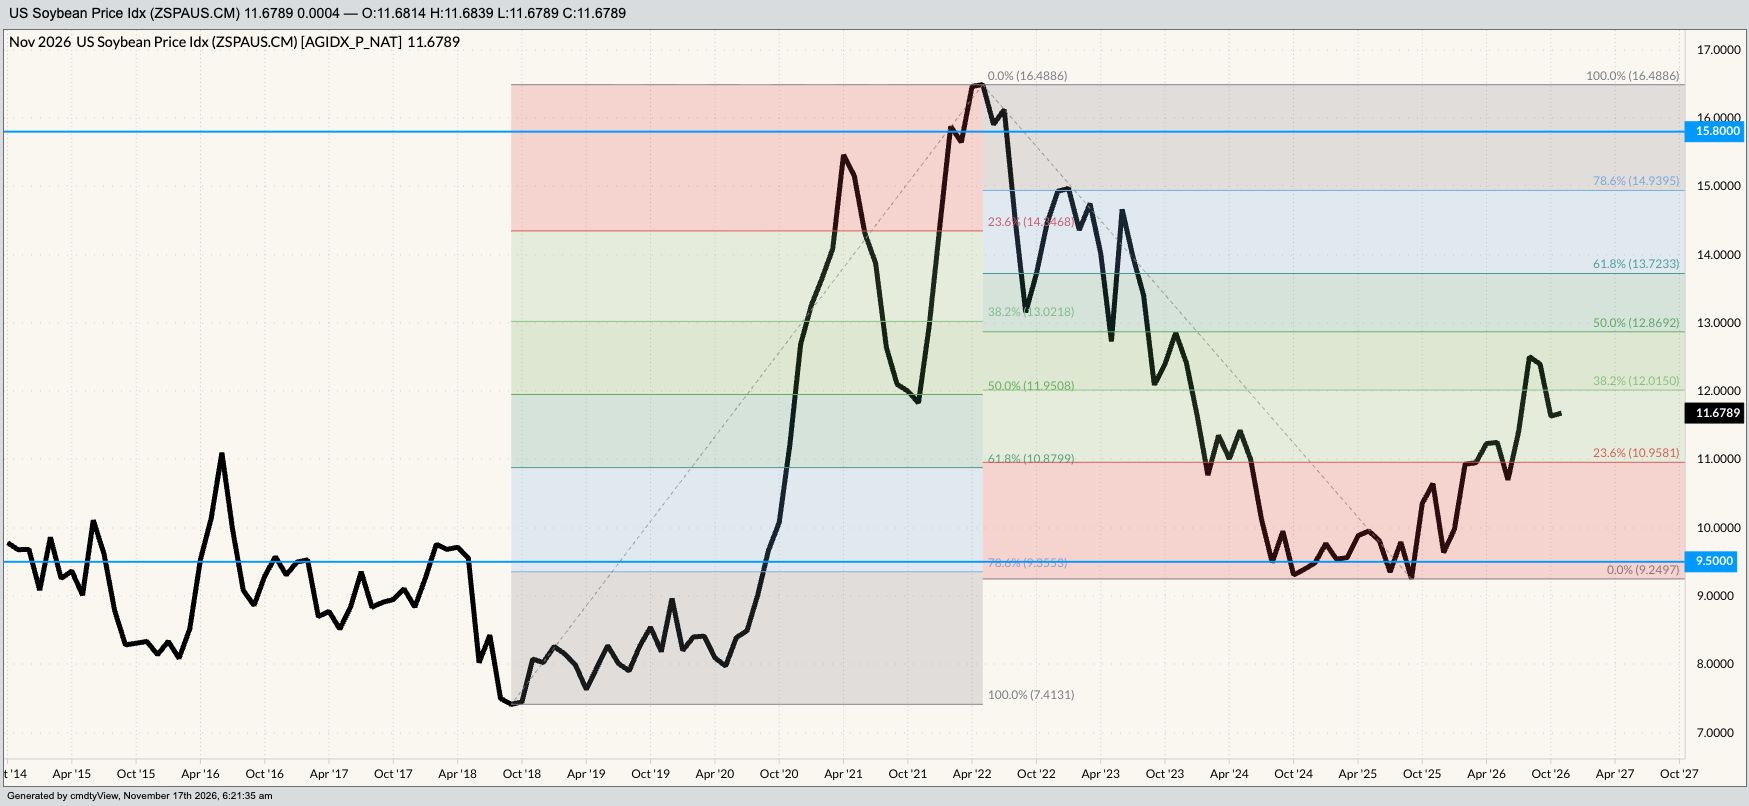
Soybeans: We’ll keep this fun game rolling with a look at the soybean market. The National Soybean Index (ZSPAUS.CM) came in near $11.70 Monday night, putting the 2027 range between roughly $9.50 and $15.80. What’s $6.30 between friends? Pinpoint accuracy, if I do say so myself. With a month left in 2026, and another meeting between the US president and his counterpart from China scheduled for this week, I can make a strong argument for either extreme of the 2027 range. On the downside, the 2027 November soybean futures contract continues to run strong versus the 2027 December corn contract, hinting at more acres of soybeans planted in the US next spring. Given 2026-27 futures spreads remain bullish, this seems like a good response to the market (Rule #2[vi]). However, if the US increases its planted area and Mother Nature plays nice, increasing total supplies once again, and global demand for those supplies doesn’t follow along, then the market could come tumbling down. On the other hand, if the two presidents decide to kiss and make up this week, then demand could improve next year. We’ll see. Early Tuesday finds the futures market quietly lower with January and March both down 2.0 cents at this writing.
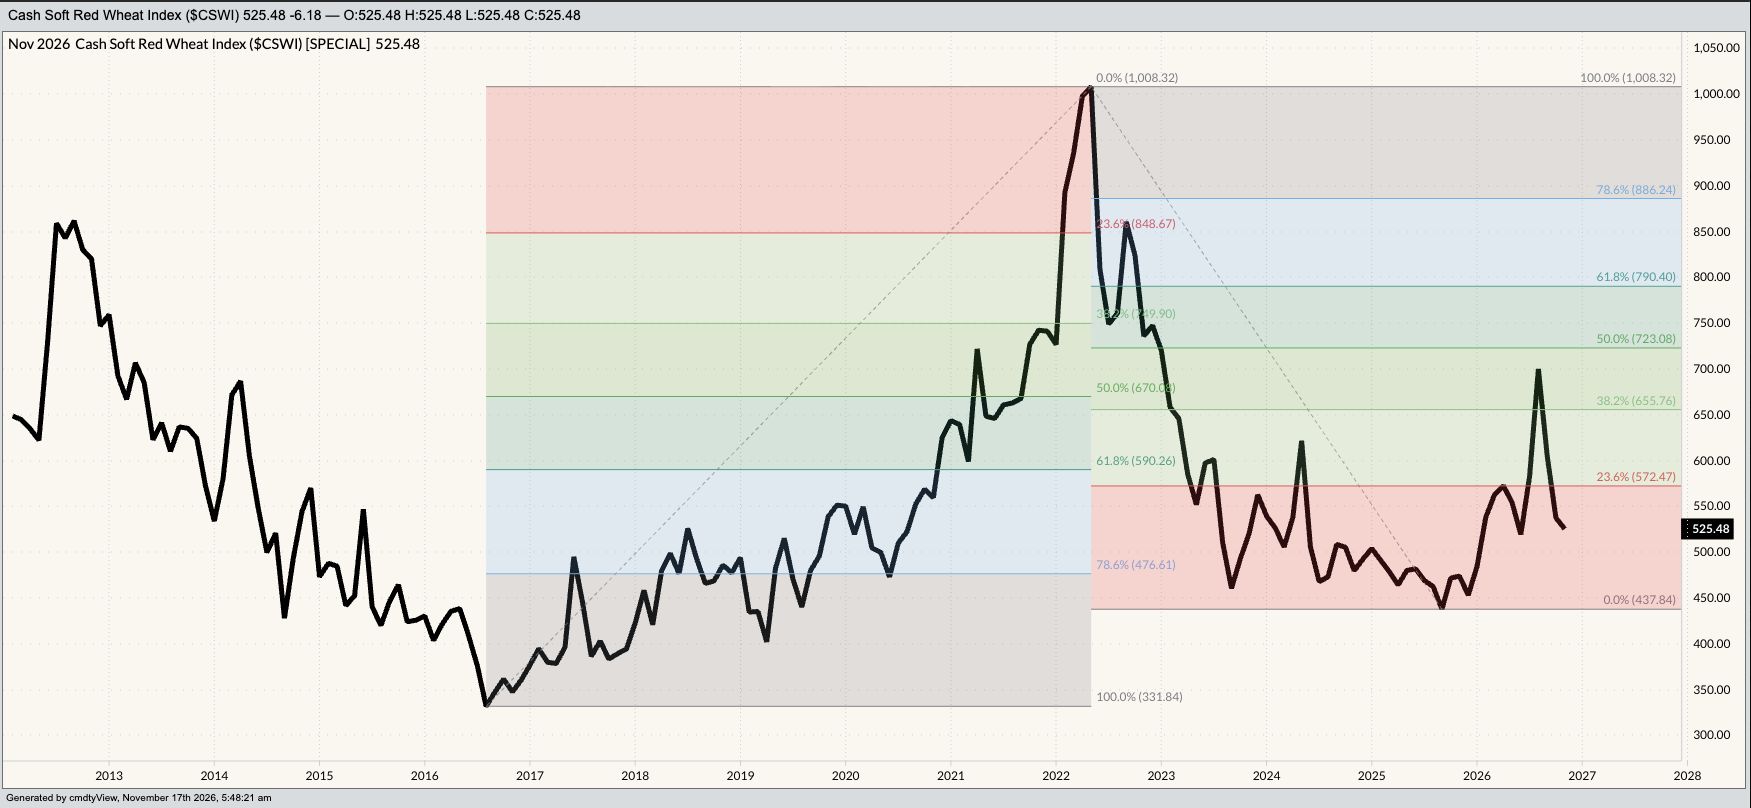
Wheat: Last, but certainly not least, we have wheat ready to join the outlook game. For this discussion, I’ll use the National SRW Index given the underlying futures market is the more heavily traded. (In the US, SRW is the third largest wheat class produced behind HRW and HRS. And according to USDA, so we know it is accurate, white wheat is coming up fast on SRW for third place.) Here we see the Index was calculated near $5.25 Monday night, putting the 2027 range between (drumroll please) $4.25 and $7.10. Hmm…A look at the Index’s monthly close only chart (slide 5) and we see that is basically what it has done over the past year (plus a few months). The Index has a low near $4.40 (from September 2025) and a high monthly close of $7.00 from this past August. Not to get too technical, or graphic, but if we let our minds wander we can imagine we see a possible head and shoulder top forming, or maybe some other type of salute. As for Tuesday morning, all three futures markets are in the green on decent overnight trade volume. The latest Commitments of Traders report showed Watson decreased its net-short SRW futures position.
[i] Do global stock markets lead or follow US stock markets.
[ii] Market price/intrinsic value is where the supply and demand curves intersect.
[iii] Since we don’t know real supply and/or demand numbers, we can solve for stocks-to-use by using the intrinsic value of the market over time.
[iv] I discussed this in an interview I did with Roger Ward of WLDS Radio Monday.
[v] Corn tends to move from round number to round number.
[vi] Let the market dictate our actions.
On the date of publication, Darin Newsom did not directly have a position in any of the securities mentioned in this article. All information and data in this article is solely for informational purposes. For more information please view the Barchart Disclosure Policy here.