


Bitcoin (BTC) closed below its 50-day simple moving average (SMA) for the first time since August. Meanwhile, Bitcoin volatility keeps compressing ahead of the weekend.
Liquidation clusters, rising leverage, and fresh ETF outflows suggest the month-long range could break soon. Overall, the data tilts toward the downside.
Bitcoin Volatility: The Lose of 50-Day SMA
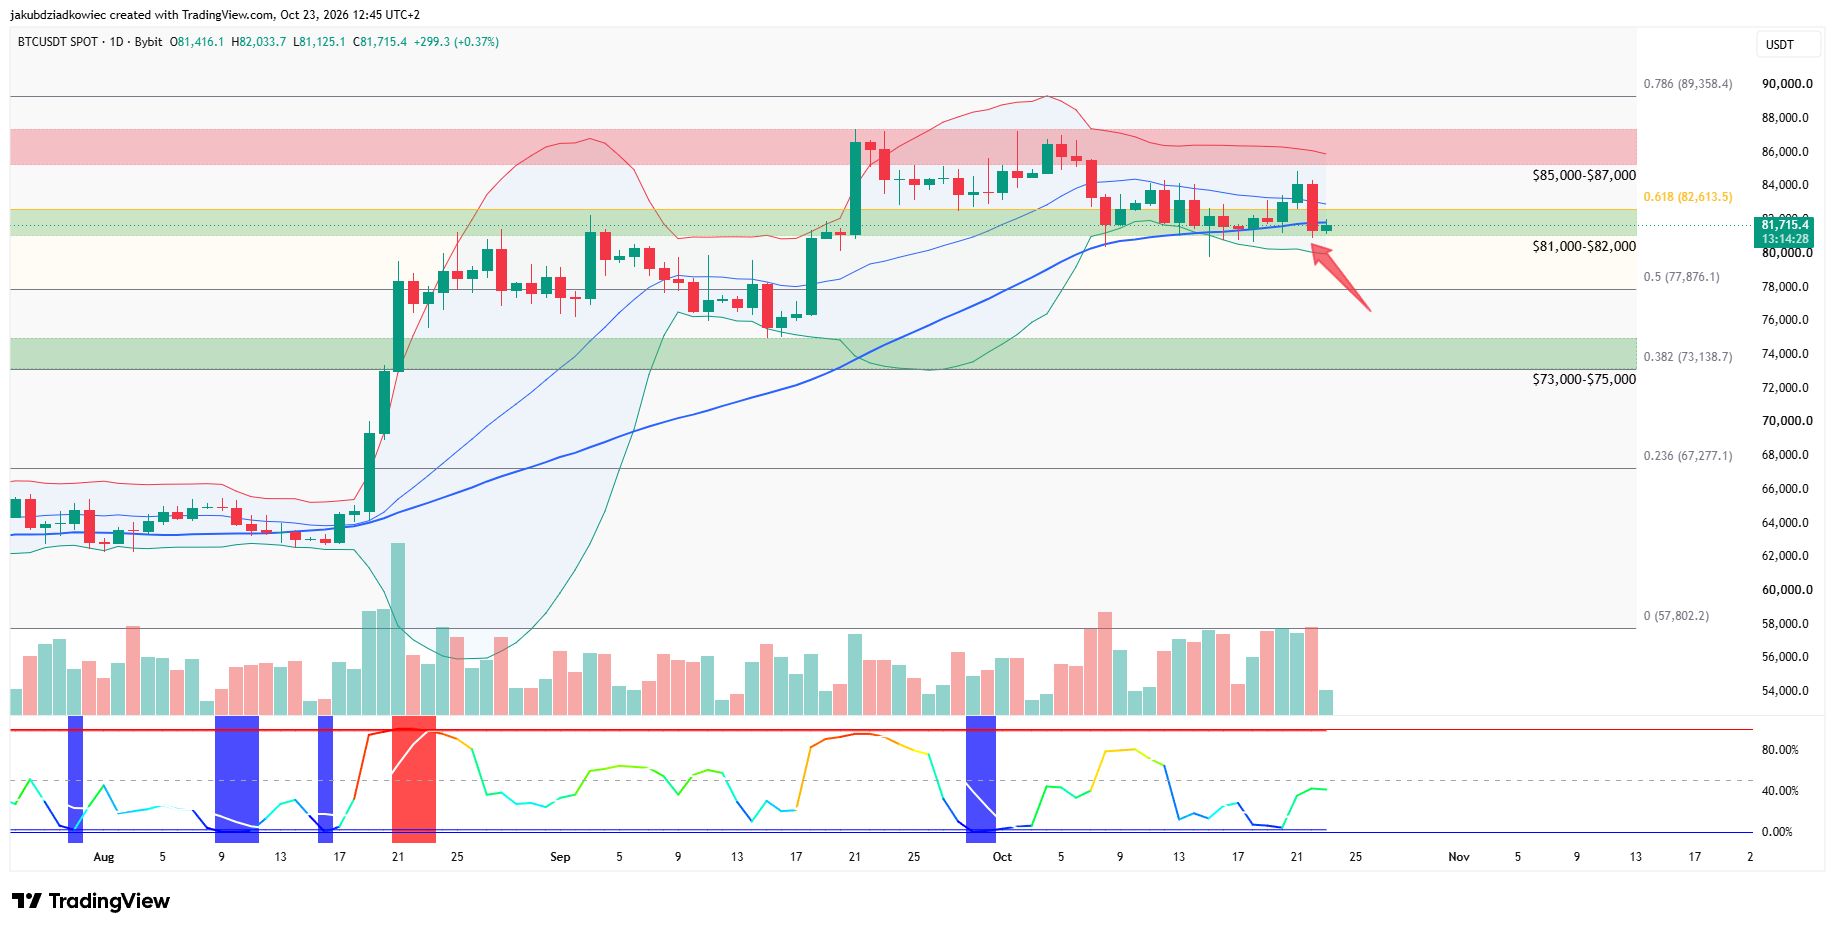
Bitcoin trades at $81,715, down 0.39% over the past 24 hours. On the daily chart, BTC lost the 50-day SMA (red arrow) after another rejection near $85,000.
The breakdown ends a month of choppy trade between roughly $81,000 and $85,000. During that period, sharp swings liquidated both longs and shorts without establishing a trend.
The Oct. 22 candle printed one of the heaviest selling volumes of the month. As a result, the 0.618 Fibonacci retracement at $82,614 now acts as resistance.
 BTC daily chart / Source: Tradingview
At the same time, the Bollinger Bands have narrowed to roughly $6,000 wide. In contrast, they spanned about $30,000 during the August expansion.
Earlier this week, the bands hit their tightest reading in about 2.5 years. Historically, such compression precedes a sharp expansion in volatility.
However, Bollinger Bands do not reveal direction on their own. The loss of the 50-day SMA therefore tilts the odds lower.
Liquidation Clusters Set Up the Weekend Move
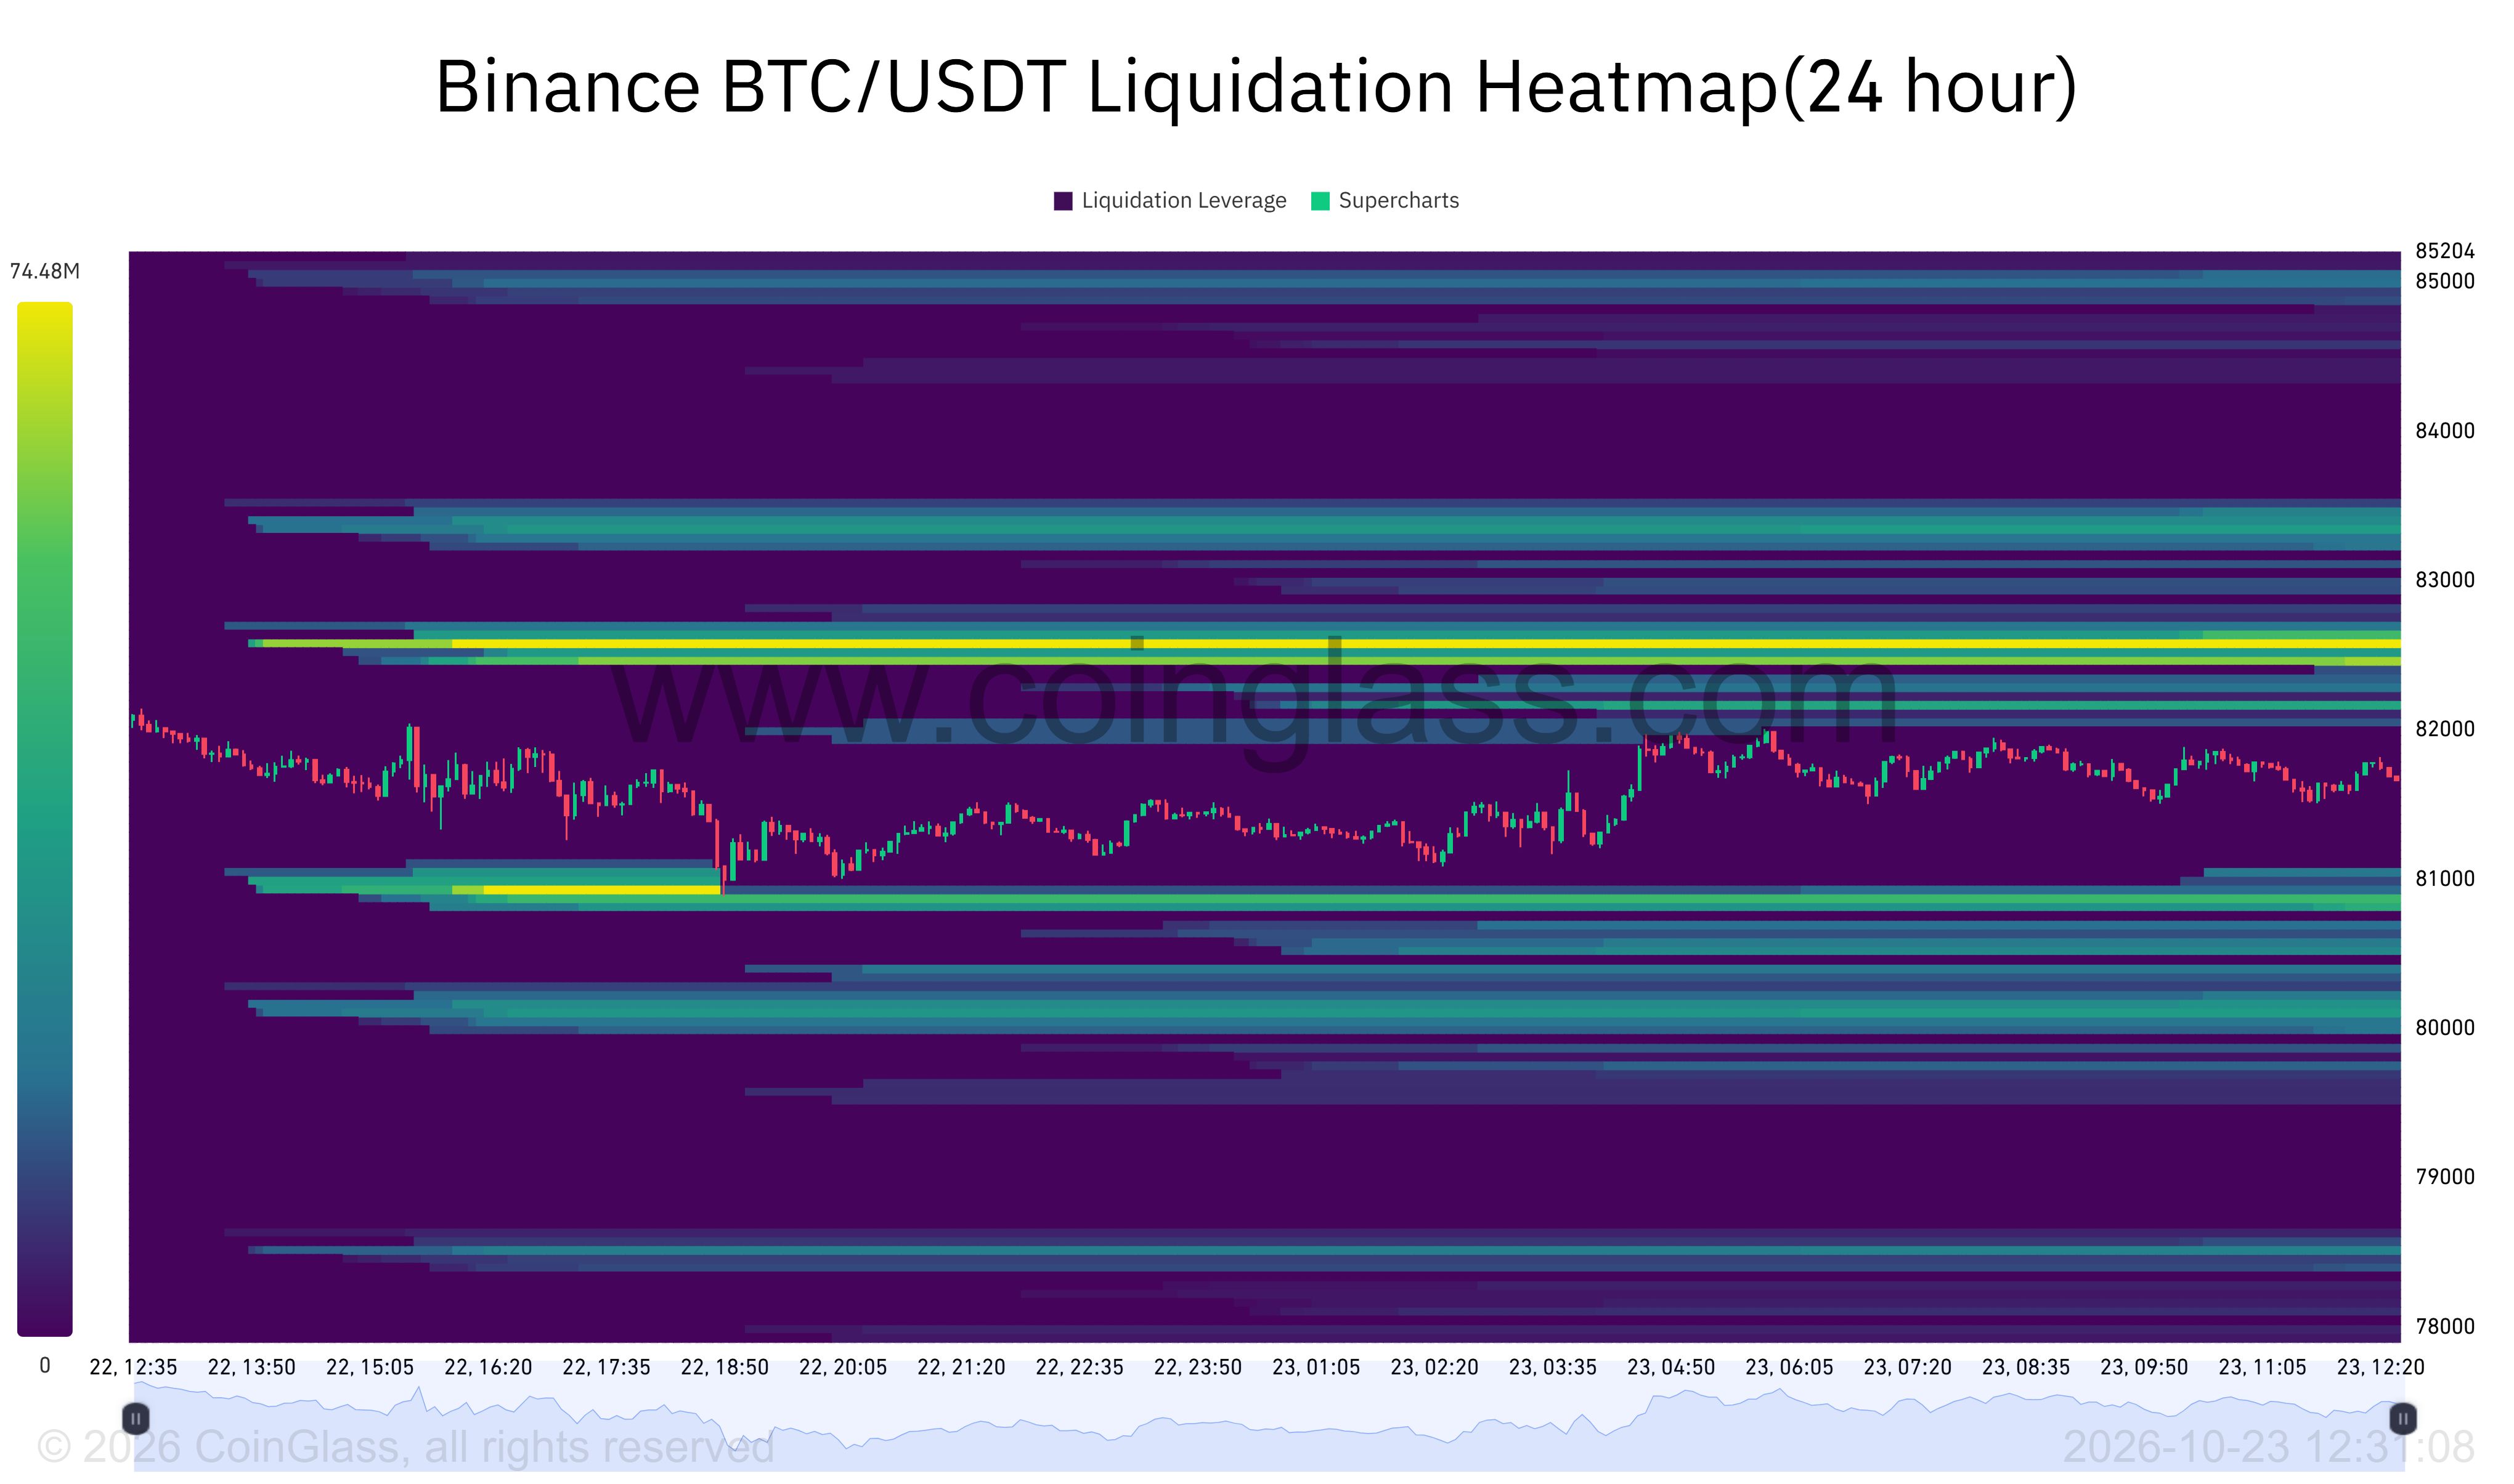
Coinglass data shows the largest liquidation pool on Binance sits between $82,500 and $82,650. That cluster lies about 1% above the price and overlaps the 0.618 Fibonacci level.
Below, leveraged positions cluster near $80,850 and again around $80,000. Earlier this month, BTC slid toward $80,400 as over $1 billion in positions were liquidated.
 Bitcoin volatility and Binance liquidation heatmap / Source: Coinglass
Binance accounts for about 20% of total open interest, so the map captures only part of the market. Still, these clusters mark levels where forced orders could accelerate a move.
Leverage also keeps building inside the range. Open interest stands at $54.09 billion, while OI-weighted funding remains positive at 0.0068%. Longs are still paying to hold their positions.
Funding has cooled from roughly 0.010% earlier this week, suggesting some excess leverage already cleared. Even so, positioning has not flipped to the short side that usually fuels a sustained squeeze.
This setup could favor a quick sweep toward $82,600, followed by a flush of late longs. The weekend may amplify that move.
CME futures, holding $9.36 billion in open interest, close for the weekend alongside US spot ETFs. Offshore perpetual markets with thinner liquidity will set the price instead.
ETF Outflows Tilt the Odds Lower
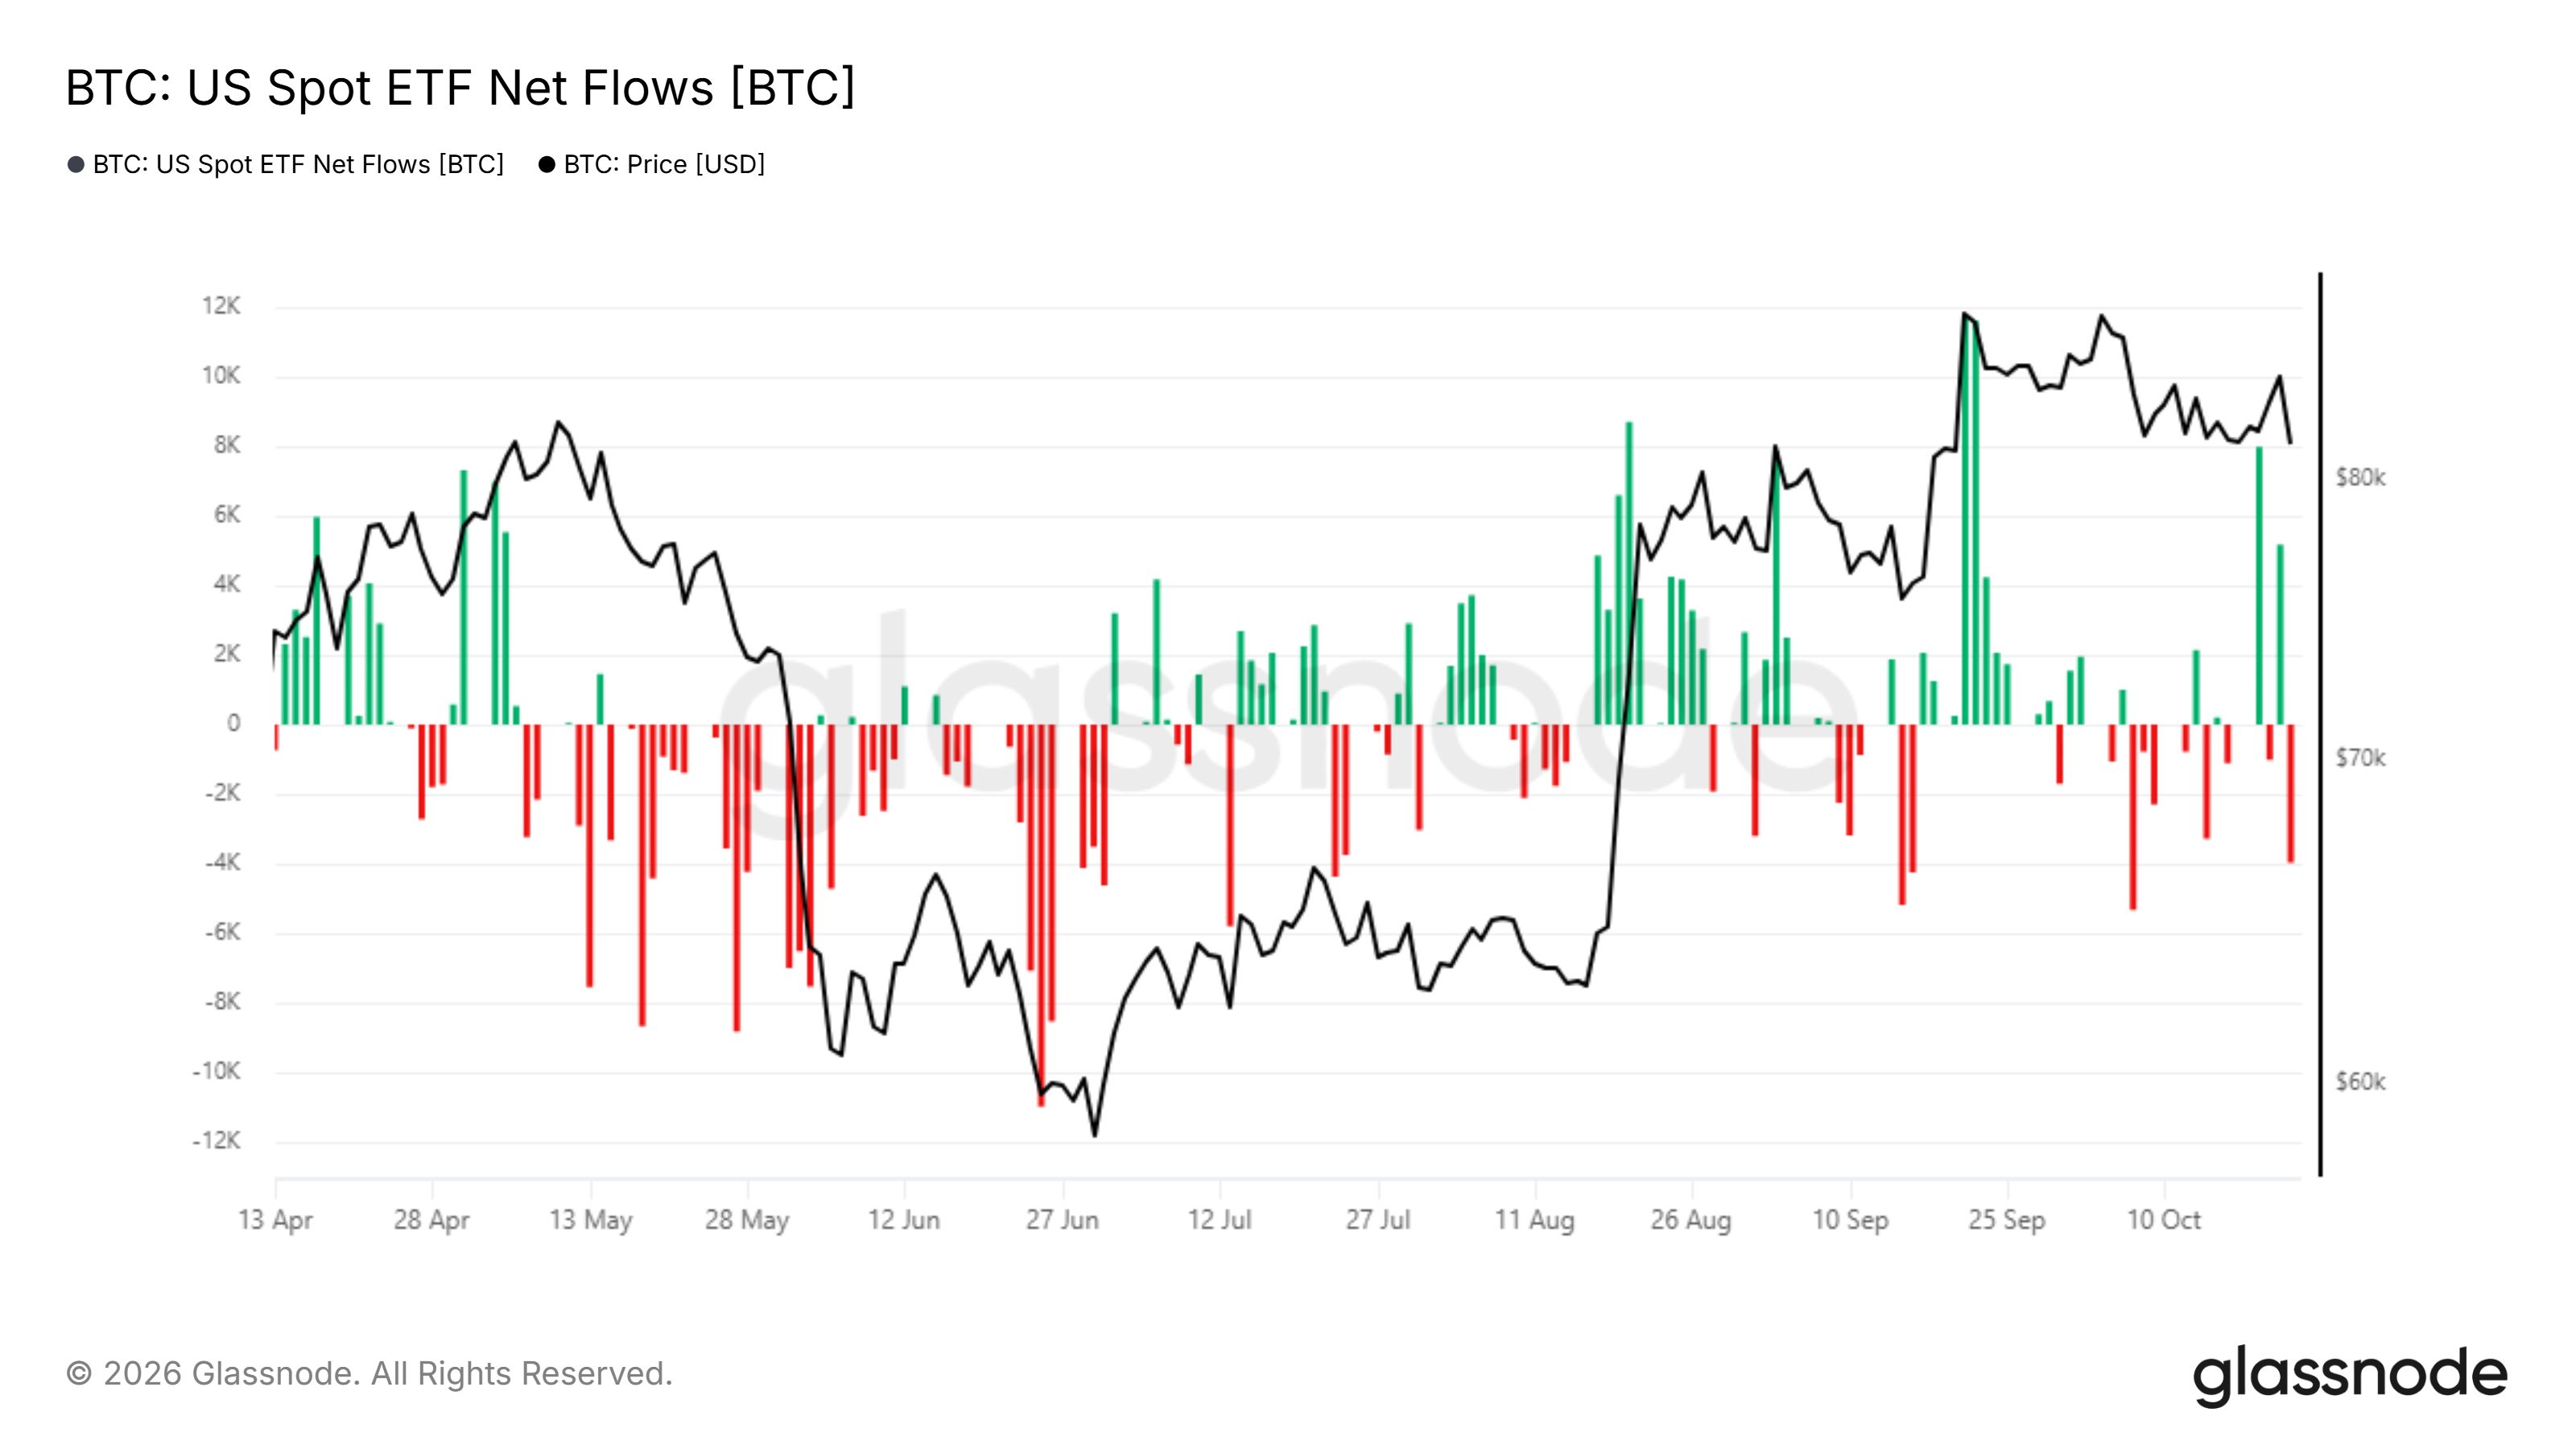
Institutional demand also cooled. US spot Bitcoin ETFs recorded net outflows of 3,964 BTC on Oct. 22, worth roughly $322 million, according to Glassnode.
 US spot ETF net flows in BTC / Source: Glassnode
The withdrawal followed two strong inflow days that backed the push toward $85,000. Historically, every major rally this year relied on a multi-day inflow streak.
Funds had already posted repeated outflows earlier in October. Without renewed buying, spot demand may struggle to absorb a leverage flush.
Bitcoin Volatility and Price Prediction Points to the Bull Market Support Band
A daily close below $81,000 could open the path to the 0.5 Fibonacci level at $77,876. That target sits about 4.6% below the current price.
Below it lies the bull market support band. The range spans from the 21-week exponential moving average (EMA) at $76,700 to the 20-week SMA at $72,500.
The 0.382 Fibonacci level at $73,139 adds confluence near the lower edge. Benjamin Cowen, a member of BeInCrypto's Market Intelligence Expert Council, flagged the same risk.
Bitcoin getting a daily close below the 50D SMA likely sends it to the bull market support band.
— Benjamin Cowen (@benjamincowen) October 22, 2026
Note that ETH, MSTR, NDQ, TOTAL2, TOTAL3, etc. are already at the bull market support band. pic.twitter.com/icuP6ZTqZt
A move into the band would not necessarily end the broader uptrend. However, a weekly close below $72,500 could challenge the bull market structure.
On the other hand, holding above $82,600 could trigger a squeeze toward $85,000. A daily close above $84,000 would invalidate the bearish structure.
For now, the data points to a volatile weekend rather than a calm one, with sellers holding the edge.
Read the Original story Bitcoin Loses Key Support Ahead of the Weekend. Is a Big Move Coming? by Jakub Dziadkowiec at beincrypto.com