


TransUnion TRU reported better-than-expected third-quarter 2026 results, with adjusted earnings of $1.25 per share surpassing the Zacks Consensus Estimate by 3.3% and increasing 13.6% year over year. Revenues of $1.31 billion beat the consensus estimate by 0.3% and rose 12% from the year-ago quarter.
The stock price has not witnessed any significant impact from the earnings beat since the company released results on Oct. 27.
The performance was driven by solid growth in U.S. Financial Services, sustained insurance momentum and accelerating international operations. Organic constant-currency revenues increased 8%, while adjusted EBITDA grew 9% year over year.
TRU shares have gained 15.1% over the past six months, outpacing the industry’s 7.8% increase. The Zacks S&P 500 Composite has risen 3.5% over the same time frame.
TransUnion Price, Consensus and EPS Surprise
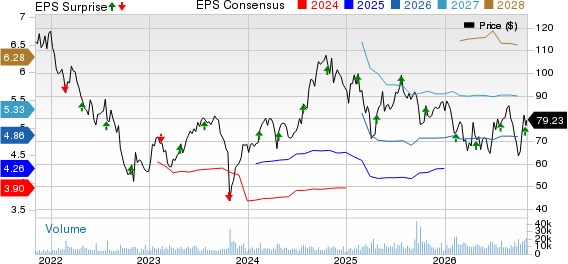
TransUnion price-consensus-eps-surprise-chart | TransUnion Quote
TRU's U.S. Markets Growth Remains Solid
U.S. Markets revenues increased 7% year over year to $977 million. Financial Services revenues climbed 11% to $485 million, supported by pricing actions, client wins and continued demand across lending solutions.
Auto revenues grew 13% year over year, benefiting from pricing and business wins despite declining industry volumes. Consumer Lending increased 5%, while Credit Card and Banking advanced 3%. Mortgage revenues rose 21%, or 5% excluding FICO royalties, despite a 16% decline in inquiries.
Emerging Verticals revenues increased 6% year over year to $351 million. Insurance recorded its ninth consecutive quarter of double-digit growth, supported by core credit, Driving History and Trusted Call Solutions. Public sector demand improved, although tenant and employment screening and media remained soft.
Consumer Interactive revenues declined 3% year over year to $140 million, reflecting weakness in the direct channel and relatively flat performance in indirect channels.
TransUnion's International Business Accelerates
International revenues grew 30% year over year to $339 million, including contributions from Trans Union de Mexico. Organic constant-currency growth accelerated to 10%, reflecting improving credit activity and business wins.
Latin America revenues reached $99 million, representing 18% year-over-year organic constant-currency growth. Brazil and Colombia delivered strong performances, while the Mexico acquisition continued to exceed management's revenue and profitability expectations.
India revenues totaled $74 million, growing 18% year-over-year on a constant-currency basis. Improving consumer and commercial lending volumes, stronger credit data capabilities, and client wins supported the recovery.
Canada and the U.K. posted year-over-year constant-currency growth of 7% and 5%, respectively. Africa advanced 6%, while the Asia Pacific registered a 3% increase.
TRU's Profitability Reflects Investment Pressures
Adjusted EBITDA increased 9% year over year to $465 million. However, the adjusted EBITDA margin contracted 90 basis points to 35.4%, reflecting technology investments, higher legal and regulatory expenses and the impacts of FICO mortgage royalties.
U.S. Markets adjusted EBITDA rose 1% year over year to $353 million. International adjusted EBITDA climbed 39% to $156 million, benefiting from stronger operational performance and the Mexico acquisition.
GAAP net income attributable to TransUnion increased to $156.2 million from $96.6 million a year earlier. GAAP earnings rose to 81 cents per share from 49 cents.
TransUnion's Cash Flow Supports Shareholder Returns
TRU ended September with $883.1 million in cash and cash equivalents, and $5.5 billion in debt. Its leverage ratio declined to 2.5X, reaching the company's long-term target.
Cash provided by operating activities totaled $888.6 million in the first nine months of 2026 compared with $668.1 million a year earlier. Capital expenditure declined to $201.3 million from $229.3 million.
The company repurchased $126 million in shares in the third quarter, bringing year-to-date repurchases to $243 million. Management expects $500 million in repurchases for 2026. The board increased the total repurchase authorization to $2 billion and raised the quarterly dividend to 13.5 cents per share.
TRU Advances Technology Modernization & Innovation
TransUnion accelerated customer migrations to its OneTru technology platform, with most U.S. credit activities now operating on the system. Management expects the U.S. migration to be substantially completed by year-end, with further international expansion planned for 2027.
The company introduced more than 40 products and artificial intelligence-powered enhancements during the first nine months. Management estimates that recent launches represent approximately $350 million in revenue potential over the next three years.
Insurance remains a significant growth opportunity, with expected 2026 revenues exceeding $430 million. The company anticipates at least high-single-digit medium-term growth, supported by contract wins, broader product adoption and expanding telematics capabilities.
TransUnion Raises 2026 Earnings Outlook
For the fourth quarter of 2026, TransUnion expects revenues between $1.26 billion and $1.29 billion, implying 8-10% reported growth. The midpoint ($1.28 billion) of the guided range is lower than the Zacks Consensus Estimate of $1.29 billion.
Adjusted earnings are projected between $1.15 and $1.22 per share. The midpoint ($1.185) of the guided range is lower than the Zacks Consensus Estimate of $1.2. Adjusted EBITDA is expected between $450 million and $468 million.
For 2026, management updated the revenue guidance to $5.13-$5.16 billion from the preceding quarter’s view of $5.13-$5.16 billion. The midpoint ($5.147 billion) of the outlook is slightly lower than the consensus estimate of $5.15 billion. The range implies 12-13% reported growth and 8-9% organic constant-currency growth.
The adjusted EBITDA guidance stands at $1.81-$1.83 billion, suggesting 10-11% year-over-year growth. The adjusted earnings outlook increased to $4.81-$4.88 per share from $4.75-$4.83, reflecting lower net interest expenses and share repurchases. The midpoint ($4.85) of the guided range is lower than the consensus estimate of $4.86.
TransUnion currently carries a Zacks Rank #3 (Hold). You can see the complete list of today’s Zacks #1 Rank (Strong Buy) stocks here.
Earnings Snapshot
Republic Services RSG reported better-than-expected third-quarter 2026 results.
RSG's adjusted earnings of $1.94 per share increased 2.1% year over year and surpassed the Zacks Consensus Estimate of $1.92 by 1%.
Revenues rose 8.2% year over year to $4.56 billion and beat the consensus mark of $4.41 billion by 3.4%.
ADP ADP posted impressive first-quarter fiscal 2027 results, with earnings and revenues beating the Zacks Consensus Estimate.
ADP’s adjusted earnings of $2.83 per share beat the Zacks Consensus Estimate of $2.78 by 1.8%. The figure increased 14% from the year-ago quarter.
Revenues of $5.49 billion surpassed the consensus mark of $5.47 billion by 0.4% and rose 6% year over year.
Zacks' Research Chief Names "Stock Most Likely to Double"
Our team of experts has just released the 5 stocks with the greatest probability of gaining +100% or more in the coming months. Of those 5, Director of Research Sheraz Mian highlights the one stock set to climb highest.
Of course, all our elite picks aren't winners, but this one could far surpass earlier Zacks' Stocks Set to Double like D-Wave Quantum, which shot up +680.1%.
Free: See Our Top Stock And 4 Runners UpWant the latest recommendations from Zacks Investment Research? Today, you can download 7 Best Stocks for the Next 30 Days. Click to get this free report
TransUnion (TRU): Free Stock Analysis Report
Automatic Data Processing, Inc. (ADP): Free Stock Analysis Report
Republic Services, Inc. (RSG): Free Stock Analysis Report
This article originally published on Zacks Investment Research (zacks.com).