
Sharing market insights and technical analysis.
Focused on XAUUSD price action and smart money concepts.
차트 & 아이디어
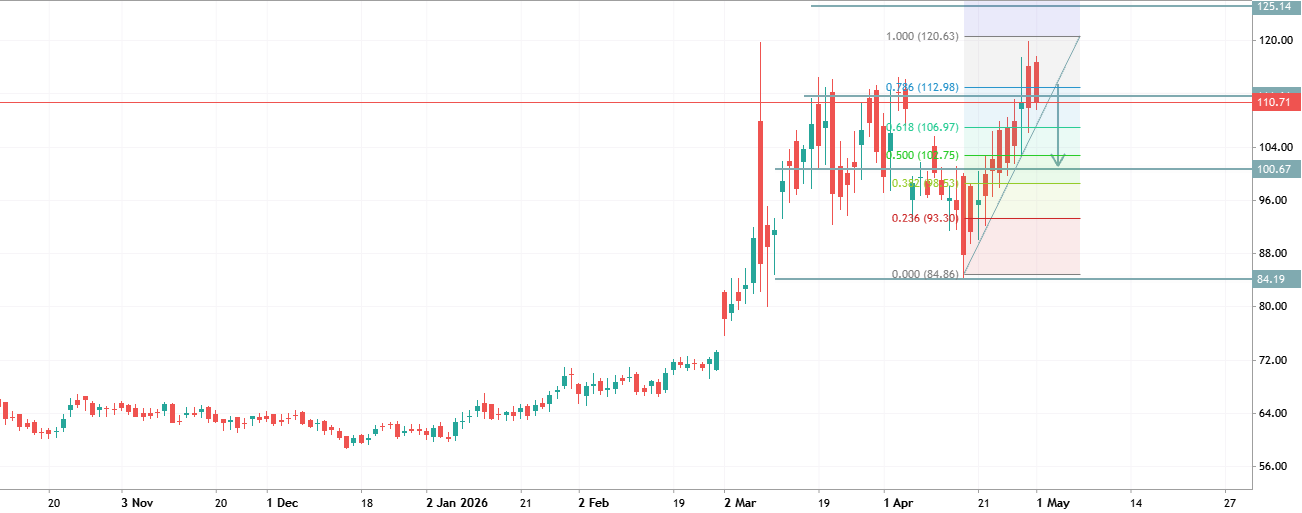
Brent (XBRUSD) Analysis
Brent is trading in a strong uptrend, with price approaching the 1.000 Fibonacci resistance (~120.60) after a sustained bullish move. The market is currently overextended to the upside, testing key resistance levels, suggesting a possible breakout or pullback scenario. A break above 120.60 will open the way toward 132.00 (next Fibonacci expansion level); A rejection from current resistance may trigger a pullback toward 106.00 – 100.00 support zone
2026.05.01 06:35 0 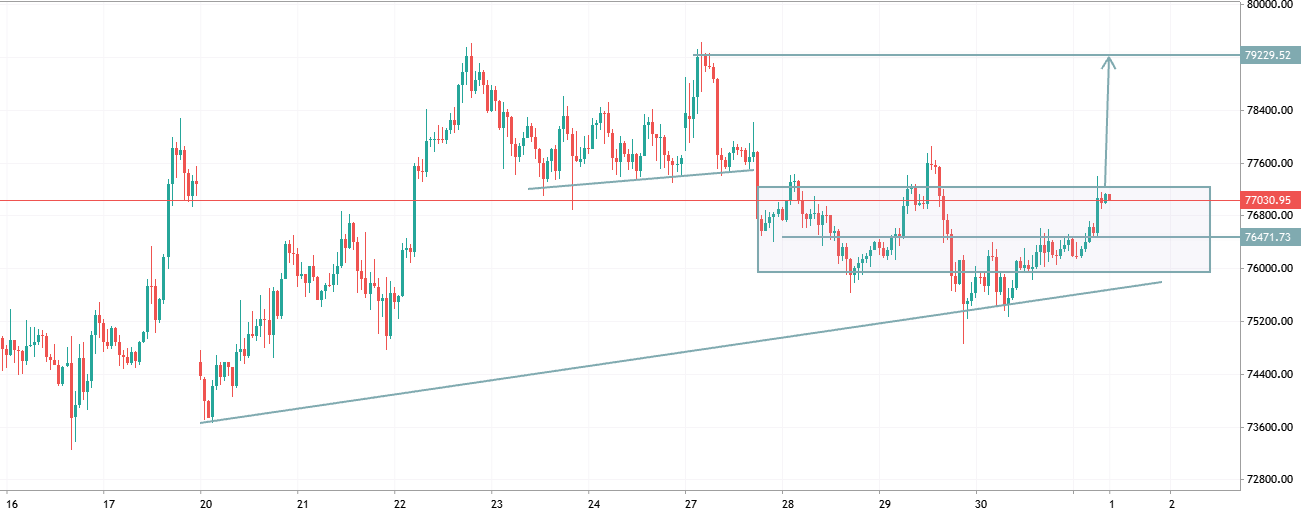
Bitcoin (BTCUSD) Analysis
Bitcoin is consolidating inside a range structure after an uptrend, with higher lows forming → bullish continuation bias. Price is currently testing the range resistance zone (~77000), with strong support held below → breakout pressure building. Momentum shows steady bullish recovery, indicating buyers gaining control. We are considering buying BTCUSD above 77000 breakout; Target 1: 78400 Target 2: 79200 A rejection and drop back below 76400 would invalidate the bullish setup
2026.05.01 06:15 0 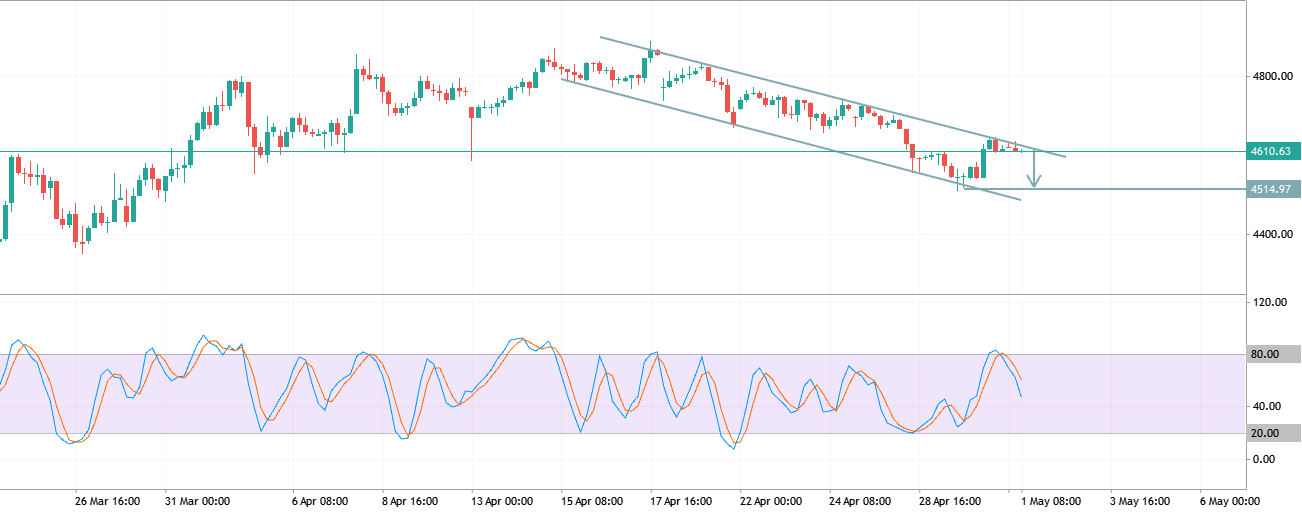
Market Structure (H4 – XAUUSD)
Gold (XAUUSD) Analysis Gold is trading inside a descending channel, confirming a sustained bearish trend with clear lower highs and lower lows. The price is currently testing the upper boundary of the channel, aligned with a horizontal resistance zone, creating strong confluence for a potential rejection. The Stochastic oscillator is turning down from the overbought zone, signaling increasing selling pressure. We are considering selling XAUUSD on rejection from 4615–4620; Target 1: 4510 Target 2: 4480 A confirmed breakout above the channel resistance would invalidate the bearish setup
2026.05.01 06:03 0 
AUDUSD TRADE IDEA
🇦🇺 AUDUSD has bounced off the overall uptrend line, and the Parabolic SAR indicates the start of a downtrend. The DeMarker has also moved out of the overbought zone. 🔽 A drop below 0.7100 will push AUDUSD even lower;
🎯 Target 1: 0.7050;
🎯 Target 2: 0.6990.
2026.04.30 16:00 0 
AUDUSD TRADE IDEA
🇦🇺 AUDUSD has bounced off the overall uptrend line, and the Parabolic SAR indicates the start of a downtrend. The DeMarker has also moved out of the overbought zone. 🔽 A drop below 0.7100 will push AUDUSD even lower;
🎯 Target 1: 0.7050;
🎯 Target 2: 0.6990.
2026.04.30 16:00 0 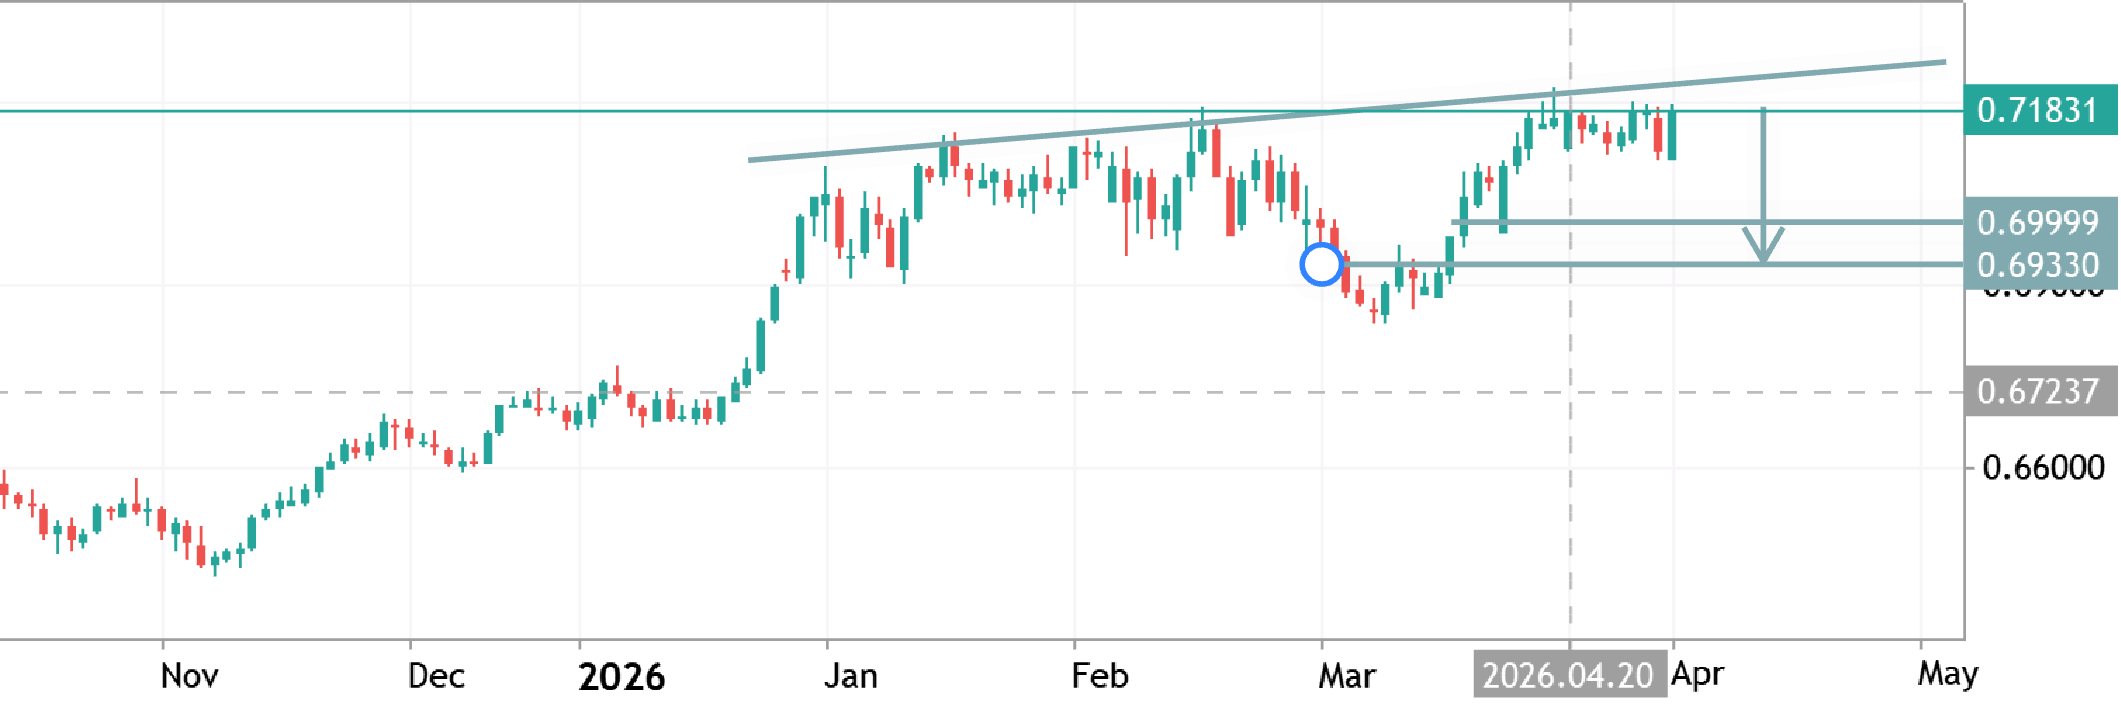
AUDUSD TRADE IDEA
🇦🇺 AUDUSD has bounced off the overall uptrend line, and the Parabolic SAR indicates the start of a downtrend. The DeMarker has also moved out of the overbought zone. 🔽 A drop below 0.7100 will push AUDUSD even lower;
🎯 Target 1: 0.7050;
🎯 Target 2: 0.6990.
2026.04.30 16:00 0 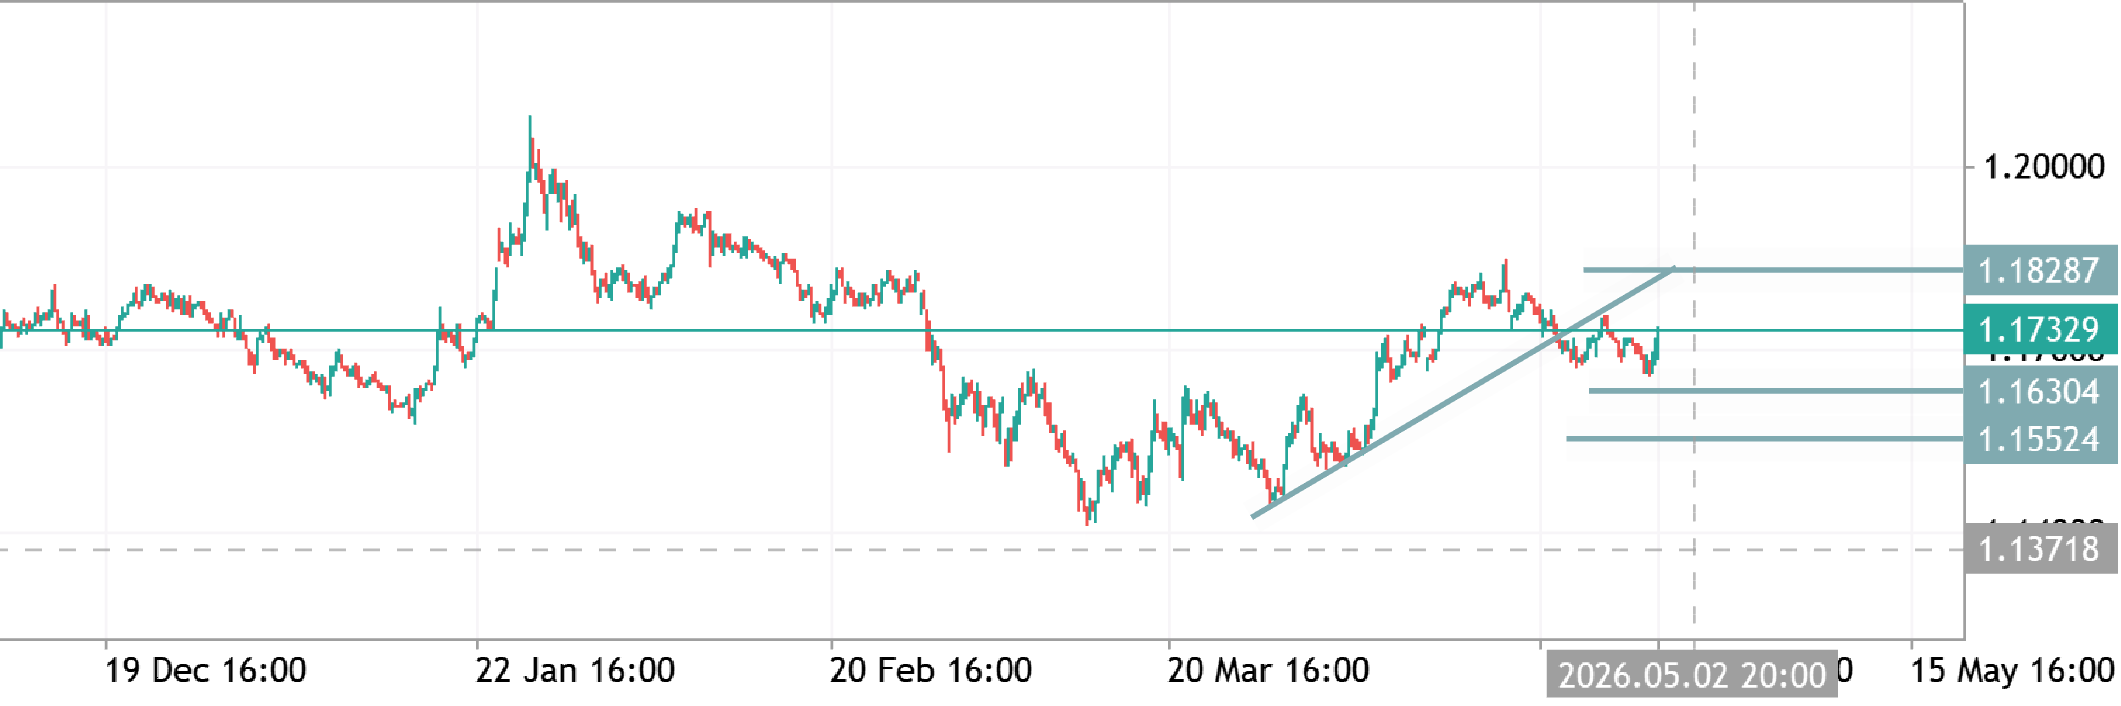
EURUSD TRADE IDEA
💶EURUSD has broken through the upward trend line, retested it and the 50-day moving average (MA50), and is now continuing to fall. The Stochastic oscillator has moved out of the overbought zone, confirming the potential for a decline. 🔽 We are considering selling EURUSD ONLY if it consolidates below 1.1680;
🎯 Target 1: 1.1640;
🎯 Target 2: 1.1610.
2026.04.30 15:48 0 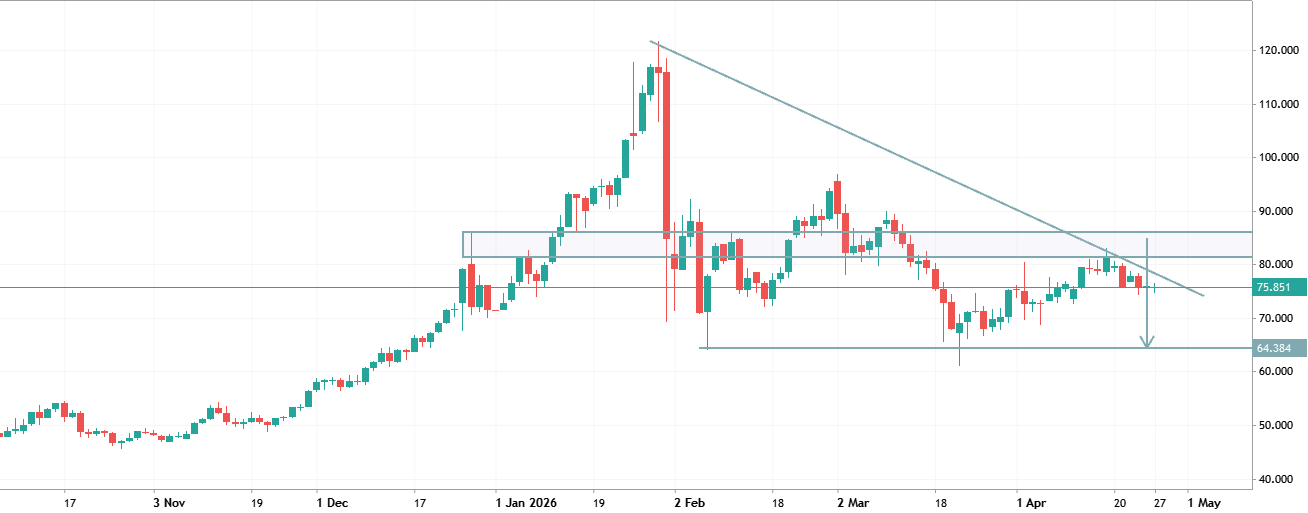
XAGUSDN D1 Analysis
Price is currently moving under a strong descending trendline, showing clear bearish pressure. Market also got rejected from a key resistance zone and is now consolidating.
🔻 Bias: Bearish 📉 Structure: Lower highs + trendline resistance 📍 Key Resistance: Trendline + horizontal zone 📍 Key Support: Recent low area below current price
Outlook: If price stays below the trendline, a breakdown is likely, targeting the next support zone. Only a strong breakout above trendline would shift momentum bullish.
2026.04.27 06:34 0 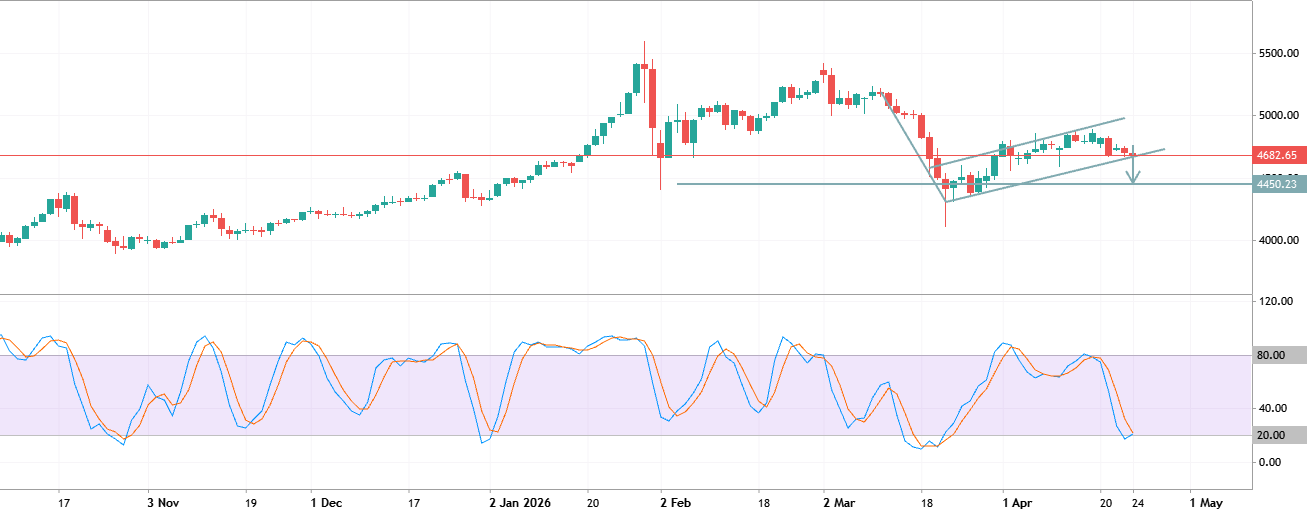
XAUUSD ALERT! 24\04\2026
🥇So, gold has formed a bearish flag pattern, and the price has broken below the lower boundary. The Parabolic SAR confirms the downtrend, and the Chaikin Oscillator is below 0.
🔽 If XAUUSD falls below 4660, the decline will continue; 🎯 Target: 4550.
2026.04.24 10:28 0 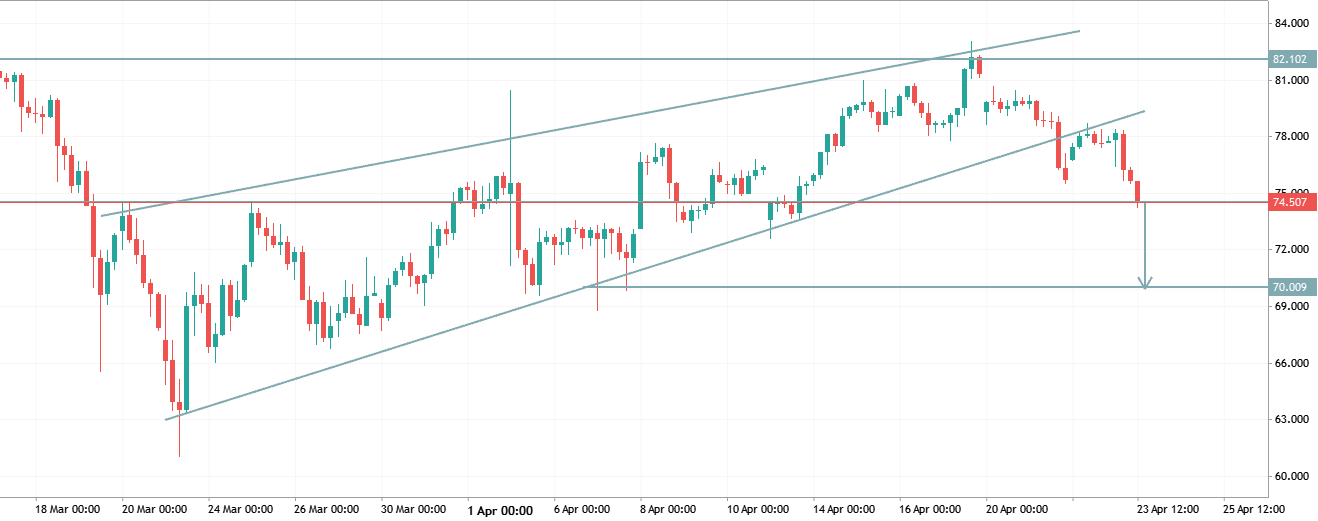
XAGUSD H4 Analysis: Channel Breakdown Signals Downside Move
🥈 Silver has retested the previously broken upward trend line of the ascending channel. The price has broken out of the cloud, and the Kijun line has crossed below the Tenkan line, falling below the nearest fractal.
🔽 A drop below 74,500 will push XAGUSD even lower; 🎯 Target: 70,000.
2026.04.23 11:06 0 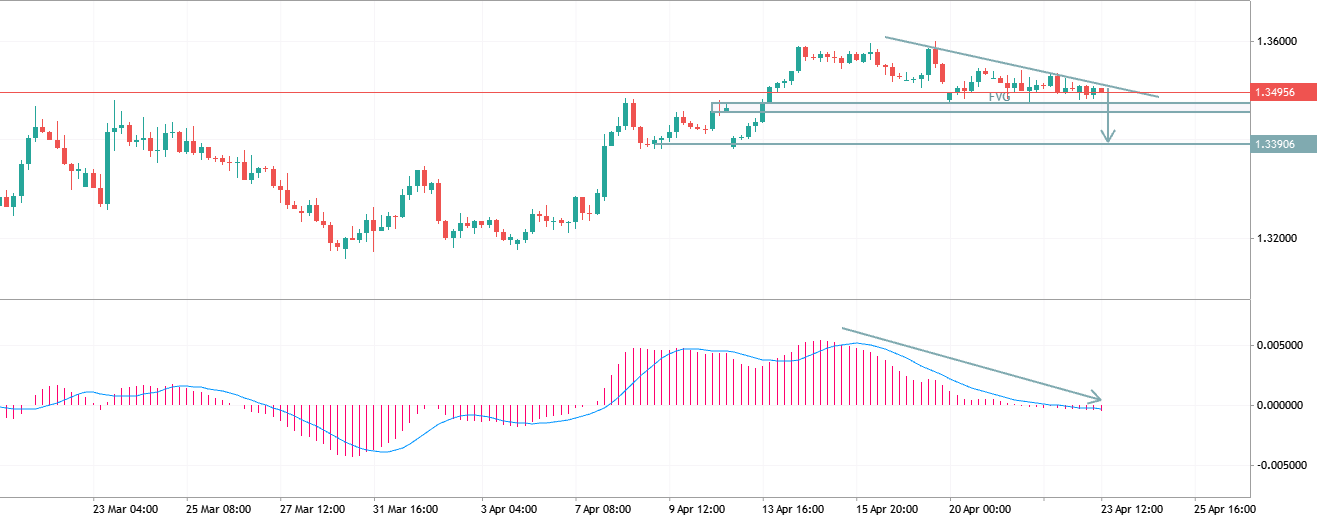
GBPUSD H4 Bearish Continuation from FVG Zone
💷 GBPUSD has formed a descending triangle pattern on the H4 chart and is testing the lower boundary. There is an FVG at the bottom, and the MACD histogram confirms bearish dominance.
🔽 We are considering selling GBPUSD if it falls below 1.3480; 🎯 Target: 1.3390.
2026.04.23 09:10 0