

Nvidia, Inc. (NVDA) will release earnings on Wednesday, Aug. 26, after the market closes. NVDA stock has been treading water ahead of earnings, but expect volatility. Some investors may want to short puts after the results.
NVDA closed at $214.72 on Friday, Aug. 21, down 4.70% from a recent closing peak of $225.30 on Aug. 13, but still up 13.0% from a recent trough of $190.01 on July 29.
Can’t Get Enough Options?: Join the list for Barchart’s daily unusual options report, delivered free.
However, it has been flat over the last 3 months. This shows up in Barchart's NVDA chart (below).
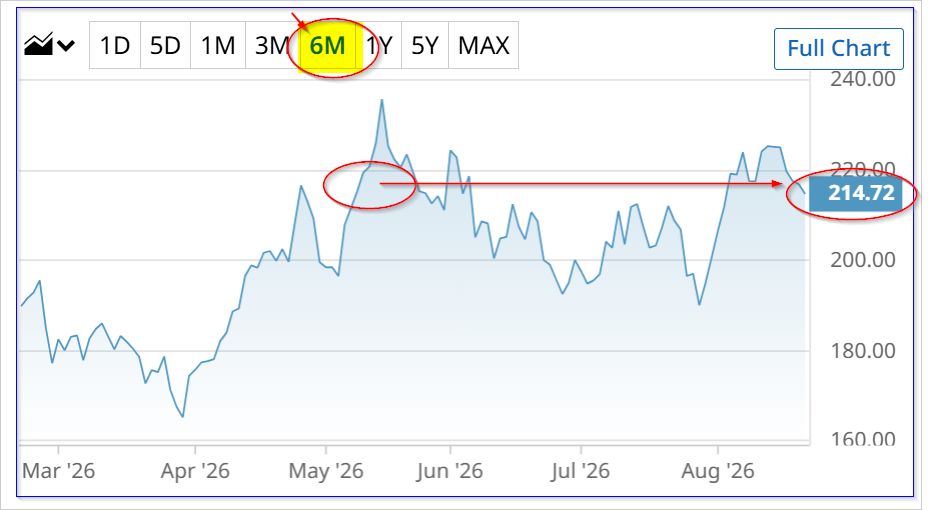 NVDA stock - last 6 months - Barchart - Aug. 21, 2026
 For example, since its last earnings release on May 20, when NVDA closed at $220.51, NVDA has lost about $7 per share, or -2.62%.
Wow! Has all the hype fizzled out in this stock?
And by the way, this shows that it's much more profitable to sell short cash-secured puts at out-of-the-money (OTM) strike prices. I write a good deal about these plays in Barchart.
Shorting Puts Works
For example, in my July 12 Barchart article ("Nvidia Stock Has Been Flat, But NVDA Price Targets are Higher - Shorting Puts Works"), I suggested shorting the $195.00 put expiring Aug. 14 (when NVDA was trading at $210.96, i.e., 7.6% below the trading price). The 1-month yield was $3.90, so cash-secured short-put investors made a 2.0% income.
On Aug. 14, NVDA closed above that price ($225.16), so investors kept that income without having to buy NVDA shares at $195.00.
Now that NVDA has dropped again, some investors could short a new one-month strike price.
For example, the Sept. 25 $200.00 put, 7% below the trading price, has a midpoint premium of $4.48. That gives investors a one-month 2.24% yield (i.e., $448/$20,000 collateral).
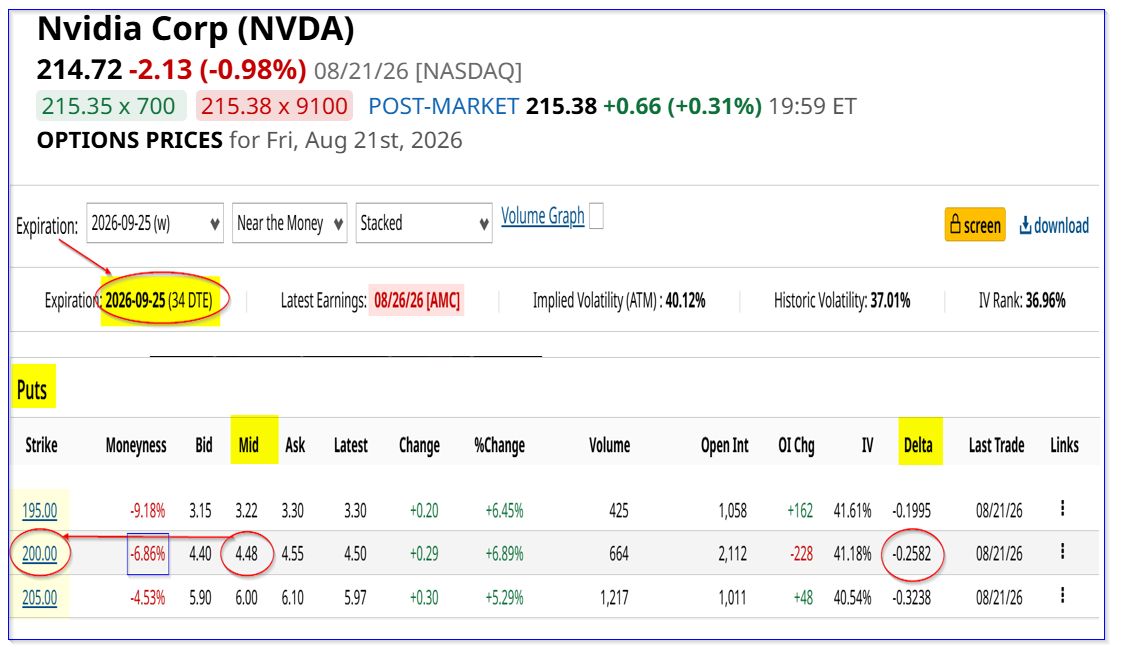 NVDA puts expiring Sept. 25 - Barchart - As of Aug. 21, 2026
 However, the upcoming earnings release could lead the market to “sell on the news.” That could especially be the case if Nvidia doesn't “wow” the market.
Earnings Expectations
For example, analysts expect revenue to be almost $10 billion higher than last quarter's $81.62 billion: $92.07 billion estimates in Seeking Alpha's survey and at Yahoo! Finance.
Earnings per share (EPS) are forecast to be higher than last quarter's $1.87: Seeking Alpha and Yahoo! Finance both show an average analyst EPS of $2.09. That's a Q/Q growth rate of 11.77%.
This implies a 47% run rate going forward (i.e., 11.77% x 4). But that may not wow the market.
For example, that's lower than the 67% growth rate (year ending Jan. 25, 2026), and the 110.58% trailing 12-month (TTM) Y/Y growth in fiscal Q1 (ending April 26), as Stock Analysis reported.
In other words, the super-fast growth rate in revenue and earnings may be tempering. That could affect its high valuation. The market is very sensitive to this.
For example, analysts are forecasting $9.01 EPS for the year ending Jan. 25, 2027. That puts NVDA stock on a forward price/earnings (P/E) ratio of over 23x:
$214.72 / $9.01 = 23.83 x
That's well below its historical average, even on a forward basis, according to Seeking Alpha data. So, NVDA could still have significant upside.
A good deal will depend on the company's fiscal Q2 performance as well as management's revenue and earnings outlook.
Free Cash Flow Outlook
In addition, as I often show in my articles, the projected free cash flow (FCF) and FCF margins will affect the market's reaction to the results.
For example, analysts now project revenue for this fiscal year (ending Jan. 2027) will be almost $400 billion ($395.4 billion) and $569.5 billion next year.
So, over the next 12 months (NTM), assuming Nvidia makes an average 53.3% FCF margin, as I discussed in my June 12 Barchart article, FCF could hit $257 billion:
$482.5 billion (NTM) revenue x 0.533 = $257.15 billion NTM FCF
Using a 3.90% FCF yield metric (the same as a 25.6 multiple, that would give Nvidia a fair market value (FMV) of over $6.59 trillion:
$257.15b x 25.64 = $6,593 billion FMV
That's over 26.76% higher than Friday's market cap of $5.2 trillion, according to Yahoo! Finance.
In other words, the price target (PT) is $272.22 (i.e., 1.2676 x $214.72).
Analysts have even higher price targets: Yahoo! Finance's survey average is $304.12, and Barchart's mean survey PT is $304.32.
The bottom line is that on a FCF basis, NVDA could be significantly undervalued. However, analysts will be evaluating the company's FCF margin performance very carefully. If it is lower than the 53% projected for the coming year, NVDA could take a hit.
On the date of publication, Mark R. Hake, CFA did not have (either directly or indirectly) positions in any of the securities mentioned in this article. All information and data in this article is solely for informational purposes. For more information please view the Barchart Disclosure Policy here.
More news from Barchart
Nvidia Stock Is Treading Water Ahead of Earnings This Week - What's the Best NVDA Play? Unusual Options Activity Shows 1 Institutional Trader Is Making a Big Bet on PG&E Stock Micron Technology Puts Have High Yields for Short Sellers Even With MU Stock Higher ‘There’s Only One Way I Know to Avoid Leverage’ – But Should You? In Defense of Leverage with Our ETF Expert