

AMZN
#5
Amazon.com, Inc. - Common Stock
256.9 7 USD
-0.01%
Market Price
Сектор: Потребление циклического спроса
Базовая: USD
Валюта прибыли: USD
Дневной диапазон
Годовой диапазон
Дневное изменение
-0.60%
Месячное изменение
-6.28%
6-месячное изменение
+20.01%
Годовое изменение
+8.19%
Предыдущее закрытие
258.5 1
Open
256.9 5
Low
256.9 5
High
256.9 7
Volume
826
Financials
Значение Q1, 25Q2, 25Q3, 25Q4, 25Q1, 26Q2, 26
Новости
Amazon впервые размещает облигации в фунтах стерлингов
Грузовой самолёт Amazon разбился у аэропорта Майами
В цепочках поставок глобальных предприятий присутствуют подсанкционные компании
Почему акции Tesla растут на 4% сегодня?
Мосбиржа запустит 20 вечных фьючерсов на акции США
Минюст США запросил данные о ценах на говядину у крупных ритейлеров
Anthropic запускает Пограничные защиты для Claude
FTC подаёт иск против Amazon из-за рекламных практик
Когда Meta обгонит Google в рекламе: мнение Bernstein
Meta может обогнать Google Search по рекламным доходам в 2026 году
Citizens подтверждает рейтинг Amazon на фоне расширения GPU в AWS
Графики и идеи
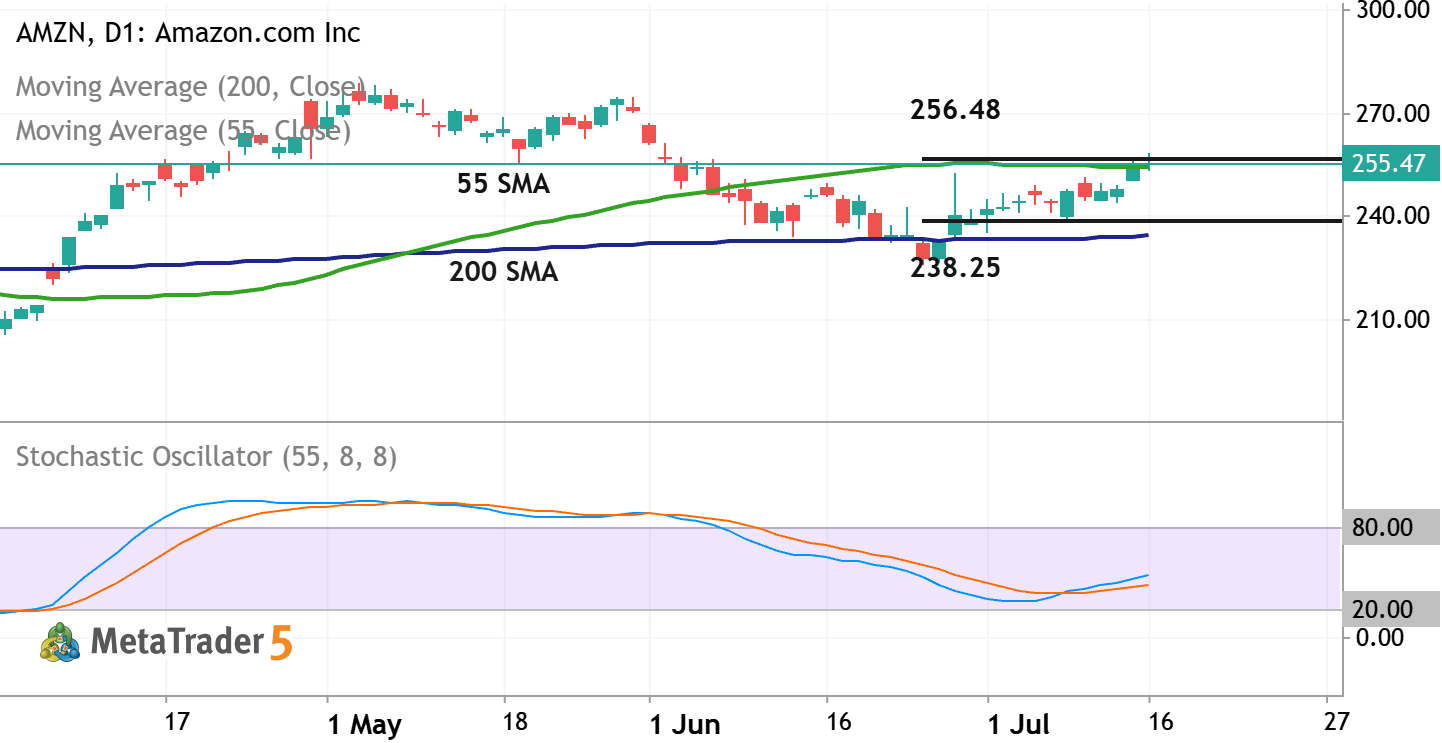
AMZN - Daily Trading Forecast
Daily price is located above 200 SMA in the bullish area of the chart. The Stochastic oscillator is showing the uptrend to be started by crossing the 50 level to above, and the price is trying to break the resistance level at 256.48 together with 55 SMA to above for the strong bullish trend to be continuing. If the price breaks resistance at 256.48 together with 55 SMA to above so the primary bullish market condition will be continuing for daily price. If the price crosses support level at 238.25 together with 200 SMA to below so the primary bearish reversal will be started. Alternatively, the price will be on secondary ranging above 200 SMA to be inside s/r levels waiting for direction of the strong trend tioo be started. Trading Summary : bullish ranging for direction.


The AMZN doesn’t have other trading ideas at this time
Browse ready-made trading ideas or select a symbol and create your own
Go to Charts and Trading Ideas