Графики и идеи

XAU/USD (H1): Major Demand Sweep & Trendline Retest Setup XAUUSD Long Gold vs US Dollar

XAU/USD (H1): Major Demand Sweep & Trendline Retest Setup

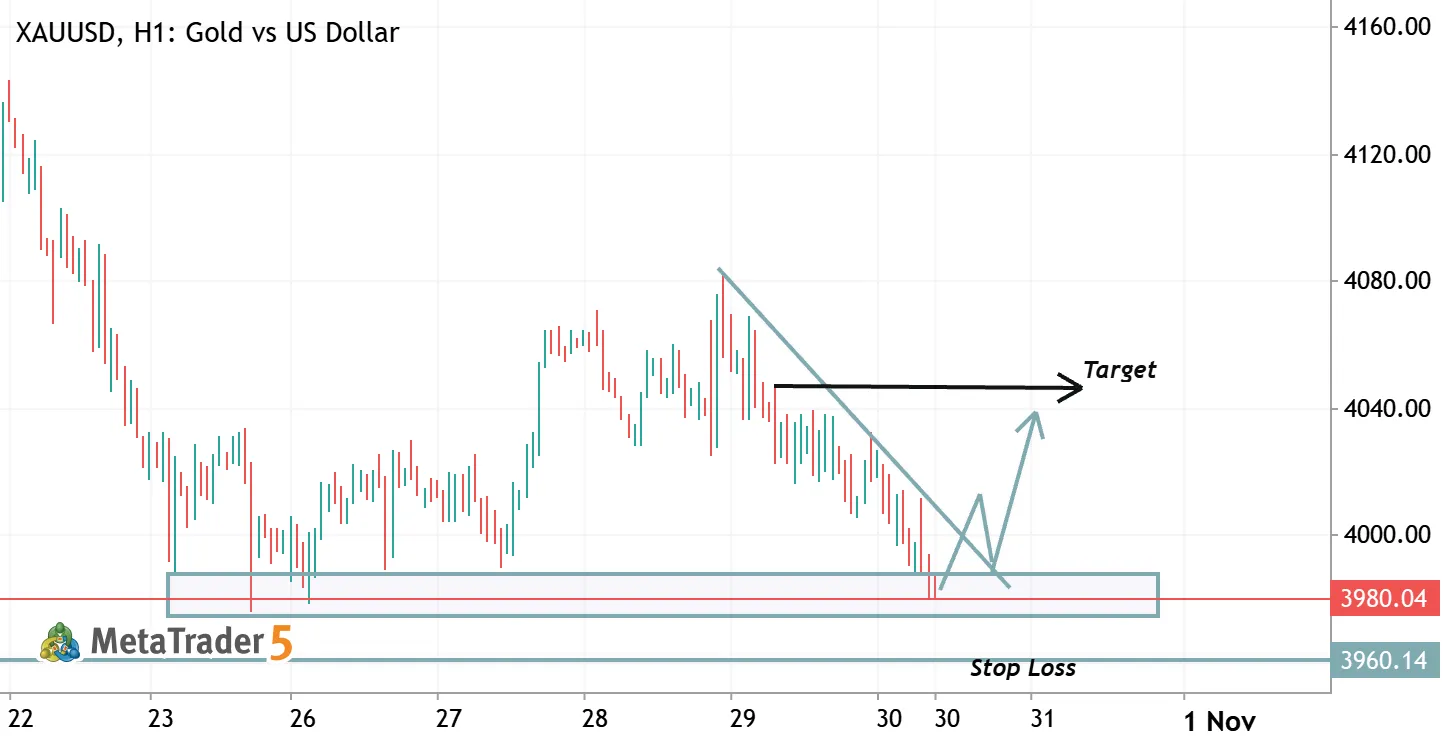
XAU/USD (H1): Major Demand Sweep & Trendline Retest Setup 📈 Gold (XAU/USD) on the 1-Hour timeframe has completed a steep multi-day sell-off directly into a critical macro demand block, printing early signs of exhaustion and liquidity absorption around the sub-$4,000 zone . Structural Breakdown & Price Action Context Higher-Timeframe Demand Zone ($3,970 – $3,990): This broad horizontal base acted as primary support during the October 23–26 consolidation before the impulsive drive toward $4,080+ . The current tap into $3,980.27 serves as a direct test of historical demand and sell-side liquidity (SSL) . Descending Resistance Trendline: Since printing swing highs above $4,080 on October 29, price has respected a sharp descending trendline, driving steady lower highs . Liquidity Sweep
BTC/USD (H1): Bearish FVG Retest — Is a Clean Sweep to $76,000 Next? 📉 BTCUSD Short Bitcoin vs US Dollar

BTC/USD (H1): Bearish FVG Retest — Is a Clean Sweep to $76,000 Next? 📉

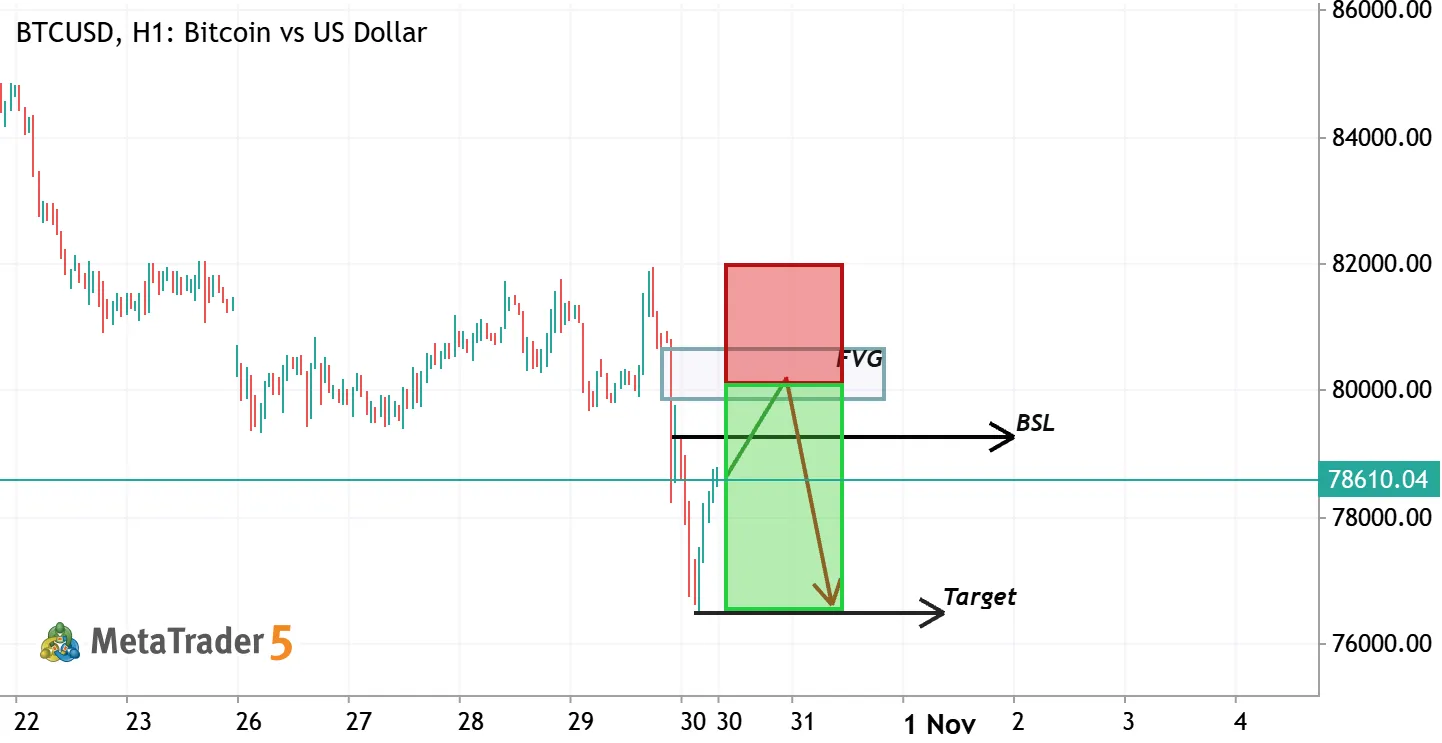
BTC/USD (H1): Bearish FVG Retest — Is a Clean Sweep to $76,000 Next? 📉 Bitcoin (BTC/USD) on the 1-Hour timeframe experienced an aggressive liquidity displacement downward, printing an unmitigated Bearish Fair Value Gap (FVG) and setting up a classic Smart Money Concepts (SMC) sell setup on the retest . Structural Breakdown & Price Action Context Aggressive Displacement & Market Structure Shift (MSS): After failing to break higher above $82,000 , price printed consecutive high-volume bearish candles, decisively slicing through prior local support levels . Bearish Fair Value Gap (FVG): The rapid sell-off left an imbalance pocket between approximately $79,800 and $80,800 . Price is currently forming a corrective retracement (green trajectory line) to balance this institutional
USTECH100 (H1): Deep Retracement into Bullish OB + FVG — Setup Breakdown 🚀 100 USTECH100M Long USTECH100mini

USTECH100 (H1): Deep Retracement into Bullish OB + FVG — Setup Breakdown 🚀

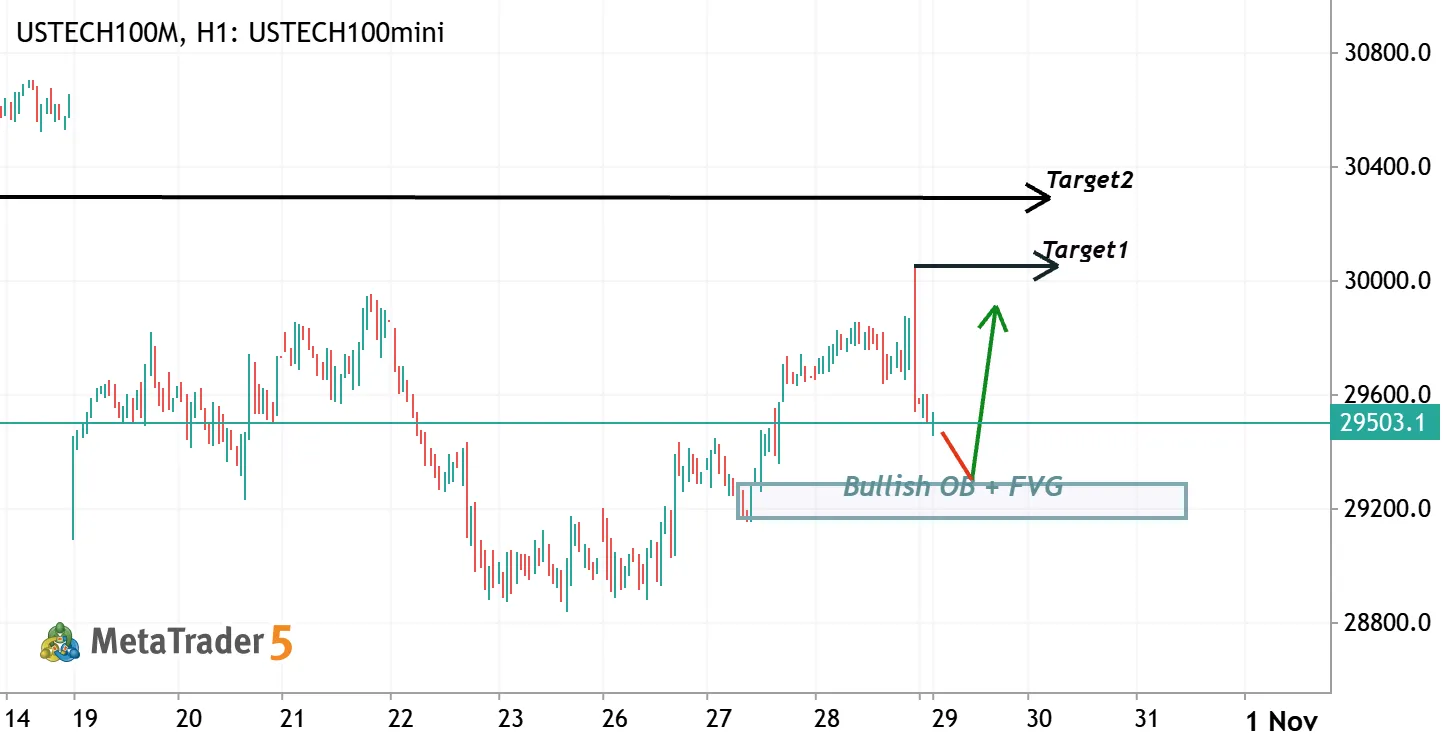
USTECH100 (H1): Deep Retracement into Bullish OB + FVG — Setup Breakdown 🚀 The Nasdaq 100 mini (USTECH100M) on the 1-Hour chart has rejected from the 30,000 psychological milestone following a sharp buy-side liquidity (BSL) sweep, and is currently retracing toward an institutional discount zone . Structural Breakdown & Price Action Context Buy-Side Liquidity Sweep (Target 1 / 30,070 Peak): After a steady multi-day bullish expansion from the 28,800 lows, price surged aggressively to tap 30,070 , sweeping previous swing liquidity before leaving an extended upper rejection wick . Current Retracement (29,506 Pivot): Price is breaking below short-term consolidation as sellers step in to absorb liquidity . The red trajectory arrow indicates expectations of a deeper descent to rebalance
US500 (H4): Trendline Break & Retest — Are Bulls Eyeing the 7,840 Highs? 500 US500 Long US SPX 500 Index

US500 (H4): Trendline Break & Retest — Are Bulls Eyeing the 7,840 Highs?

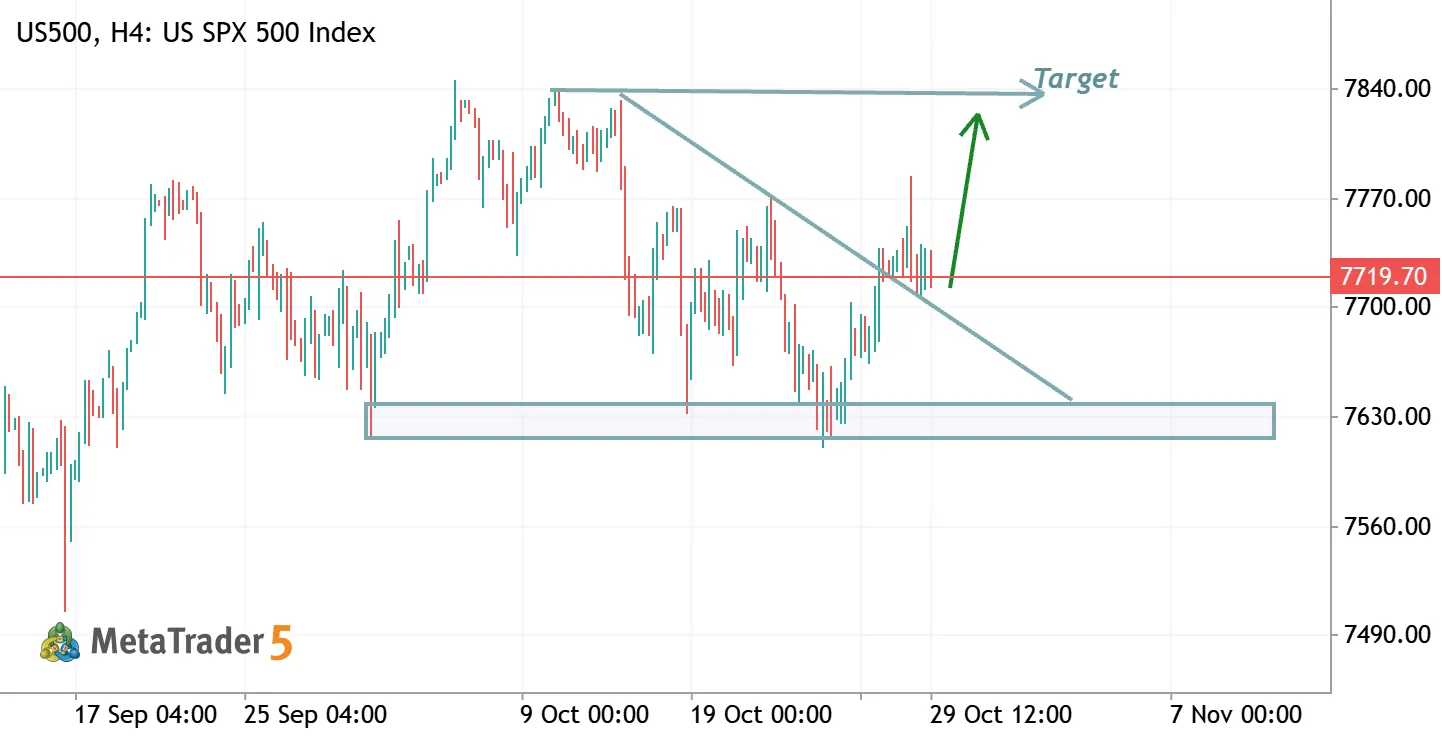
US500 (H4): Trendline Break & Retest — Are Bulls Eyeing the 7,840 Highs? 📈 The S&P 500 Index (US500) on the 4-Hour timeframe has broken above a key descending trendline originating from its swing peaks, setting up a potential bullish continuation after firmly defending its macro base . Structural Breakdown & Price Action Context Demand Floor Defense (7,620.00 – 7,645.00): Over late October, the market tested the key horizontal base multiple times, sweeping liquidity near 7,615.00 before printing aggressive bullish rejections . This established a solid double/triple-bottom structure . Trendline Breakout: A decisive bullish expansion broke out of the descending trendline that had capped rallies since the peak near 7,840.00 . Consolidation / Retest Zone (7,700.00 – 7,725.00)
XAU/USD: Clean Breakdown & Retest — Are Bears Targeting the 4,000 Key Level? XAUUSD Short Gold vs US Dollar

XAU/USD: Clean Breakdown & Retest — Are Bears Targeting the 4,000 Key Level?

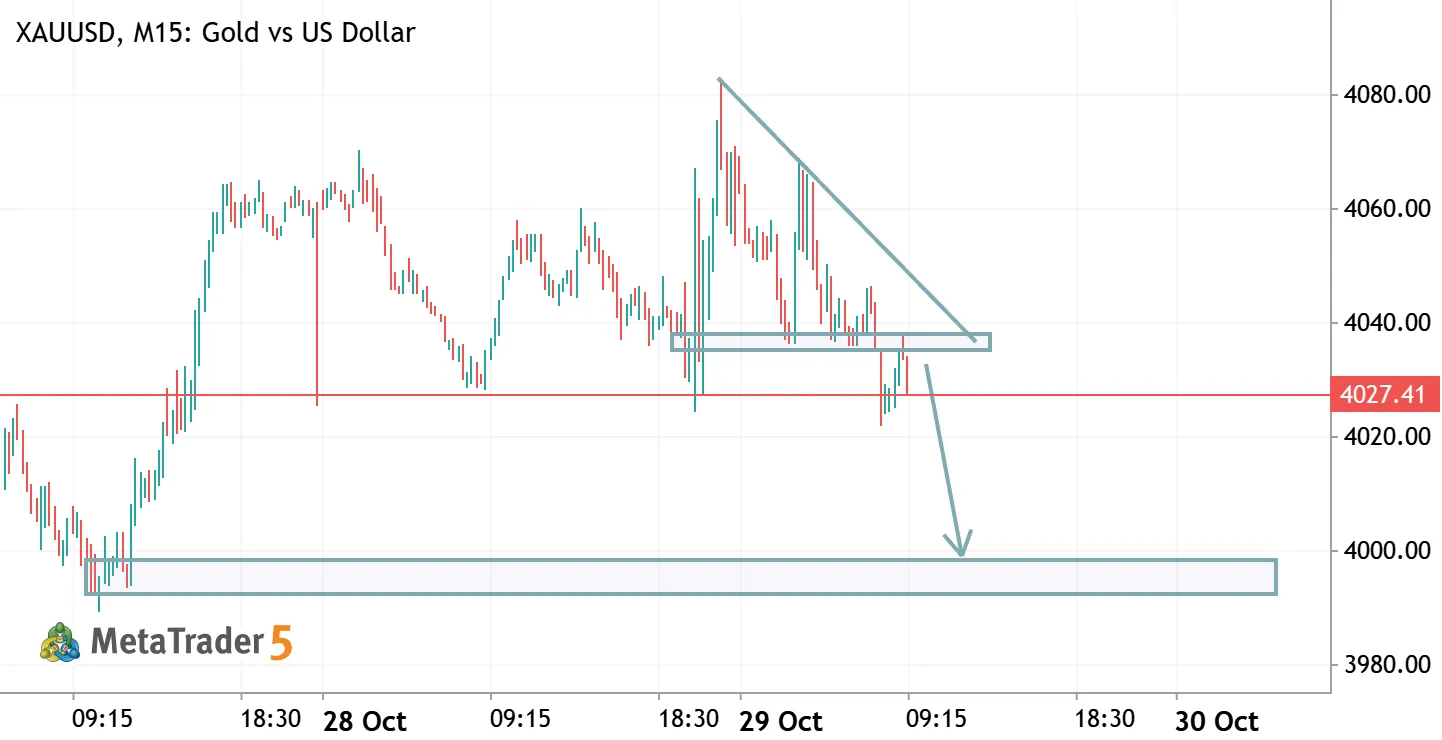
XAU/USD: Clean Breakdown & Retest — Are Bears Targeting the 4,000 Key Level? 📉 Gold (XAU/USD) on the 15-minute timeframe has broken below a multi-session demand shelf, confirming a shift in intraday momentum toward the downside . Structural Breakdown & Market Context Descending Trendline & Lower Highs: Following the peak near 4,082 , price action formed consecutive lower highs along a descending trendline, indicating persistent distribution and institutional selling on pullbacks . Support Flip to Resistance (4,036 – 4,040 Zone): The horizontal shelf around 4,036 – 4,040 served as reliable demand over several sessions . The impulsive break below this level marked a clear Market Structure Shift (MSS) . Pullback Retest: Price completed a pullback directly into the underside of
XAUUSD Bullish Continuation / Support Retest Setup XAUUSD Long Gold vs US Dollar

XAUUSD Bullish Continuation / Support Retest Setup

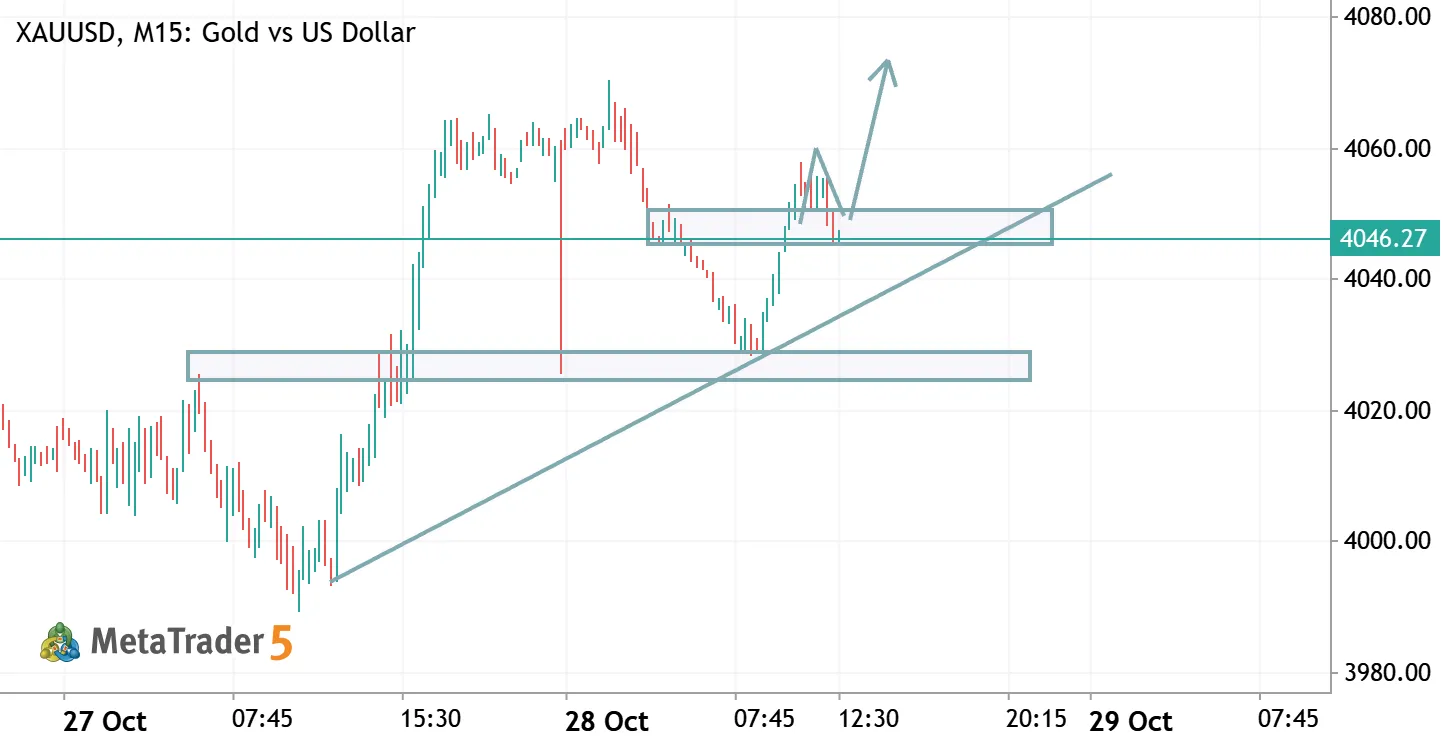
XAUUSD Bullish Continuation / Support Retest Setup Setup Overview Instrument: XAUUSD (Gold vs. US Dollar) Timeframe: M15 (15-minute chart) Direction: Bullish / Long Bias (following a retest of structural support) Analysis & Reasons Uptrend Structure & Trendline: The price action displays an ascending trendline starting from the low near 3992 (around 11:30 on the previous session) extending upwards, respecting higher lows. The chart shows a strong impulse wave moving up, breaking through prior local resistance zones, and establishing a bullish market structure. Support Zones (Order Blocks / Flip Zones): Immediate Support (Upper Box): Located roughly between 4045 and 4050, which previously acted as resistance/consolidation and has now been breached. Price is projected to retest this
EURUSD H1 Technical Setup: Liquidity Sweep, Fair Value Gap Fill & Supply Zone Rejection Setup EURUSD Short Euro vs US Dollar

EURUSD H1 Technical Setup: Liquidity Sweep, Fair Value Gap Fill & Supply Zone Rejection Setup

EUR/USD on the 1-hour timeframe is currently executing a classic Smart Money Concepts (SMC) expansion pattern. Following a sweep of Buy-Side Liquidity and a trendline liquidity grab, price is turning bullish in the short term toward a higher-timeframe Supply Zone before anticipating a major bearish expansion. Key Technical Elements Buy-Side Liquidity Sweep: Price broke above previous local highs around $1.1625–$1.1635, engineering liquidity before sweeping downward to clear out weak long stop losses. Fair Value Gap (FVG) Mitigation: The pair tapped into a significant 1-hour Fair Value Gap spanning between $1.1620 and $1.1640, using this imbalance zone as temporary support/resistance confluence. Trendline Liquidity Breakout: The descending liquidity trendline has been broken upward
XAUUSD (Gold) M15 Breakdown: Symmetrical Triangle Breakdown & Bearish Retest Setup XAUUSD Short Gold vs US Dollar

XAUUSD (Gold) M15 Breakdown: Symmetrical Triangle Breakdown & Bearish Retest Setup

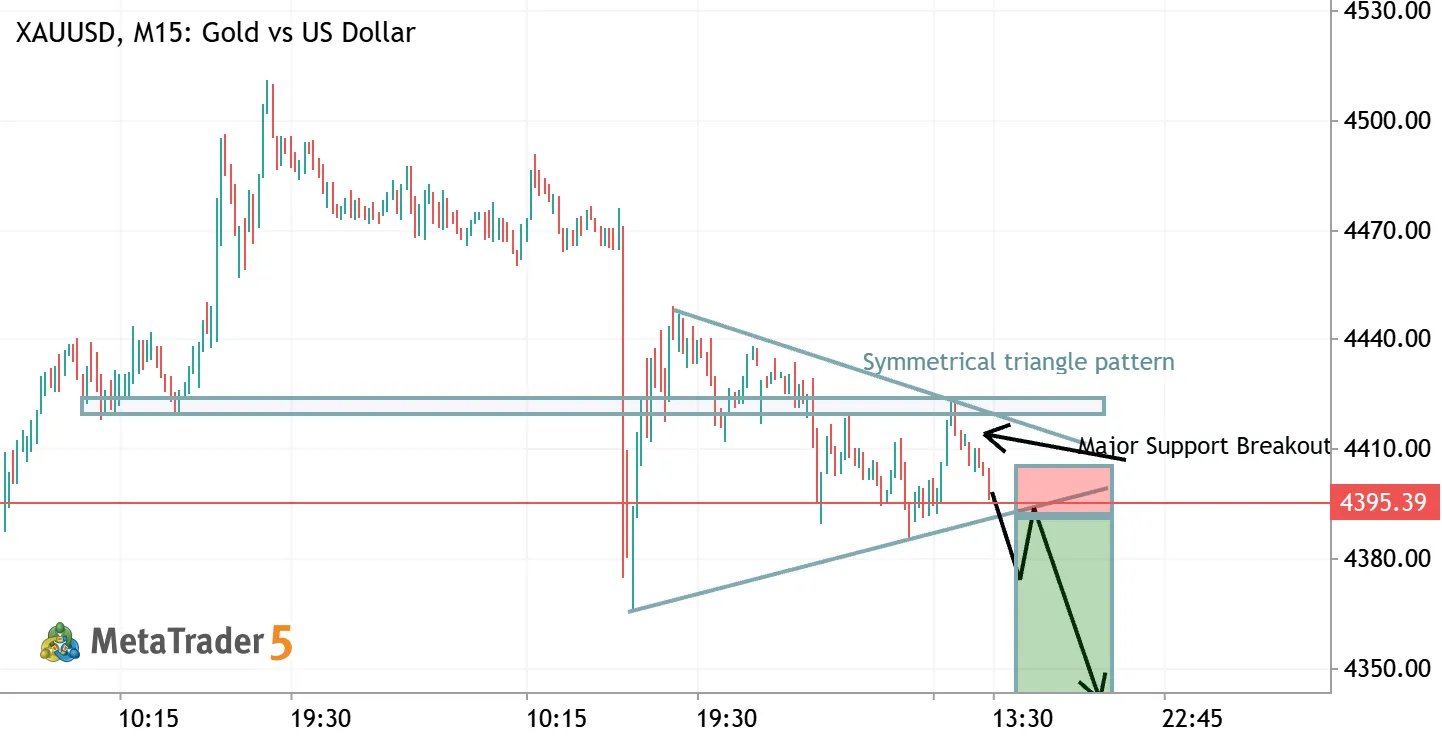
Gold is showing a clean technical continuation pattern on the 15-minute timeframe following a period of consolidation. Below is a breakdown of the structural setup and key levels to monitor: Technical Analysis Pattern Breakout: Price has been coiling inside a Symmetrical Triangle Pattern following a sharp drop. It recently broke through lower support near the $4,395 level. Support Flip: The region between $4,415 – $4,425 previously served as major support. With the recent breakdown below the triangle's rising boundary line, this area now reinforces a strong overhead resistance zone. Price Projection: The projected path indicates a retest of the broken lower trendline/resistance zone near $4,395 before a potential continuation lower toward the $4,350–$4,360 target zone. Potential Short
XAGUSD (Silver) M15 Setup: Major Resistance Reject & Bullish Order Block Target Zone XAGUSD Short Silver vs US Dollar

XAGUSD (Silver) M15 Setup: Major Resistance Reject & Bullish Order Block Target Zone

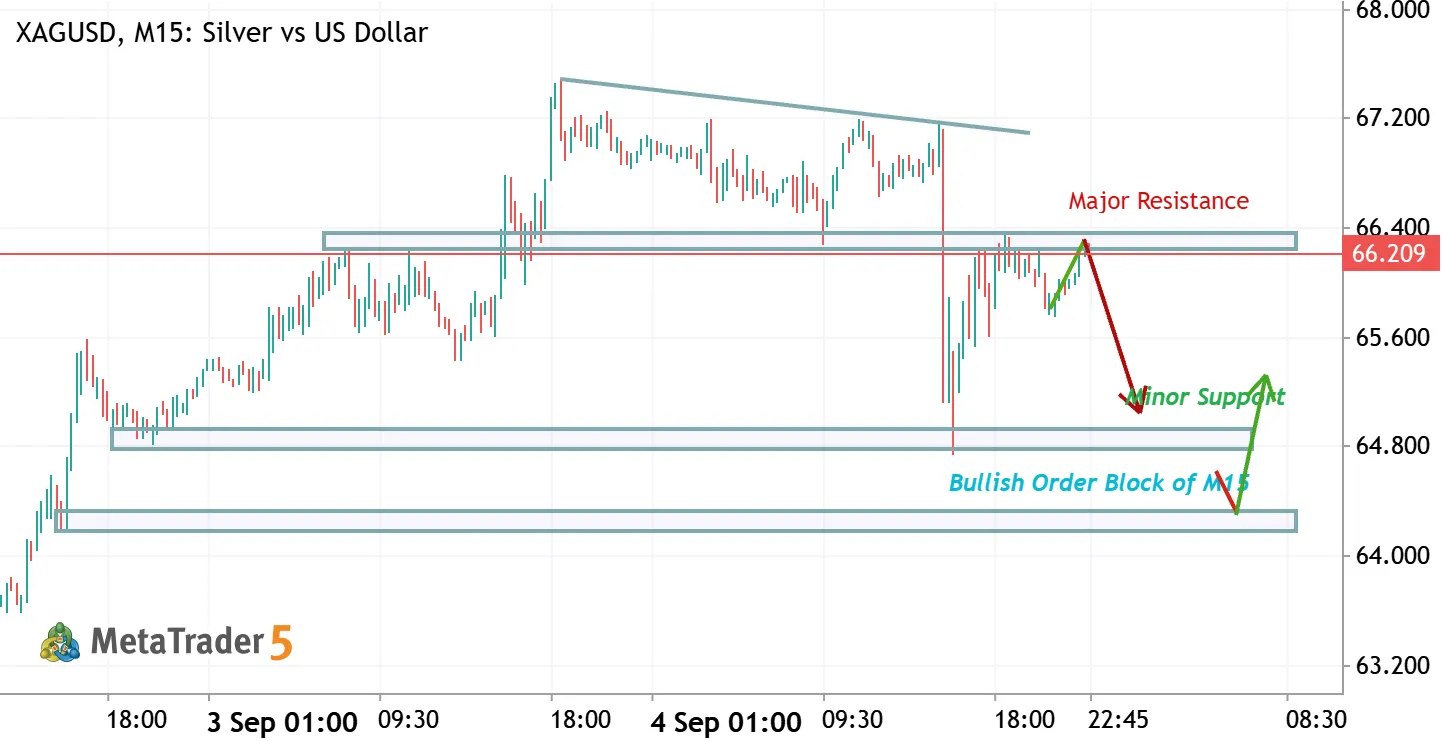
Hey everyone, Taking a look at XAGUSD on the M15 timeframe today. We’re seeing a clean structural setup unfold after a liquidity sweep and rapid drop. Current Market Dynamics: Major Resistance ($66.20 - $66.40): Price bounced back to retest the prior support-turned-resistance zone after the sharp decline from the $67.30 highs. Short-Term Bearish Outlook: Rejection at $66.20 opens up a drop toward Minor Support around $65.00 . Bullish Order Block Target ($64.25 - $64.40): The primary demand zone lies lower. If price sweeps into this M15 Bullish Order Block, look for buyer absorption and a potential reversal setup to trigger long trades. Algorithmic Trading / EA Logic Notes: If you are coding an Expert Advisor (EA) or script for this structure: Filter Rule: Require an M15 candle close below
BTC/USD Hourly Technical Update: Reclaiming the 79.6k Support Zone for a Push Toward 82.4k BTCUSD Long Bitcoin vs US Dollar

BTC/USD Hourly Technical Update: Reclaiming the 79.6k Support Zone for a Push Toward 82.4k

Bitcoin is showing strong signs of stabilization after a quick liquidity sweep following its recent rally. Here is a breakdown of what the 1-hour chart is telling us right now: Technical Breakdown Trendline Break & Impulsive Expansion: Bitcoin broke out of its initial downward trendline around the $77,000 level, driving a strong impulsive move up to test resistance near $81,600–$82,000. Flag Consolidation & Liquidity Grab: Following that strong move up, price consolidated into a classic bullish flag/channel structure. After a sharp dip swept recent low-liquidity areas down to roughly $78,500, price aggressively bounced back into the demand range. Key Support Level: The price is currently hovering around $79,656 , right at a major horizontal flip zone that previously acted as
XAUUSD (Gold) H1 Technical Analysis XAUUSD Short Gold vs US Dollar

XAUUSD (Gold) H1 Technical Analysis

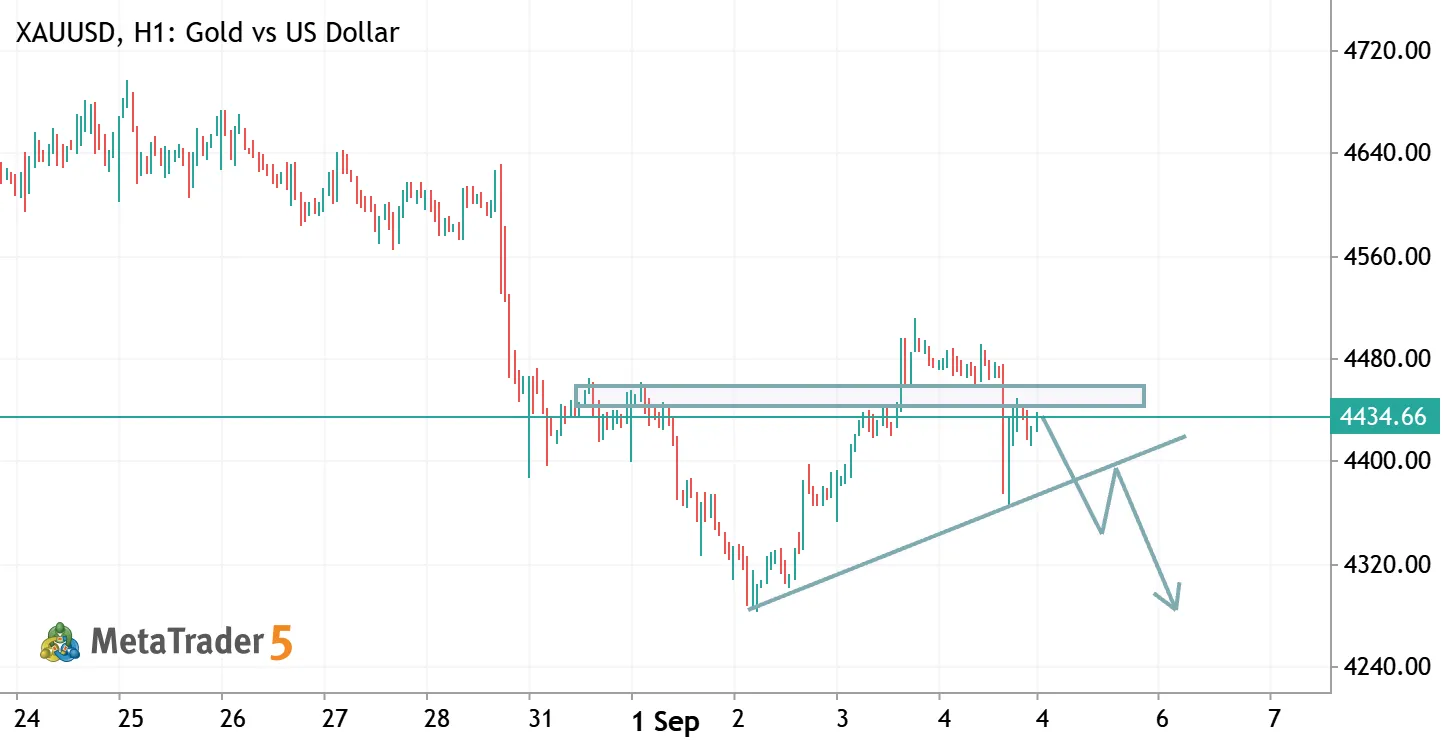
XAUUSD (Gold) H1 Technical Analysis The H1 chart of Gold against the US Dollar shows a bearish structural breakdown following a rejection from the key resistance zone. After a sharp sell-off from the 4600.00–4700.00 region, price consolidated before breaking above the horizontal supply zone near 4450.00–4460.00 to sweep liquidity. However, price failed to sustain higher levels and aggressively dropped back below the 4450.00 resistance level (currently trading around 4434.66). The visual forecast illustrates a potential retest of the ascending trendline/support zone, followed by a pullback retest of the broken trendline, before continuing the downward movement toward the major demand level near 4300.00. Hypothetical Signal Idea (Educational Setup) Direction: Sell / Short Entry Zone: 4430.00
GOLD (XAU/USD) MACRO RALLY & HEAVY RESISTANCE REJECTION SETUP XAUUSD Short Gold vs US Dollar

GOLD (XAU/USD) MACRO RALLY & HEAVY RESISTANCE REJECTION SETUP

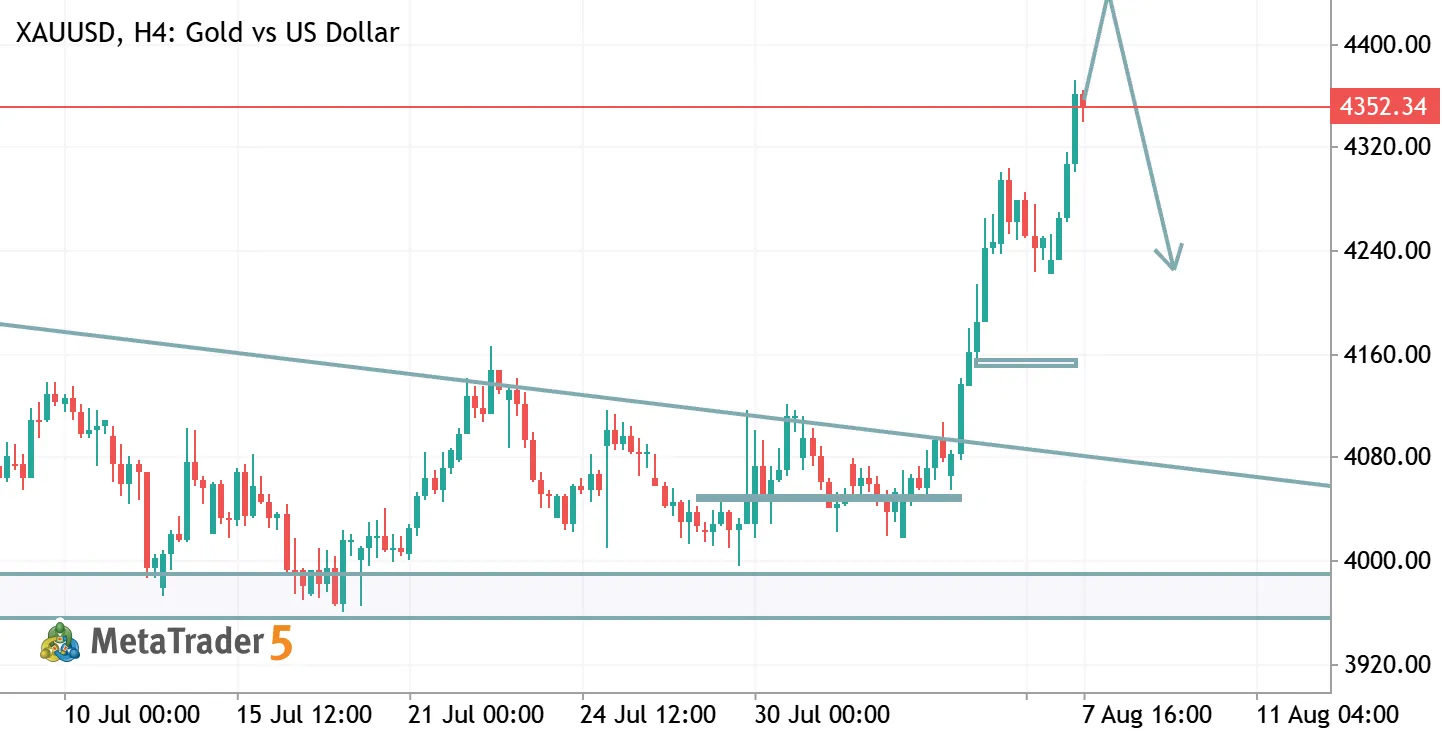
Executive Summary & Macro Narrative Following a soft US Non-Farm Payrolls (NFP) report showing an unexpected decline in payroll data, weak labor market dynamics have intensified market expectations for aggressive central bank interest rate cuts. The resulting downward pressure on the US Dollar and Treasury yields has fueled a massive macro surge in XAU/USD (Gold) , driving price action directly into a major higher-timeframe resistance supply block around $4,450.00 on the 4-Hour (H4) chart. While the fundamental NFP shock provides immediate bullish momentum toward the $4,450 level, this key structural zone represents strong overhead supply and liquidity. A decisive rejection and drop from this major supply block are projected as buyers take profits and the market seeks to rebalance