

 Открыть профиль на MQL5
Sharing technical analysis and market insights
Focused on price action & smart money concepts
For educational purposes only
Графики и идеи
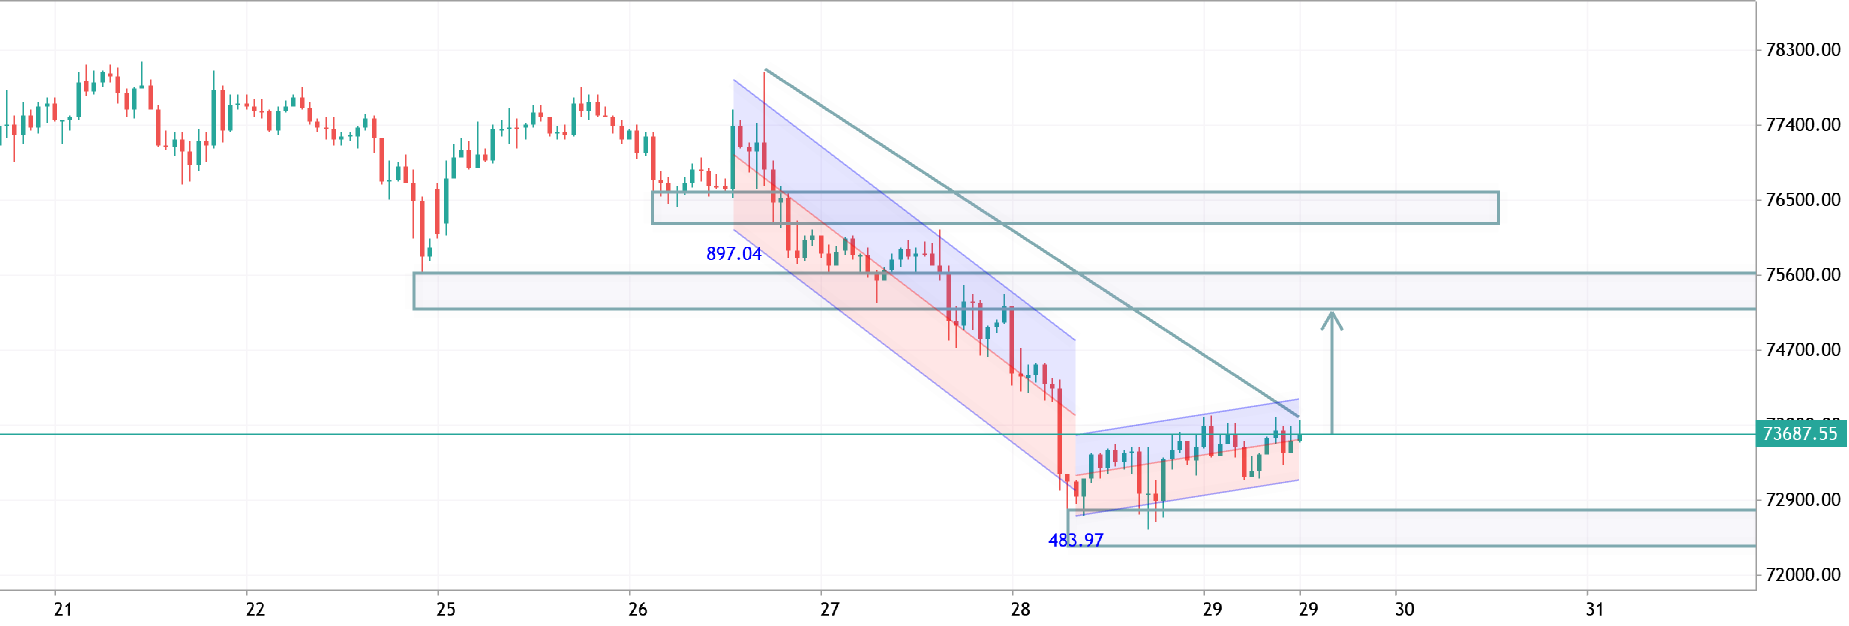
btcusd h1 analysis
BTCUSD is showing signs of bullish recovery after breaking out from the falling channel structure on H1. Price is now holding above key support, and momentum could push the market toward the 75K–76K resistance zone. A successful breakout may trigger stronger upside continuation in the short term. 🚀📈
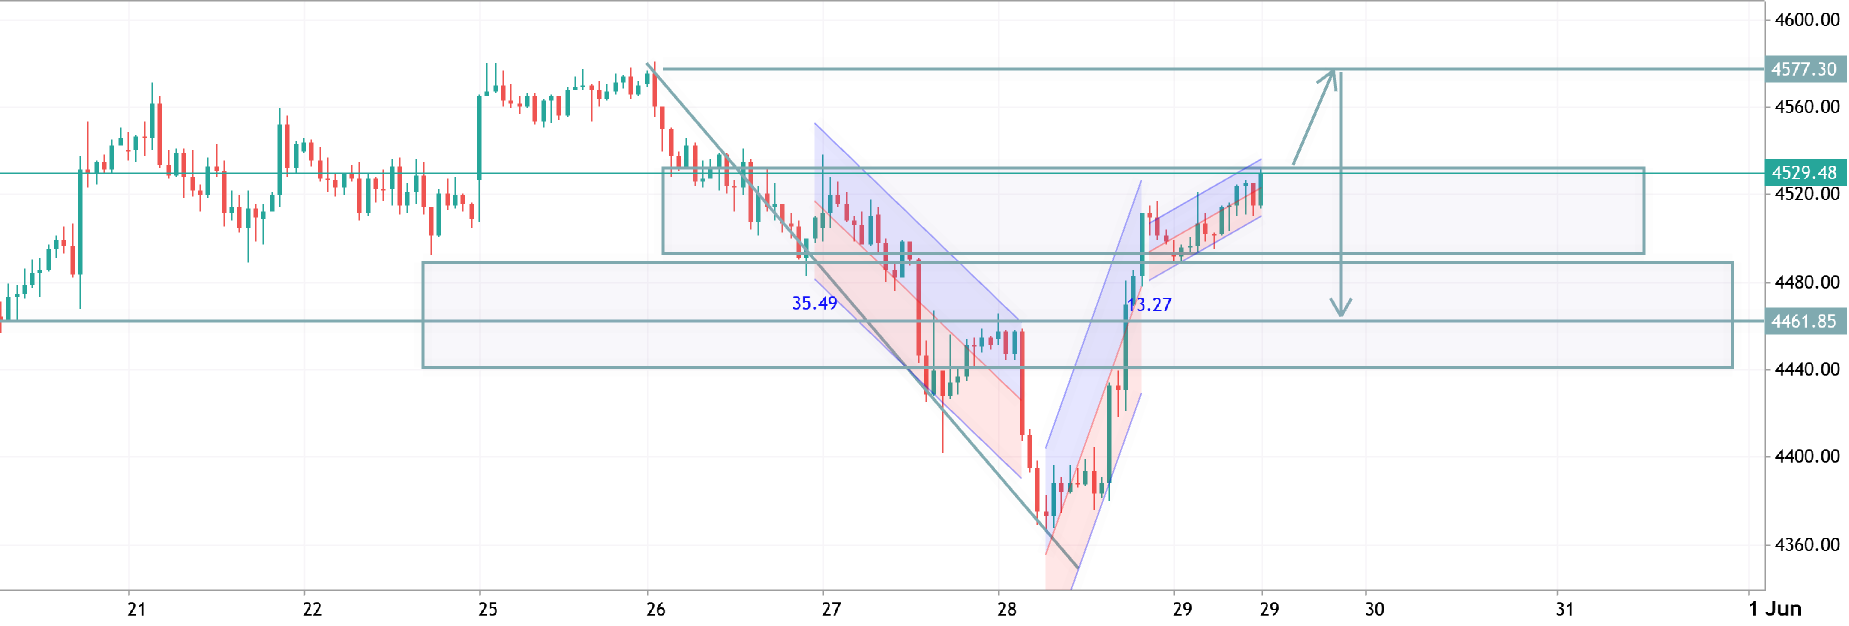
xauusd h1 analysis
XAUUSD is approaching a key resistance zone around 4525–4530. Price action remains bullish after the sharp reversal from support, but rejection from this area could trigger a short-term correction toward 4460–4440 before the next move. A clean breakout above resistance may continue the rally with strong momentum. 📈🔥
btcusd h1 analysis
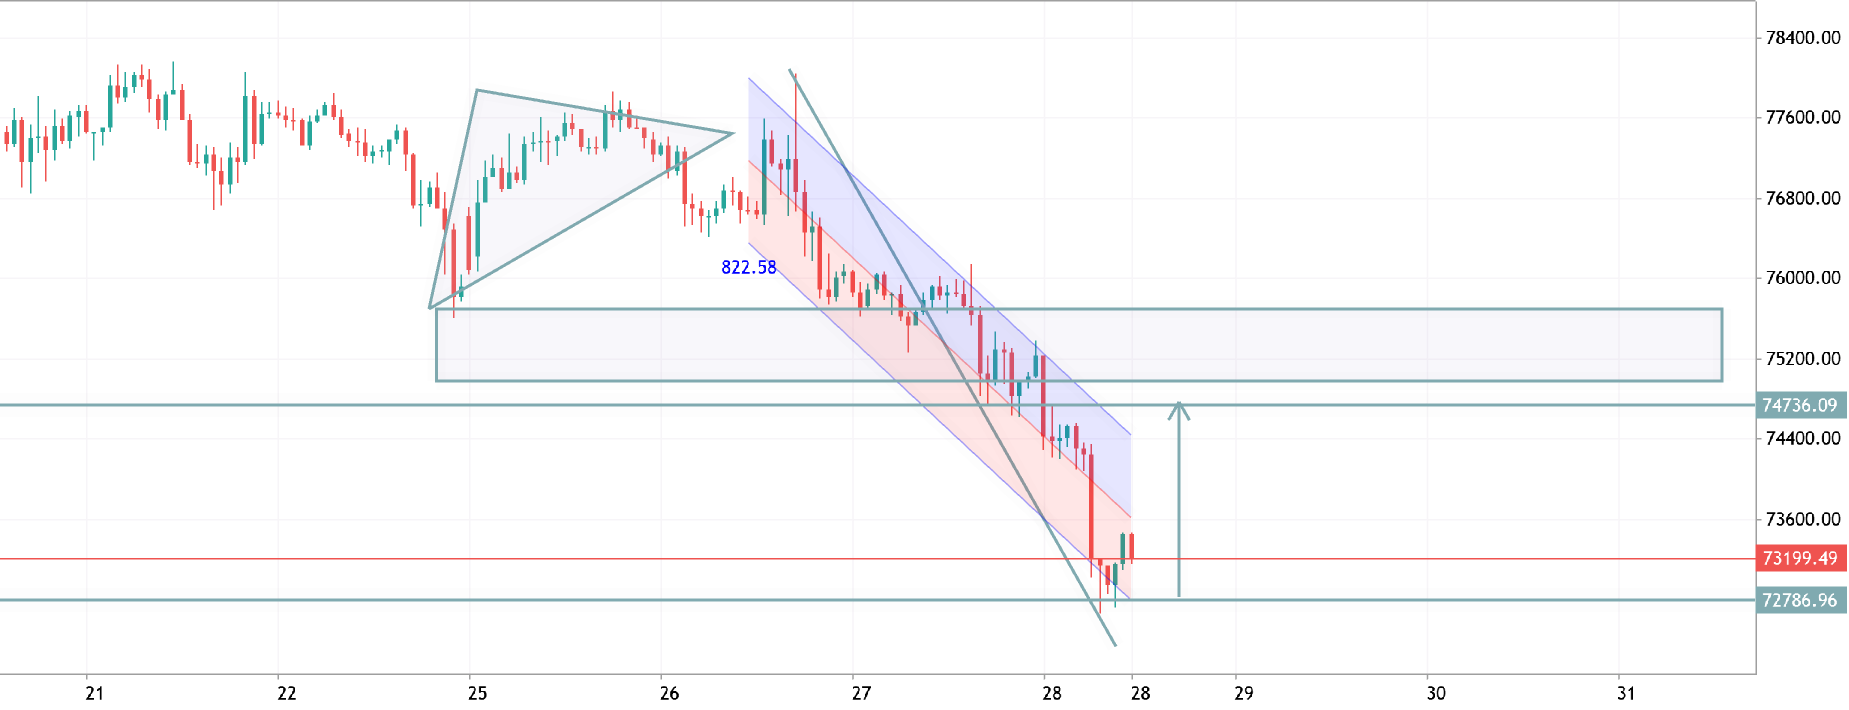
BTCUSD H1 Analysis 📊
Price is recovering after a sharp bearish move inside the descending channel. A bullish correction is developing from the support zone, with buyers targeting the 74,400 – 75,200 resistance area.
🔹 Support: 72,786 🔹 Resistance: 74,400 – 75,200 🔹 Bias: Bullish recovery while above support
A breakout above the channel could trigger stronger upside momentum in the short term.
xauusd h1 analysis
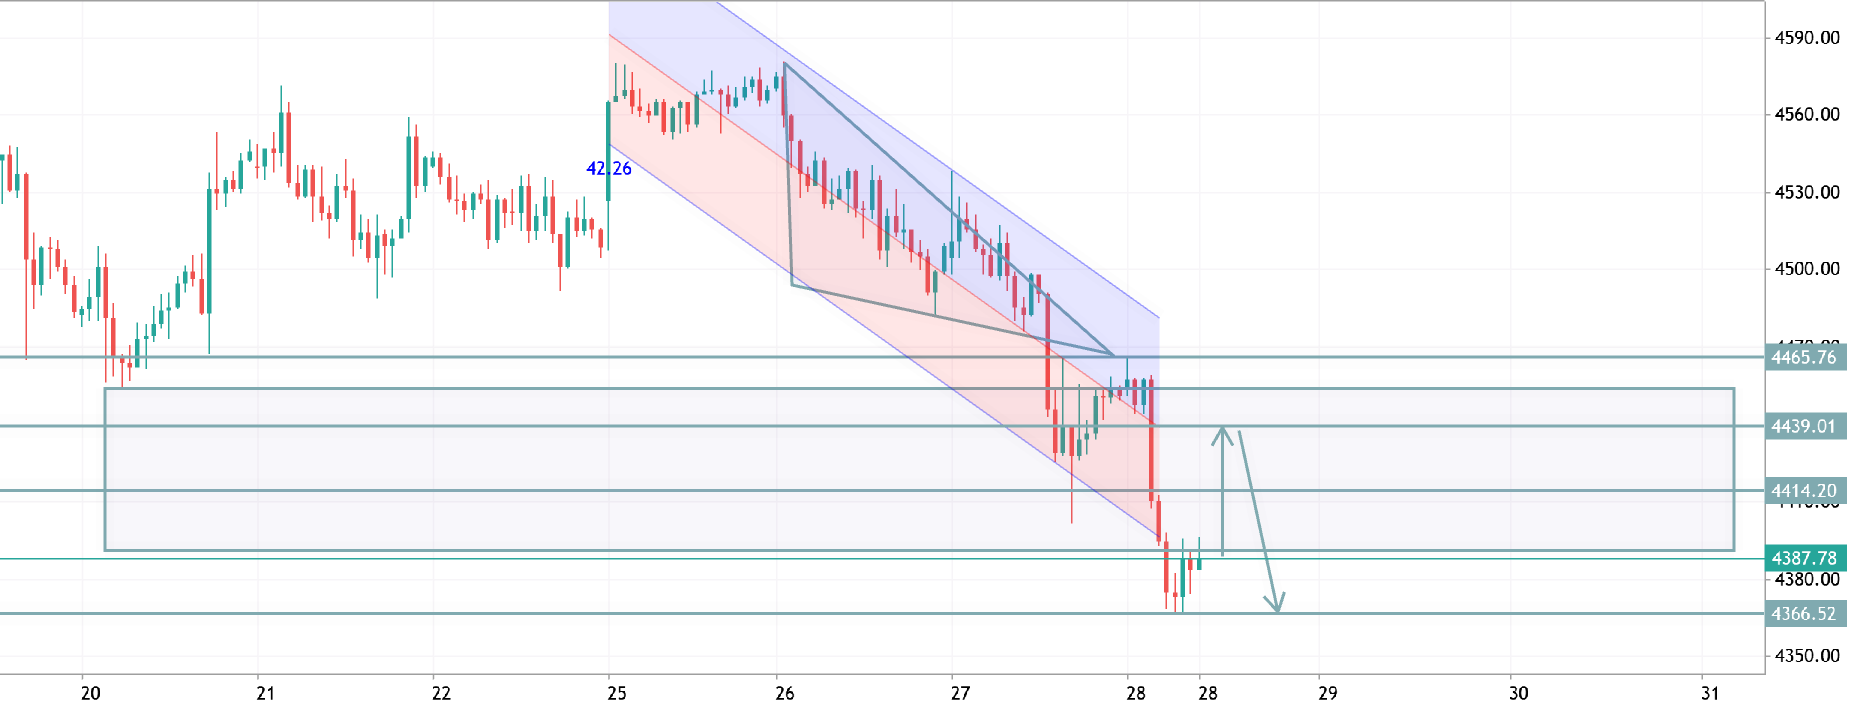
XAUUSD H1 Analysis 📉
Gold is still trading inside a bearish channel after a strong rejection from resistance. Price is now reacting around the 4387–4391 zone. A short-term pullback is possible, but sellers remain in control unless price breaks above the channel resistance.
🔹 Resistance: 4391 – 4414 🔹 Support: 4365 – 4350 🔹 Bias: Bearish below 4414
Watch for rejection confirmation before the next bearish continuation move.
btcusd h4 analysis
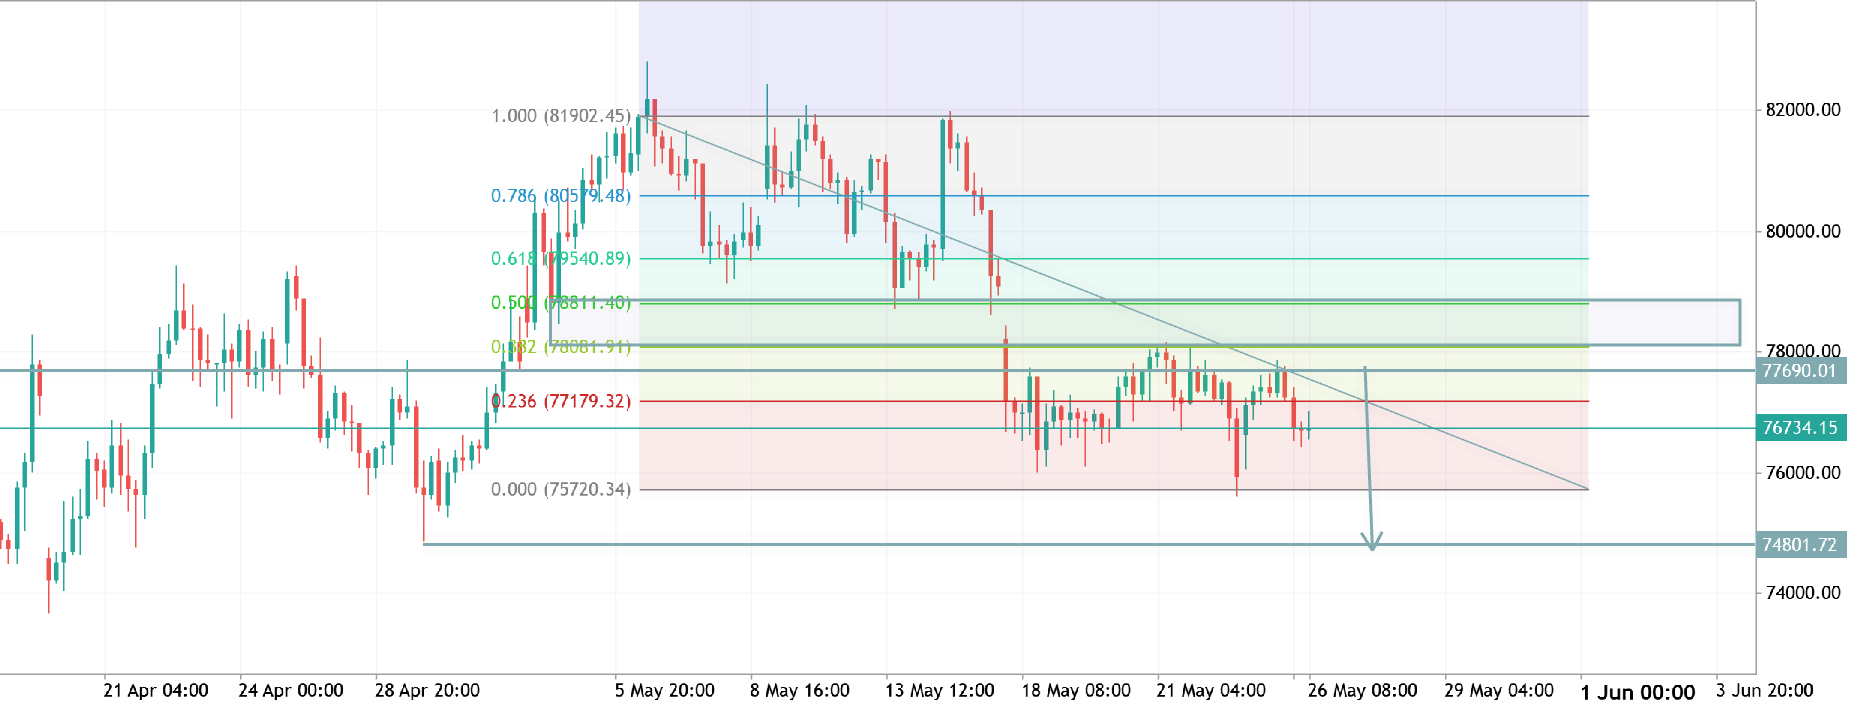
BTCUSD H4 Analysis 📉
Bitcoin remains under bearish pressure while respecting the descending trendline resistance. Price is struggling below the 76900 zone, and a rejection here could trigger a move toward the 74800 support area.
Bears stay in control unless BTC breaks and closes above resistance with strong momentum. ⚡
xauusd h4 analysis
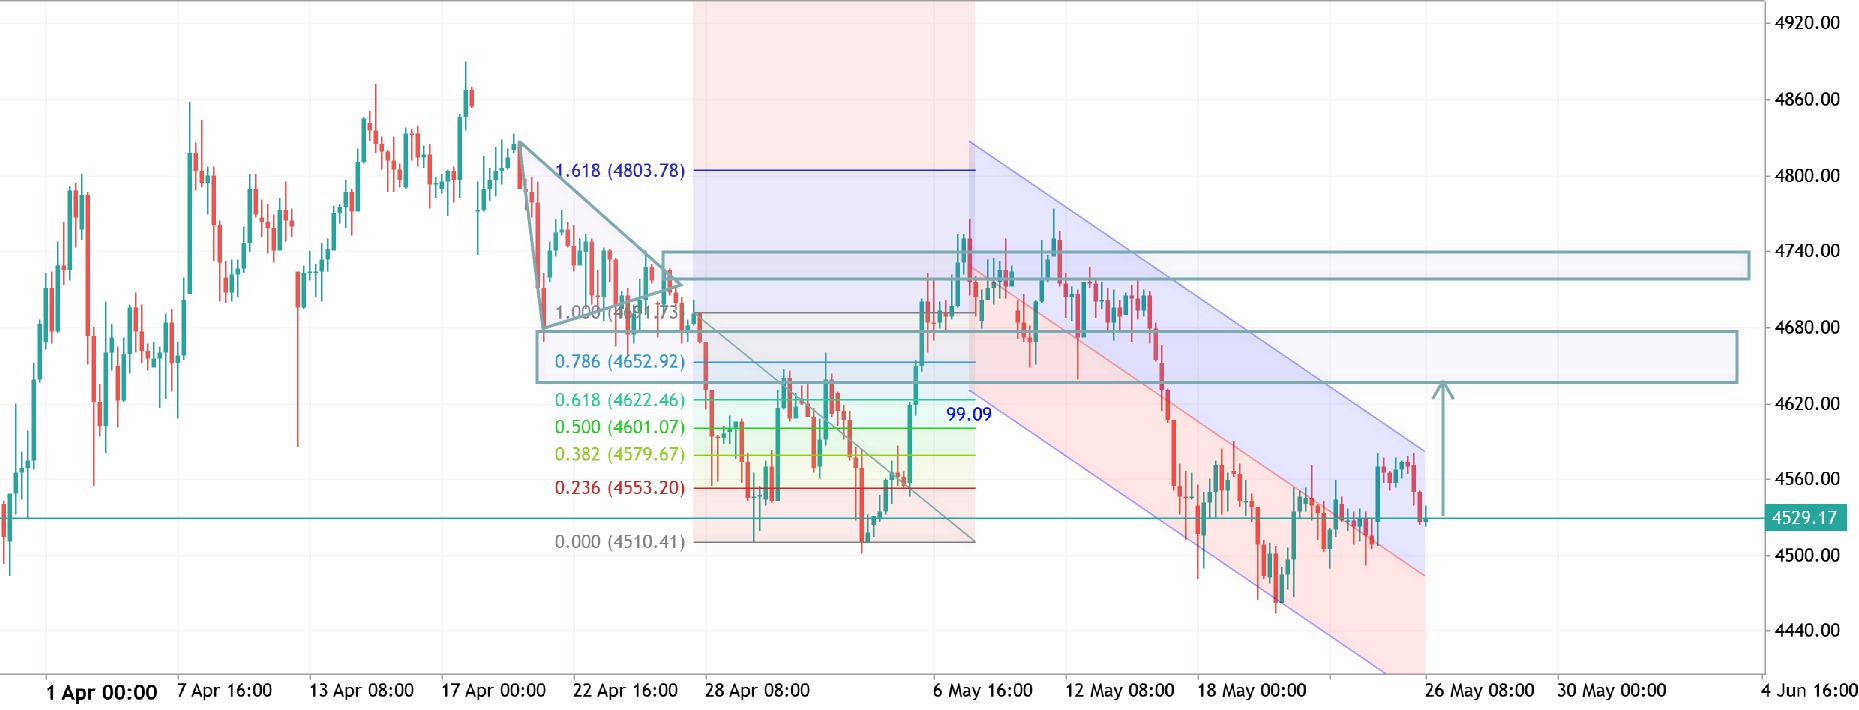
XAUUSD H4 Analysis 📊
Gold is currently reacting from a key support zone after respecting the descending channel structure. Buyers are showing strength near 4500, and a breakout above 4560 could push price toward the 4620–4680 resistance area.
As long as support holds, bullish momentum remains possible. Watch for confirmation before entry. 🔥
btcusd h1 analysis
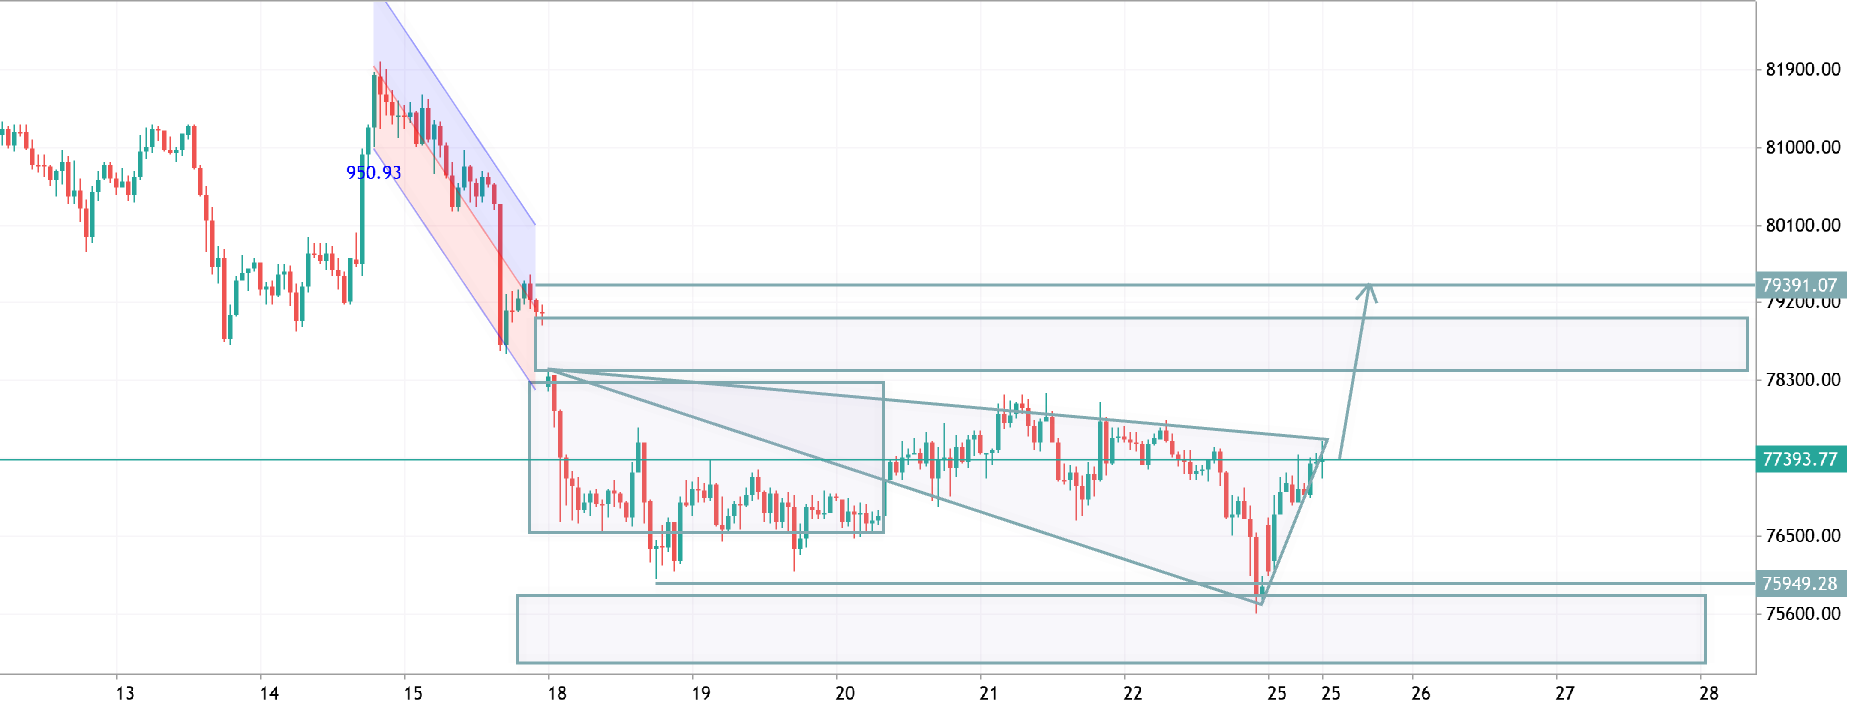
BTC looks ready for a bullish continuation after breaking out of the consolidation structure. Price reacted strongly from support and is now pushing toward the 78.3K–79.3K resistance zone. A clean breakout above this area could open the door for further upside momentum in the coming sessions. 📈
xauusd h4 analysis
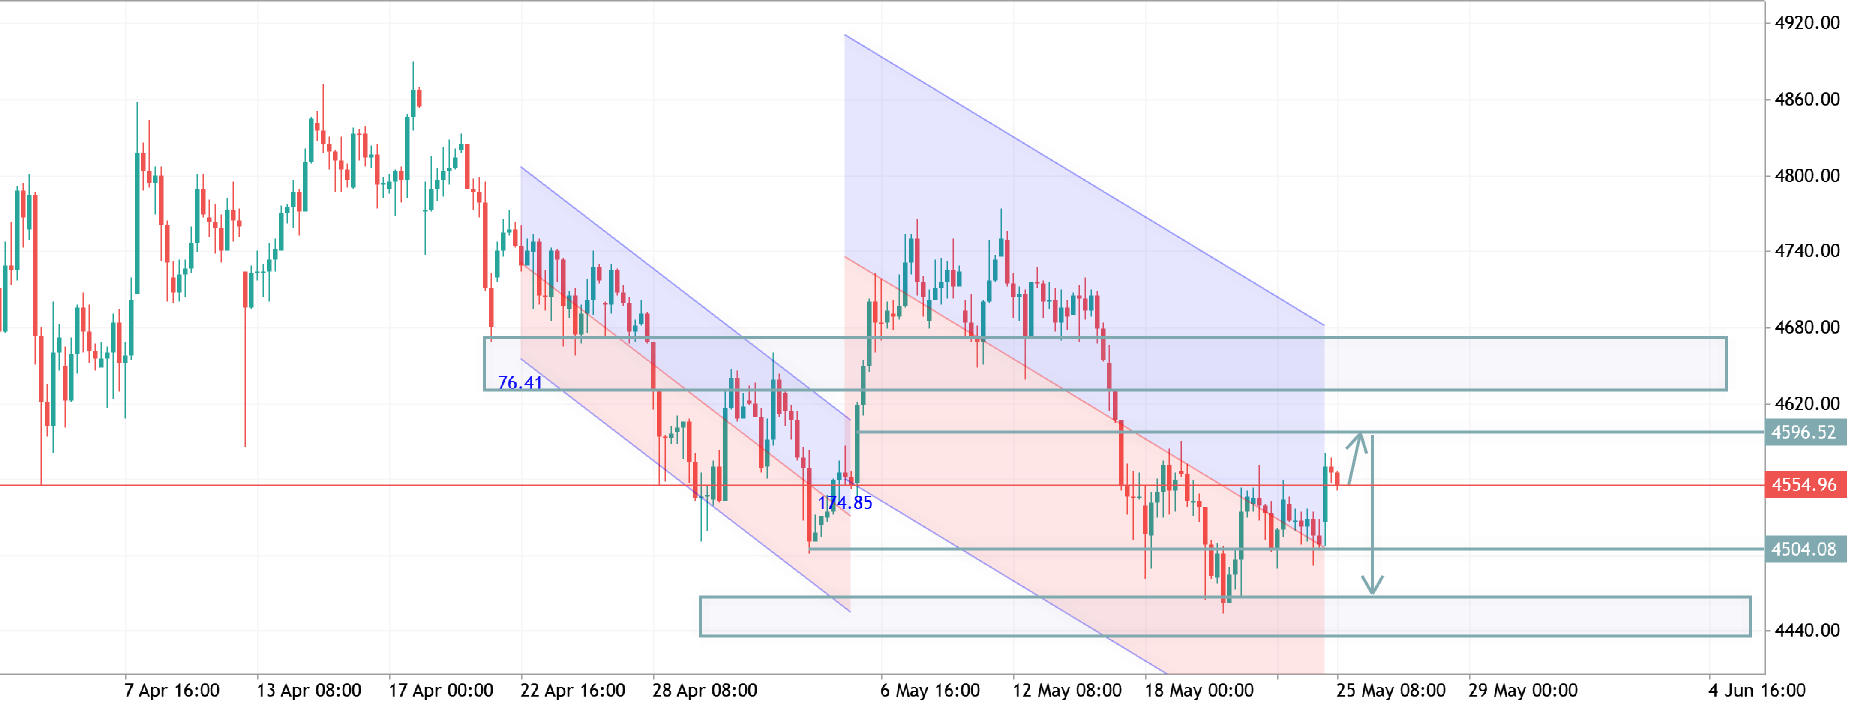
XAUUSD H4 outlook remains bearish inside the descending channel, but price is showing a short-term corrective bounce from support. A rejection near the 4595–4620 resistance zone could trigger another bearish move toward 4450 support. Sellers still control the higher timeframe unless a strong breakout above resistance confirms bullish continuation.
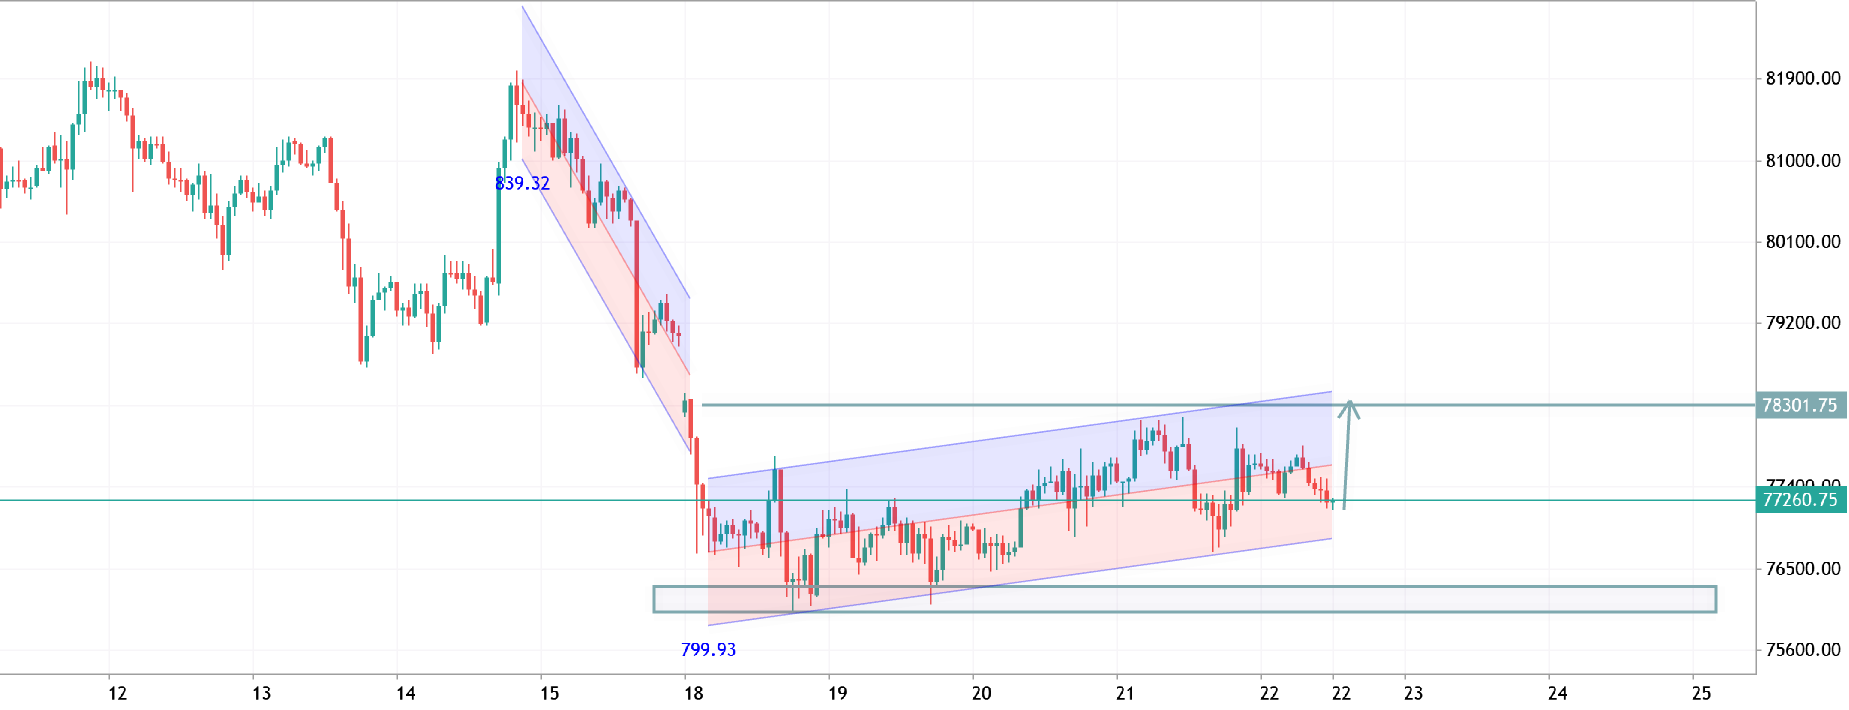
btcusd h1 analysis
BTCUSD H1 Analysis is showing strong recovery momentum after the sharp bearish move. Price is now trading inside a rising channel, with buyers steadily pushing toward the 78.3K resistance zone. A breakout above this level could open the path for further bullish continuation, while the channel support remains the key area to hold for buyers. 📈🔥
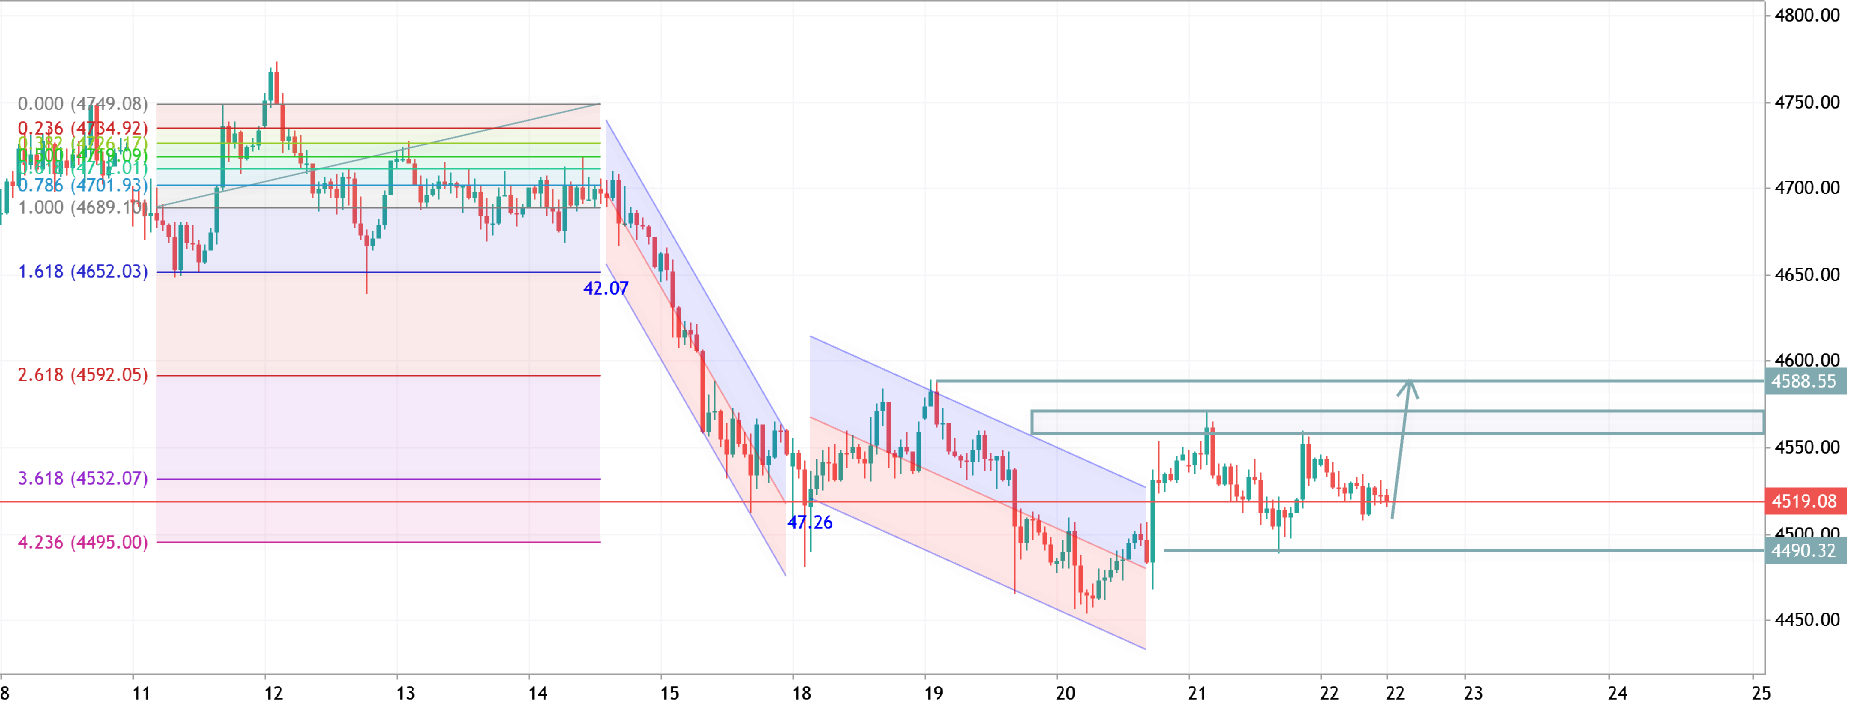
xauusd h1 analysis
XAUUSD H1 Analysis showing a clean bullish recovery after a strong sell-off. Price is respecting the ascending channel and currently testing key resistance around 4515–4520. A confirmed breakout could push momentum toward higher liquidity zones, while holding above support keeps buyers in control. Market structure looks bullish short-term, but patience for confirmation is key before the next move. 📈
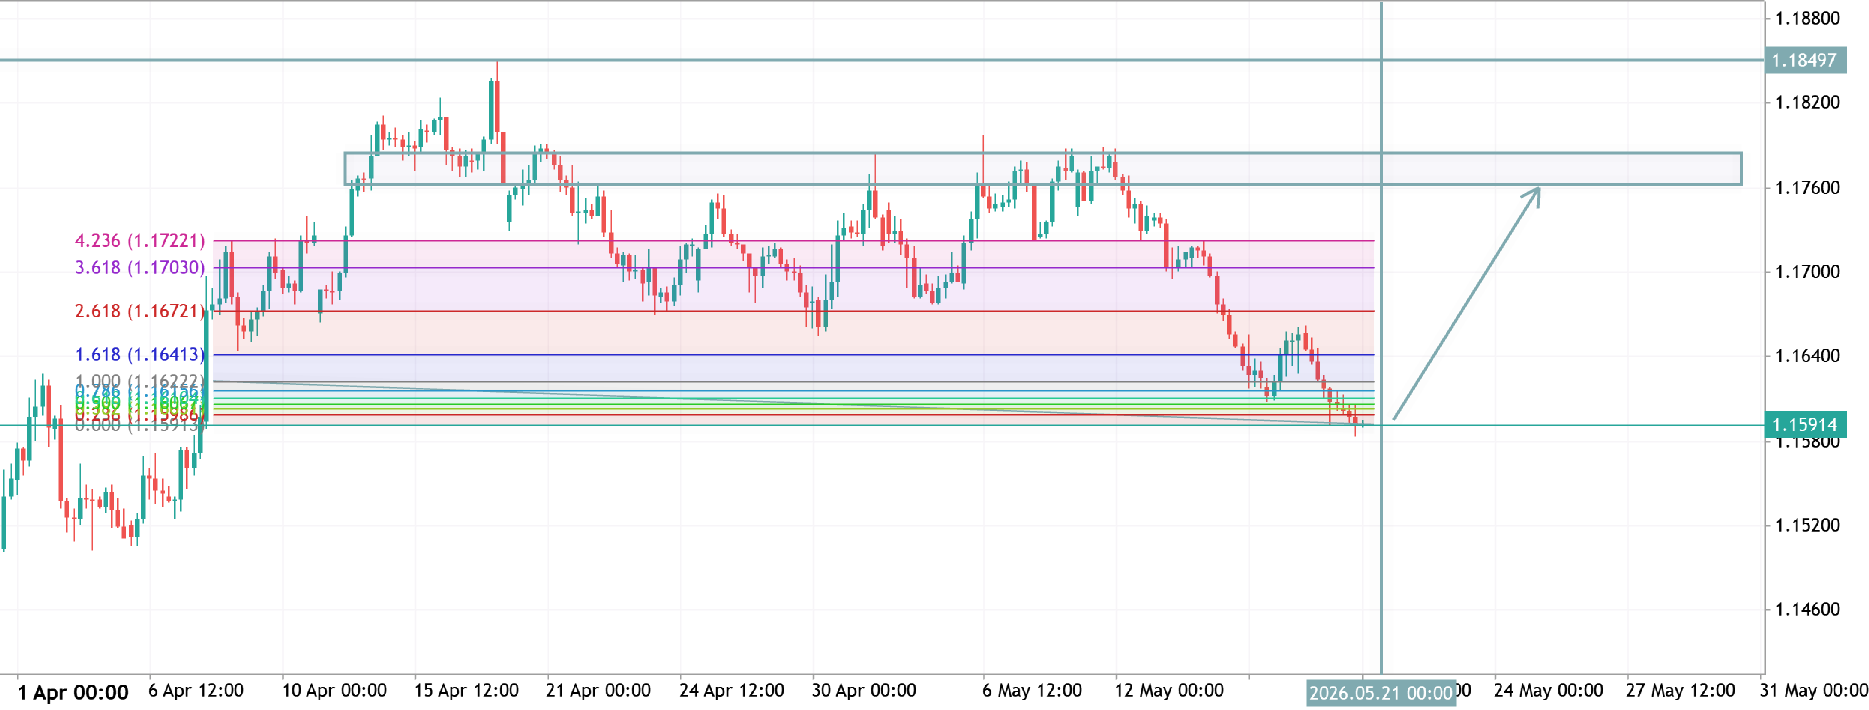
eurusd h4 analysis
EURUSD H4 Analysis 📊
Price tapped a strong demand/support zone around 1.1590 – 1.1560 after a bearish move. Current structure suggests a possible bullish rebound if buyers maintain this area.
🔹 Key resistance: 1.1700 – 1.1760 🔹 Bullish confirmation above minor resistance could trigger continuation upward. 🔹 Bias remains cautiously bullish while price holds above support.
📈 Expected scenario: retracement → bullish momentum toward higher resistance zone. ⚠️ Risk management is essential — wait for confirmation before entry.
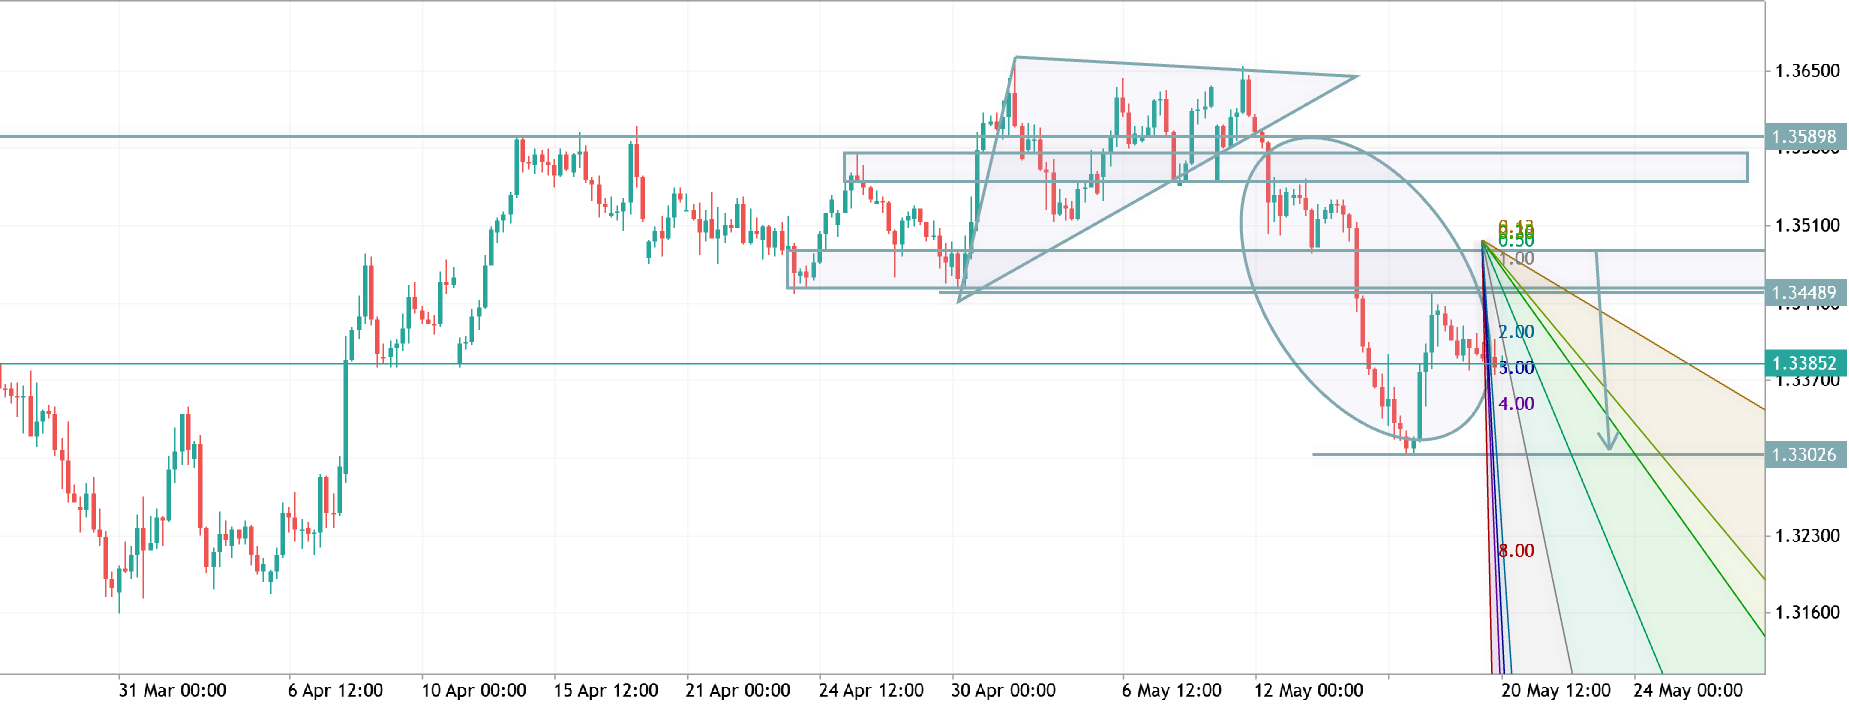
gbpusd h4 analysis
GBPUSD H4 Analysis 📊 Price broke below the ascending structure after multiple rejections from resistance zone. Bearish momentum remains strong while market trades inside a descending channel.
🔹 Resistance Zone: 1.3440 – 1.3520 🔹 Support Targets: 1.3300 – 1.3160 🔹 Bias: Bearish continuation
Possible scenario: A short-term pullback toward resistance is possible before sellers continue targeting lower liquidity areas. Market structure still favors downside pressure. ⚡
#GBPUSD #Forex #PriceAction #SmartMoney #H4Analysis