
Sharing technical analysis and market insights
Focused on price action & smart money concepts
For educational purposes only
Charts & Ideas
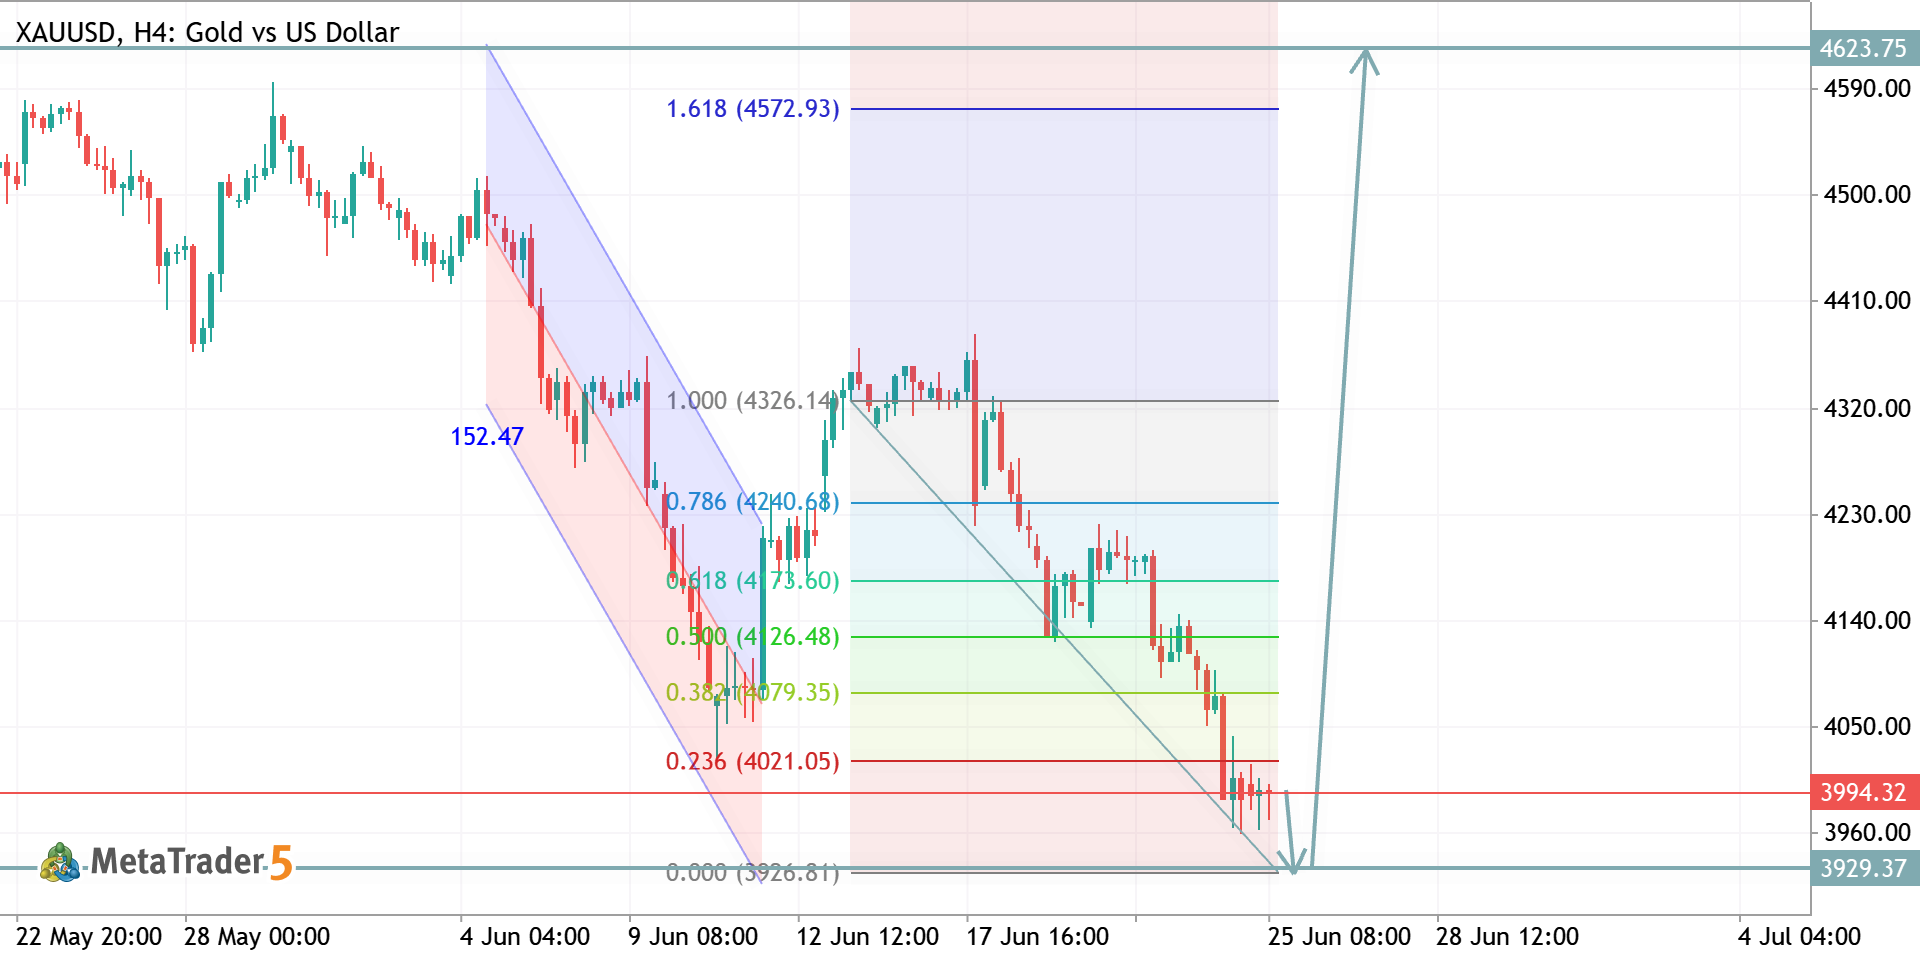
xauusd h4 analysis
XAUUSD H4 Analysis Gold remains under bearish pressure after breaking below key Fibonacci support. Price is currently testing the 3929–4000 demand zone, where a potential liquidity sweep could trigger a strong reversal. 📉 Bearish scenario: A confirmed break below 3929 may extend the decline. 📈 Bullish scenario: Holding above current support could fuel a recovery toward 4327, with an extended target near 4574 (1.618 Fib level). Key Levels: Support: 3929 Resistance: 4327 Bullish Target: 4574 Watch for bullish confirmation before considering long positions. Risk management remains essential.
2026.06.25 08:50 8 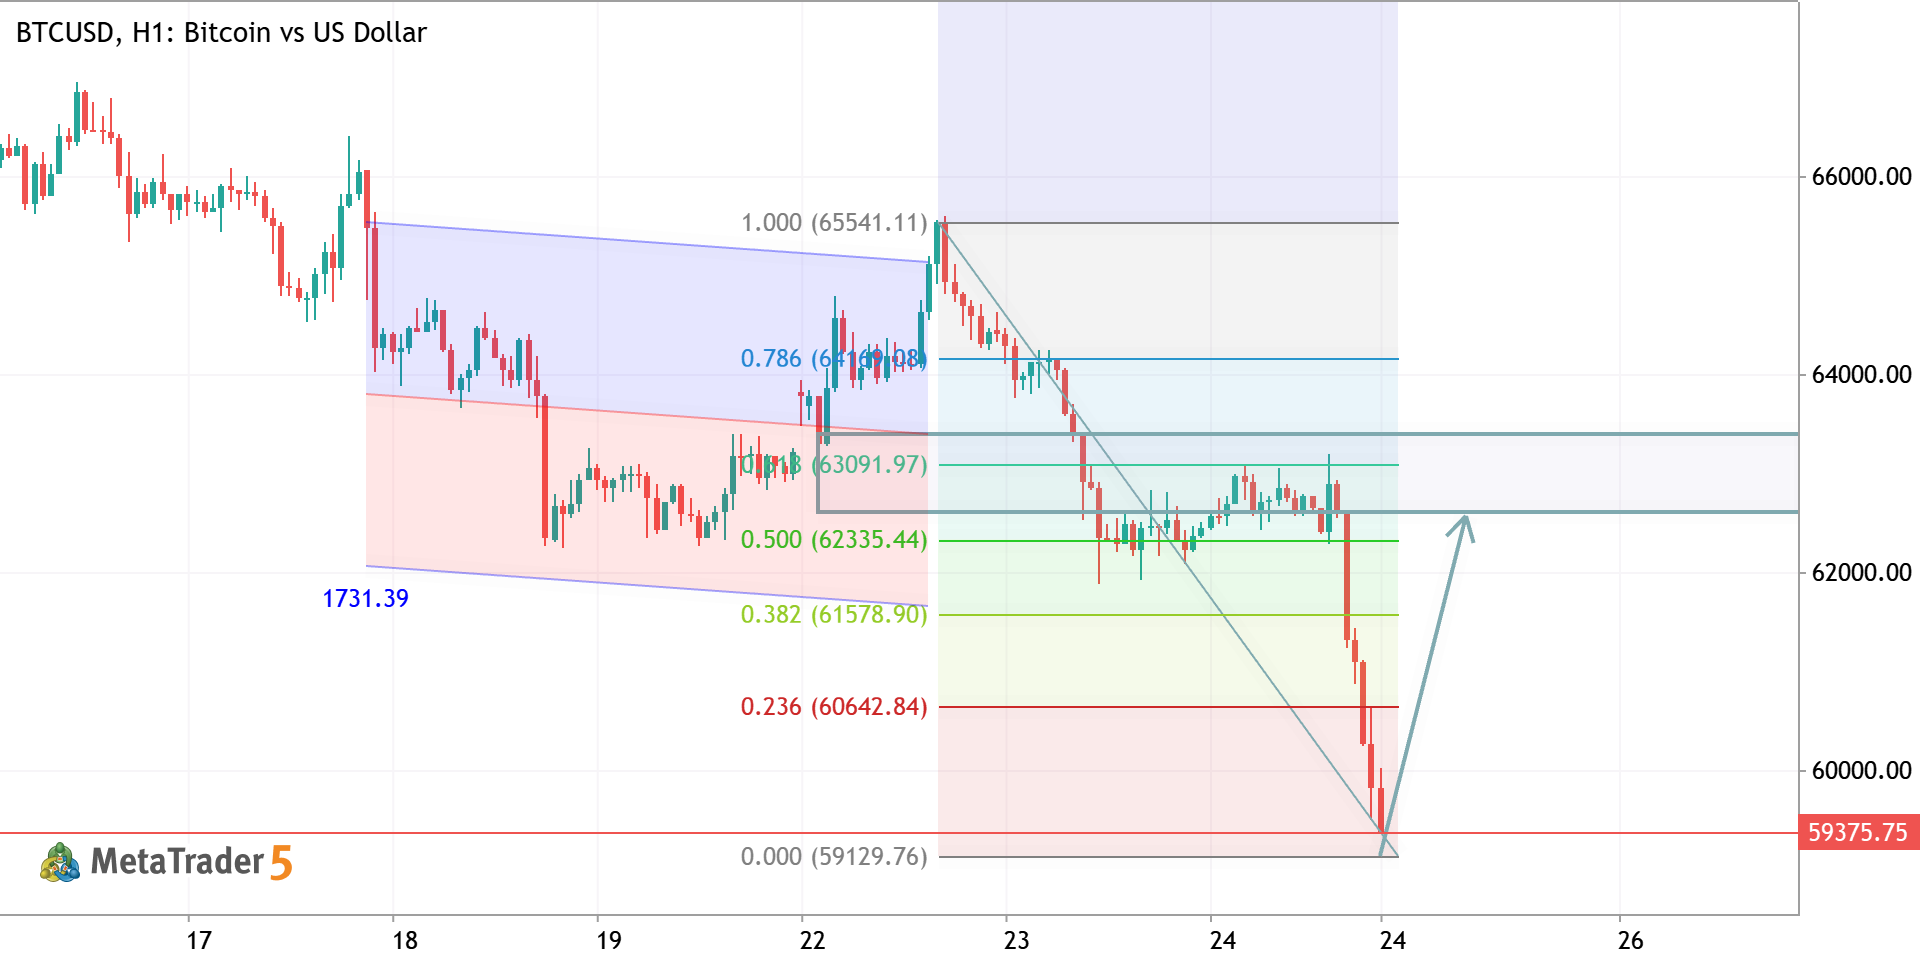
BTCUSD H1 ANALYSIS
BTCUSD H1 Analysis BTCUSD has reached a key support zone after a sharp bearish move. Price is reacting near the Fibonacci retracement support and showing signs of a potential bullish rebound. A successful hold above the current low could trigger a recovery toward the 61.8%–78.6% Fibonacci resistance area. However, a break below support may extend the downtrend. Bias: Bullish Recovery Above Support Key Resistance: 60,500 – 62,300 Key Support: 58,700 – 59,200 Trade with proper risk management. This analysis is for educational purposes only and not financial advice.
2026.06.24 17:50 0 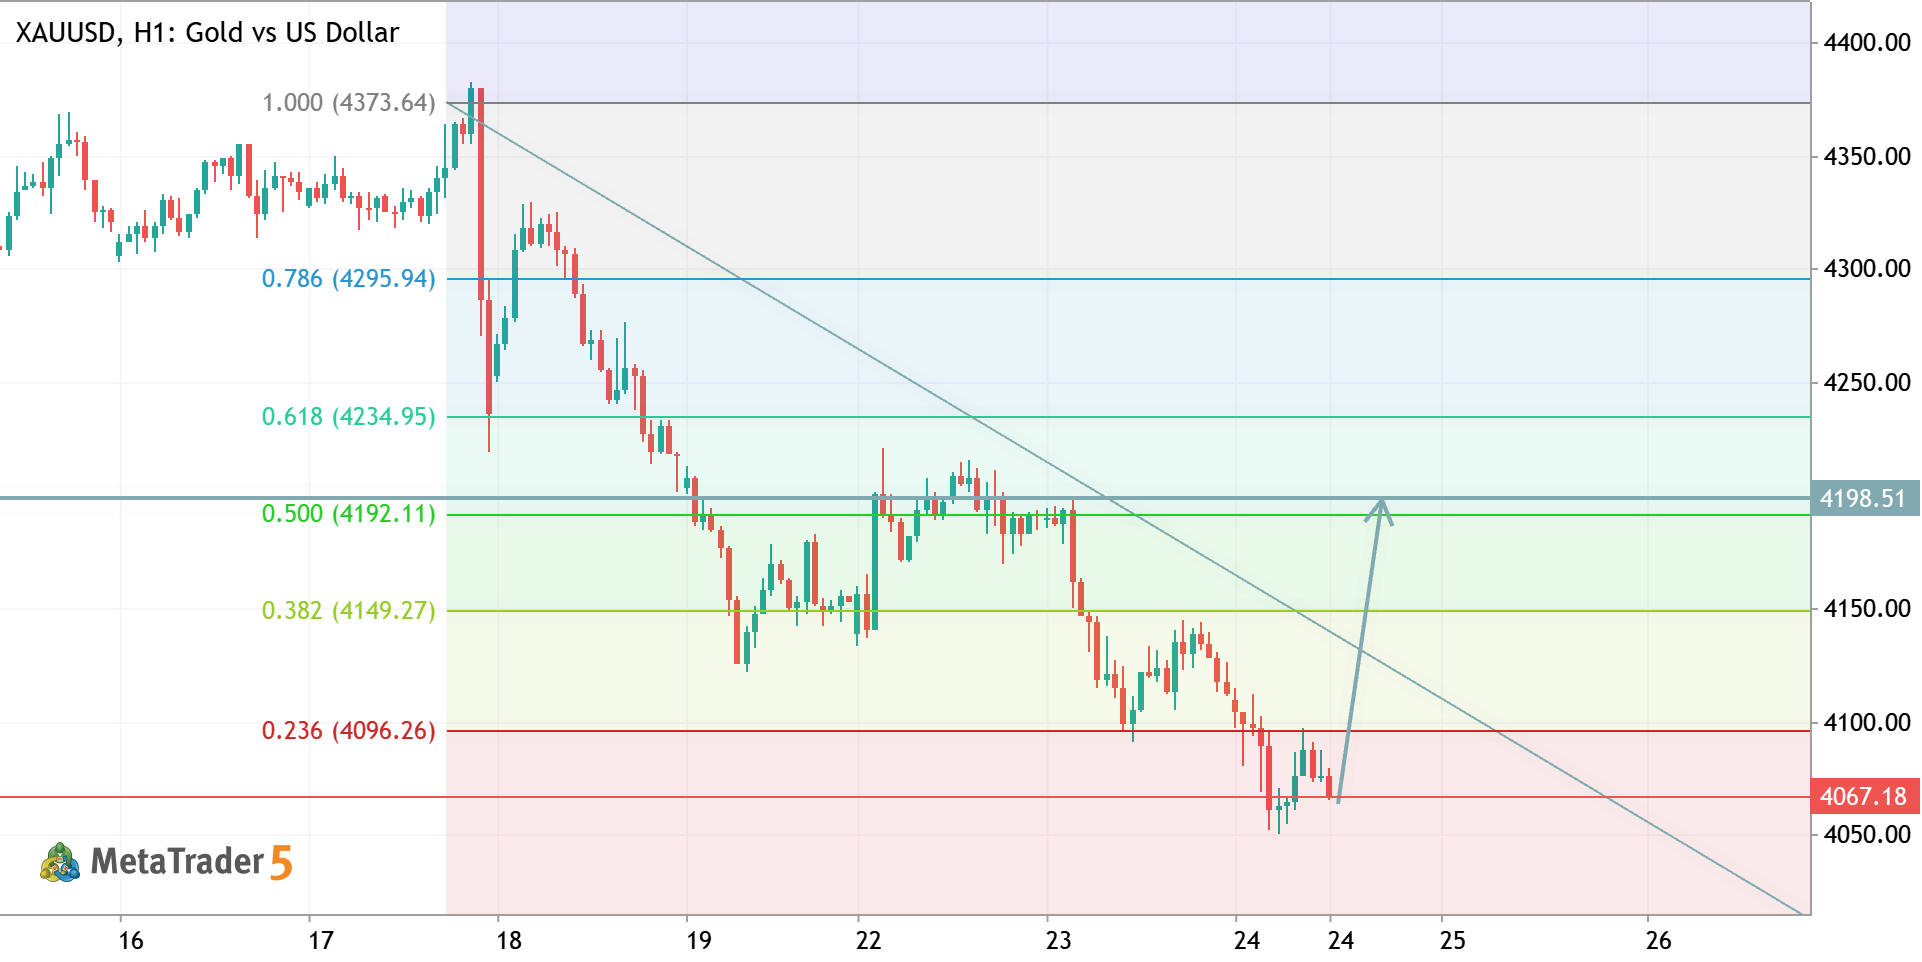
XAUUSD H1 ANALYSIS
XAUUSD H1 Analysis Gold remains under pressure but is approaching a major support zone near 4050. Price is trading below the descending trendline, yet a strong reaction from support could trigger a corrective rally toward the 4190–4235 resistance area. Bias: Bullish Correction Expected Key Support: 4050 – 4020 Key Resistance: 4190 – 4235 Watch for bullish confirmation at support before entering. Proper risk management is essential.
2026.06.24 09:50 1 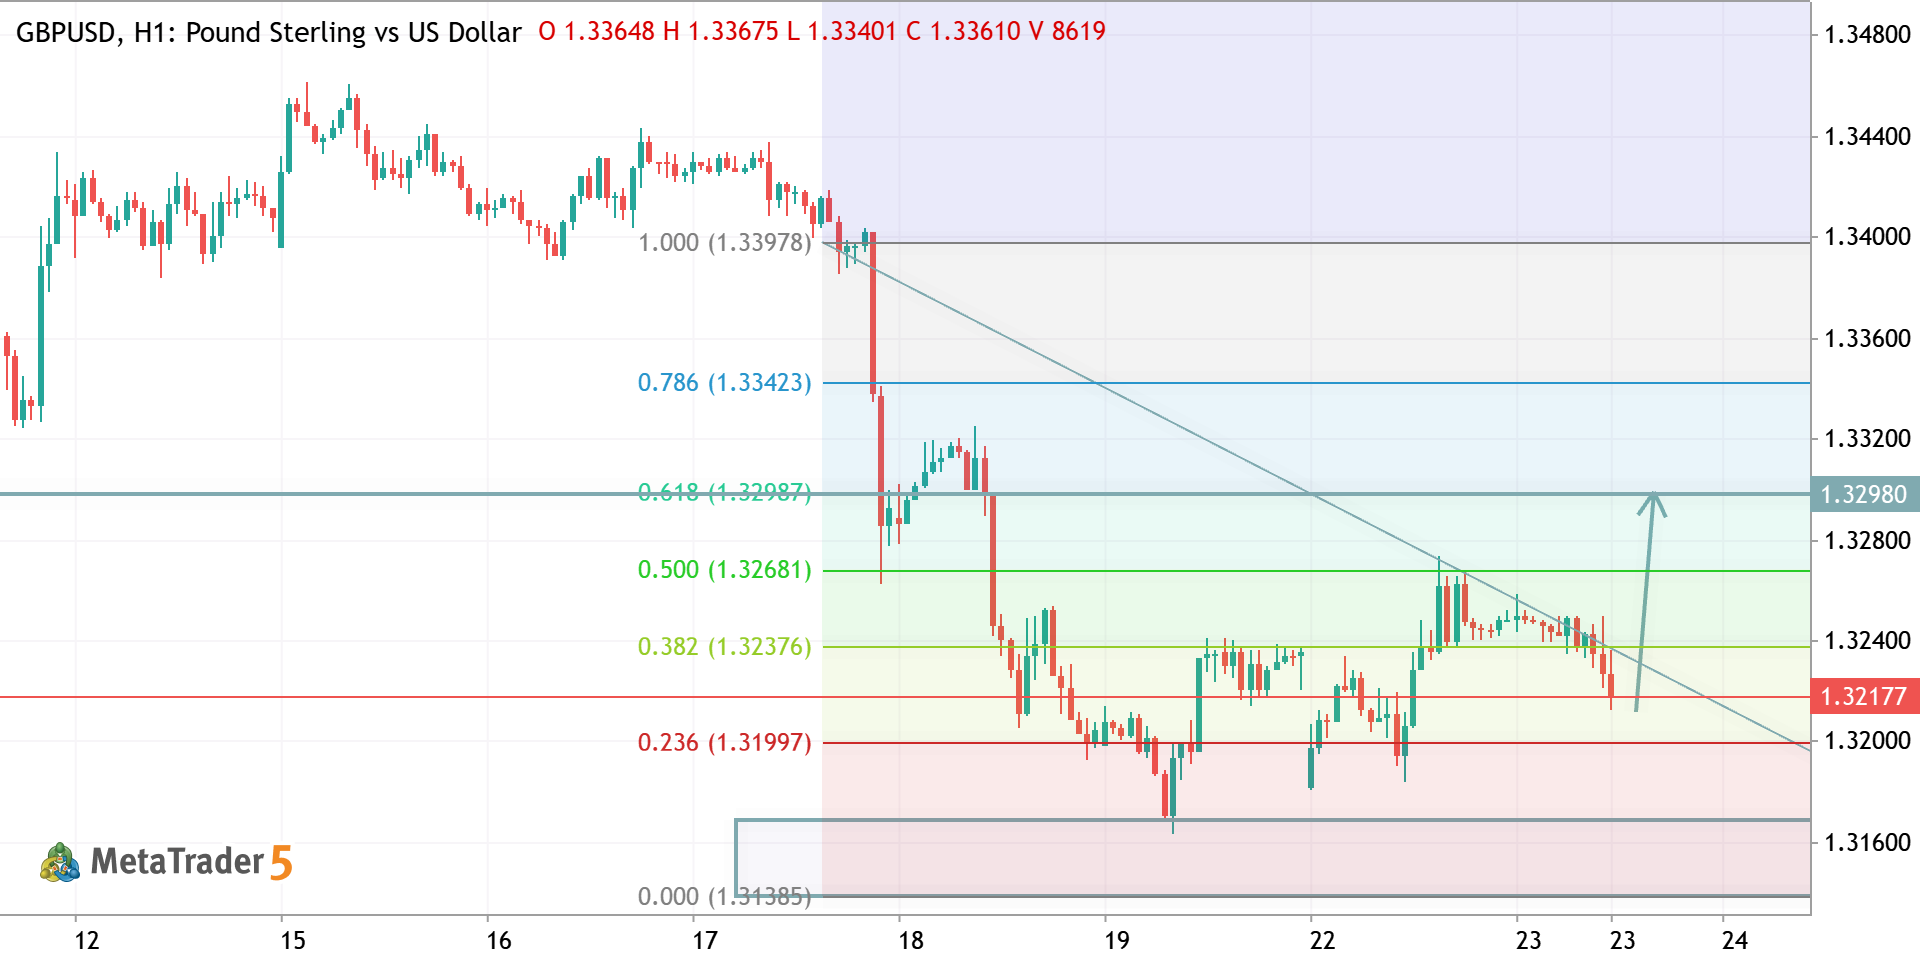
GBPUSD H1 ANALYSIS
GBPUSD H1 Analysis GBPUSD is holding above a key support zone after completing a pullback within a bullish structure. Price is showing signs of recovery, and a break above the recent consolidation could open the way toward the 1.3250–1.3300 resistance area. Bias: Bullish Key Support: 1.3190 – 1.3170 Key Resistance: 1.3250 – 1.3300 Momentum favors buyers while support remains intact. Trade with proper risk management and confirmation.
2026.06.23 08:42 0 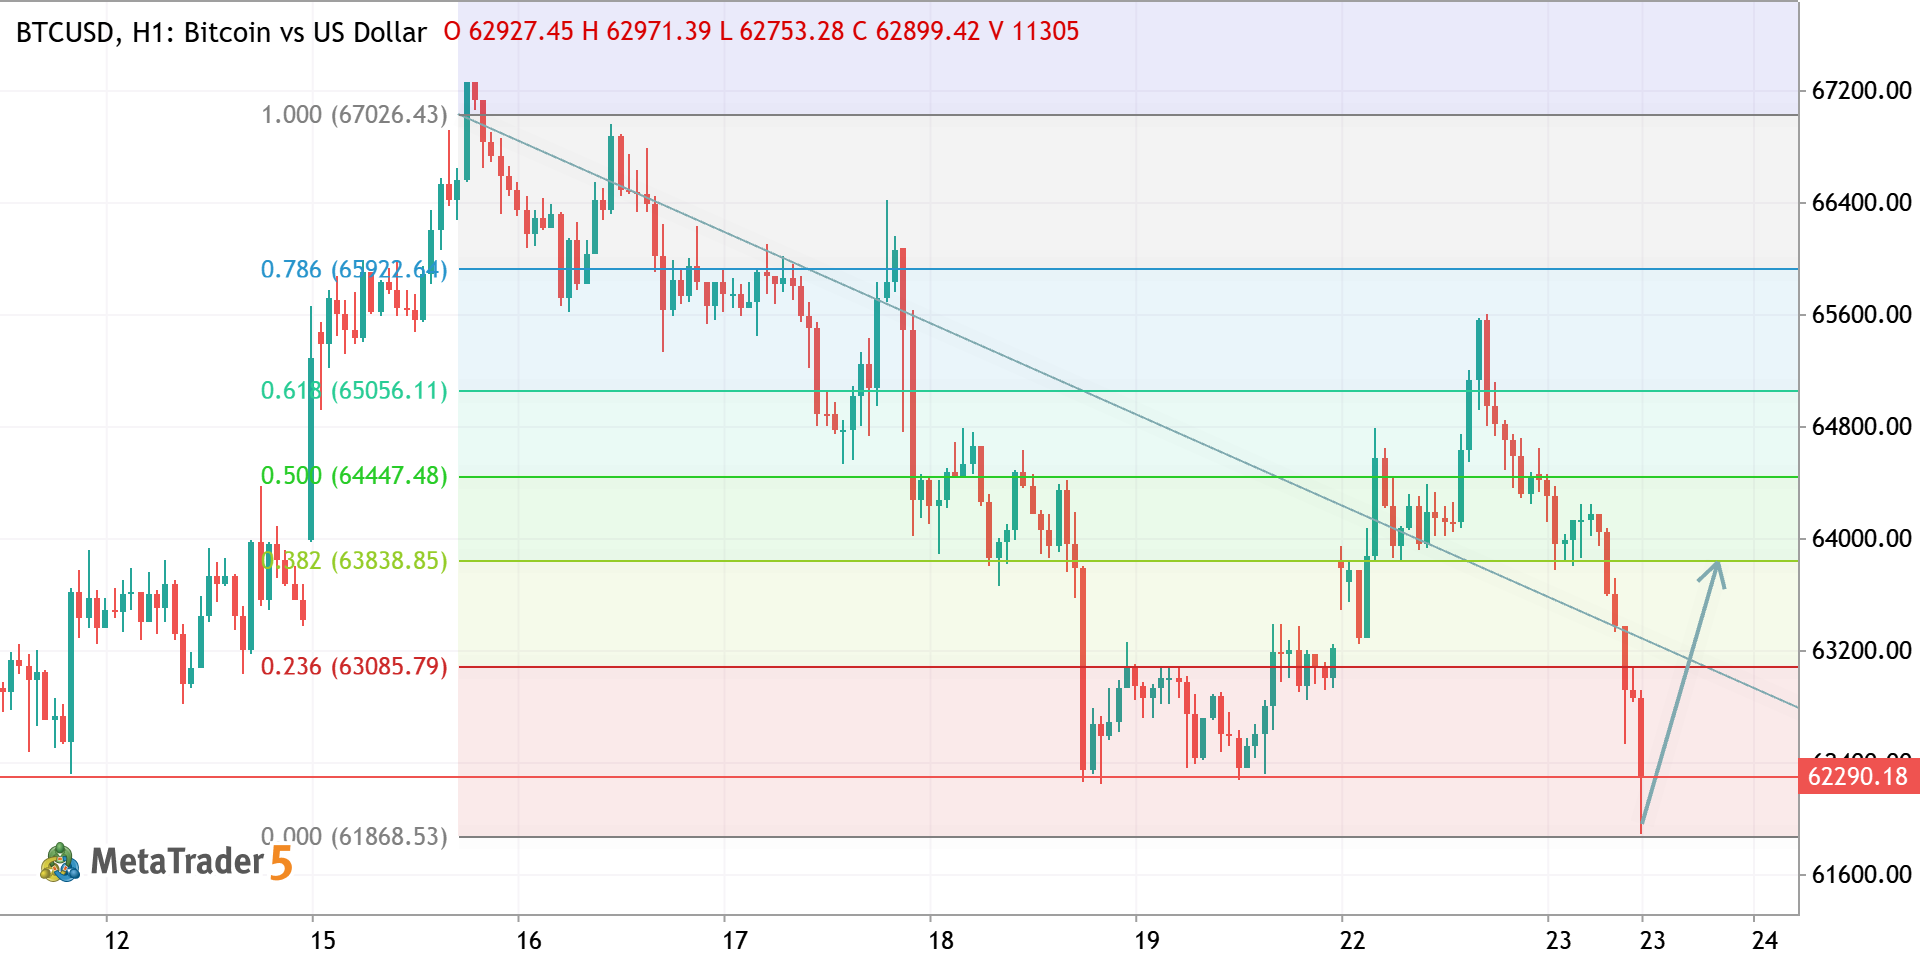
BTCUSD H1 ANALYSIS
BTCUSD H1 Analysis Price has broken below the descending trendline and is testing a key support zone around 62.0k–62.2k. A successful rebound from this area could trigger a corrective move toward 63.0k–64.0k resistance. However, sustained weakness below support may keep bearish pressure intact. Bias: Neutral to Bullish (if support holds) Key Support: 62,000 Key Resistance: 63,000 – 64,000 Trade with proper risk management and wait for confirmation before entry.
2026.06.23 08:36 0 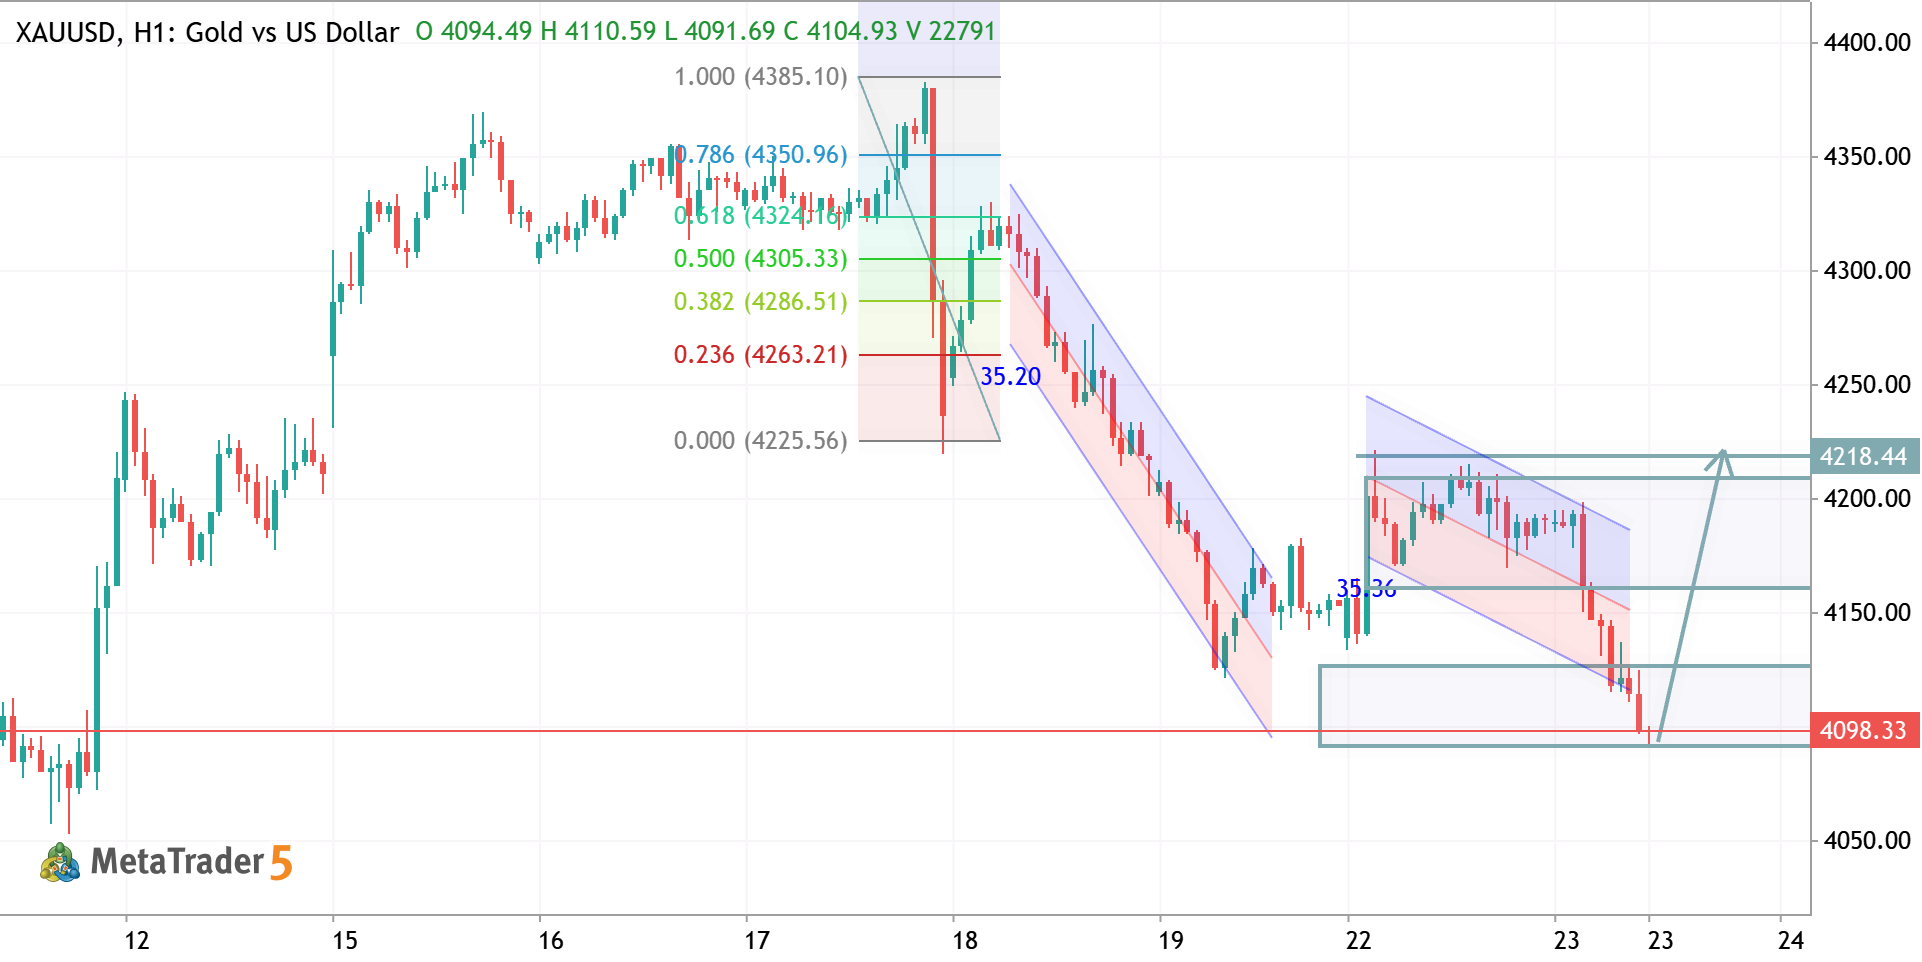
XAUUSD H1 ANALYSIS
XAUUSD Analysis Price has reached a key demand zone after a sustained bearish move within a descending channel. The chart suggests a potential bullish reversal, with buyers defending support around 4090. A breakout above 4180–4200 could confirm recovery momentum and open the path for higher targets. 📈 Bias: Bullish Reversal 🎯 Target: 4200+ 🛡️ Support: 4090 ⚠️ Confirmation needed above resistance for sustained upside.
2026.06.23 08:32 0 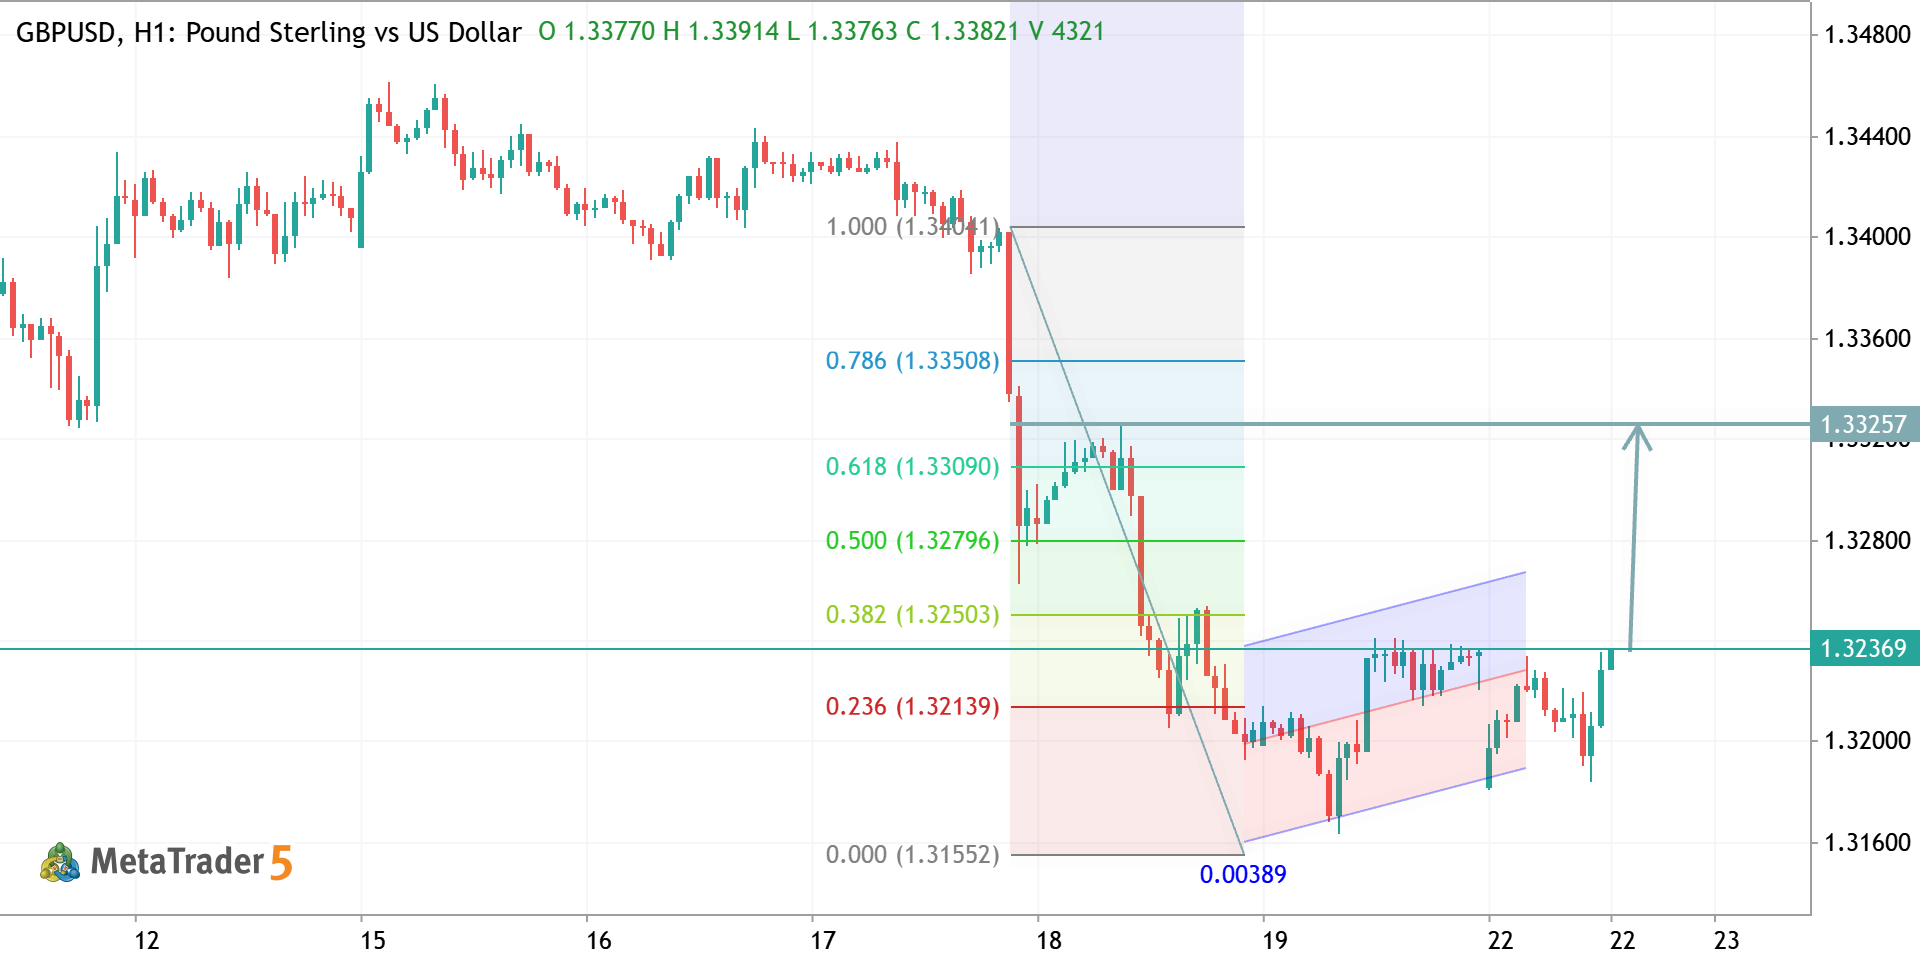
GBPUSD H1 ANALYSIS
GBPUSD | H1 Analysis Price has completed a corrective move and is now breaking out of a bullish channel. The recent rebound from support and strong momentum above the Fibonacci mid-level suggest buyers are back in control. 📈 Bullish Target: A sustained move above 1.3240 could drive price toward the 1.3320 – 1.3350 resistance zone. ⚠️ Risk: A drop back below 1.3200 may weaken the bullish structure and trigger a deeper pullback. Bias: Bullish 🚀 | Trend favors upside continuation while above key support.
2026.06.22 10:10 0 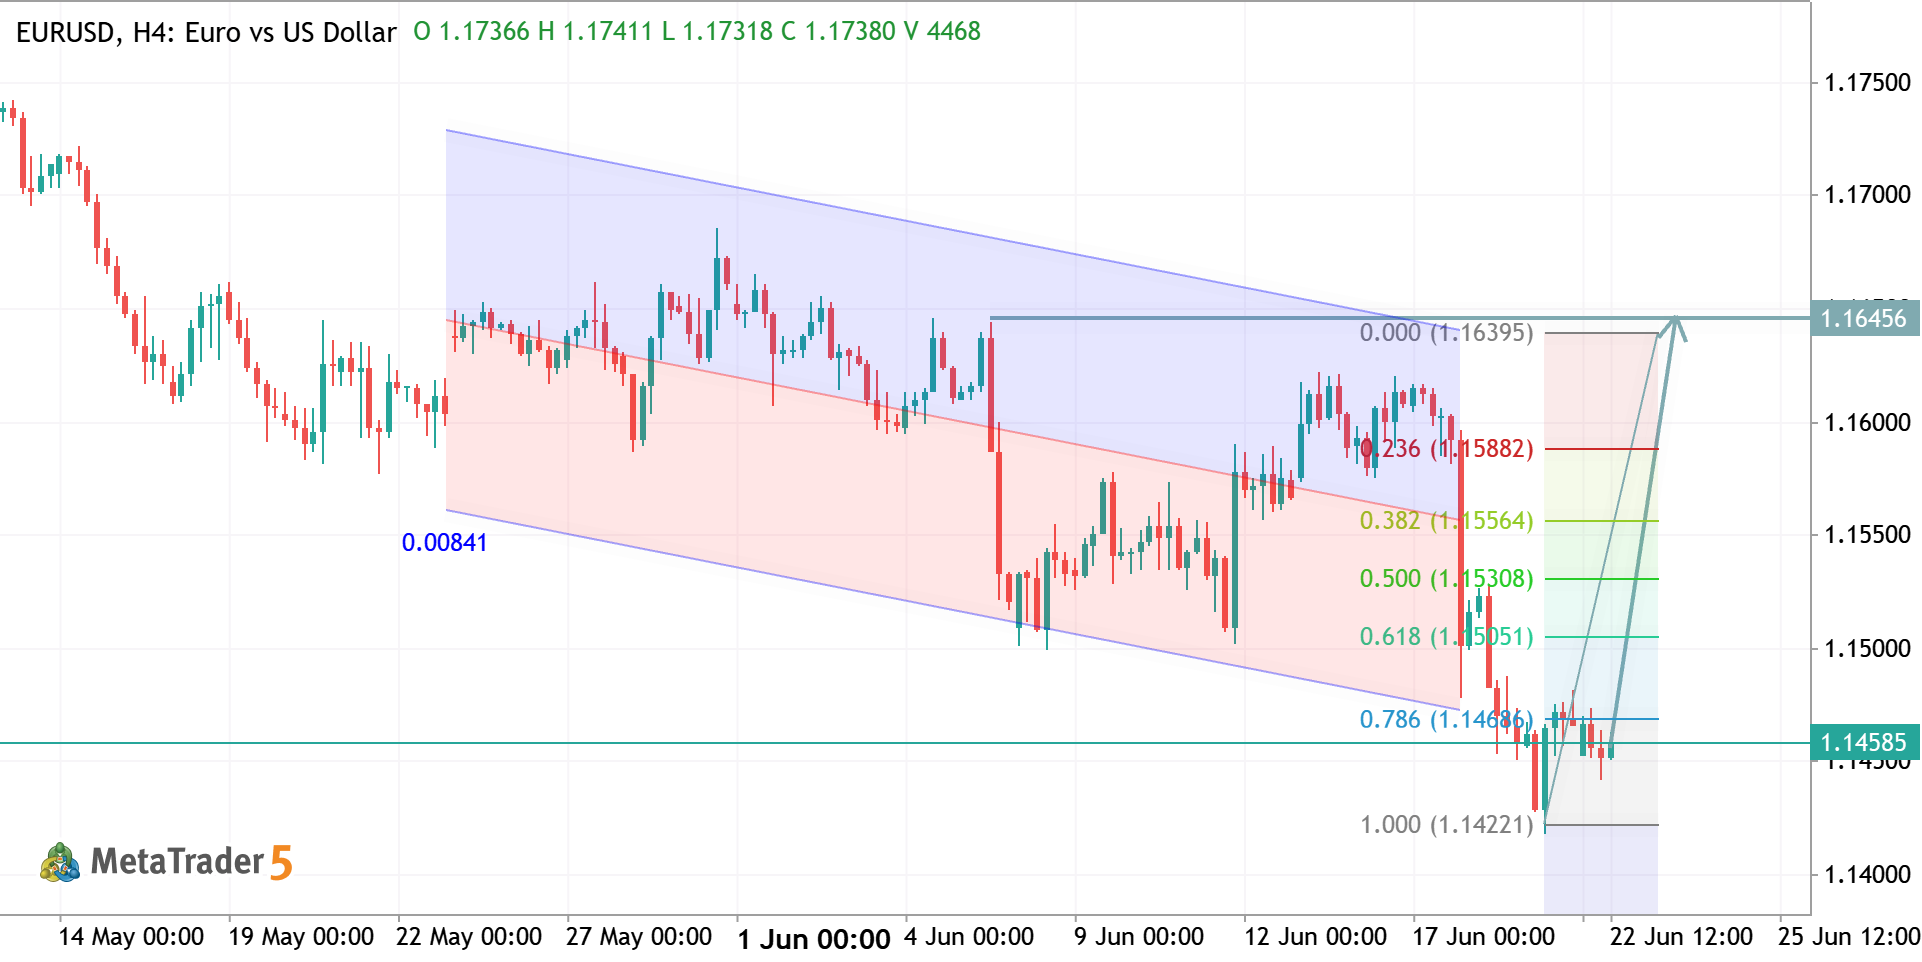
EURUSD H4 ANALYSIS
EURUSD | H4 Analysis Price is trading inside a broad range and has recently bounced from key support near 1.1450. The Fibonacci retracement shows buyers regaining control, with price targeting the upper resistance zone around 1.1660. 📈 Bullish Outlook: Holding above support keeps the path open for a move toward 1.1660+. ⚠️ Invalidation: A break below 1.1450 could shift momentum back to the downside. Bias: Bullish | Buying pressure remains strong above support. 🚀
2026.06.22 10:00 3 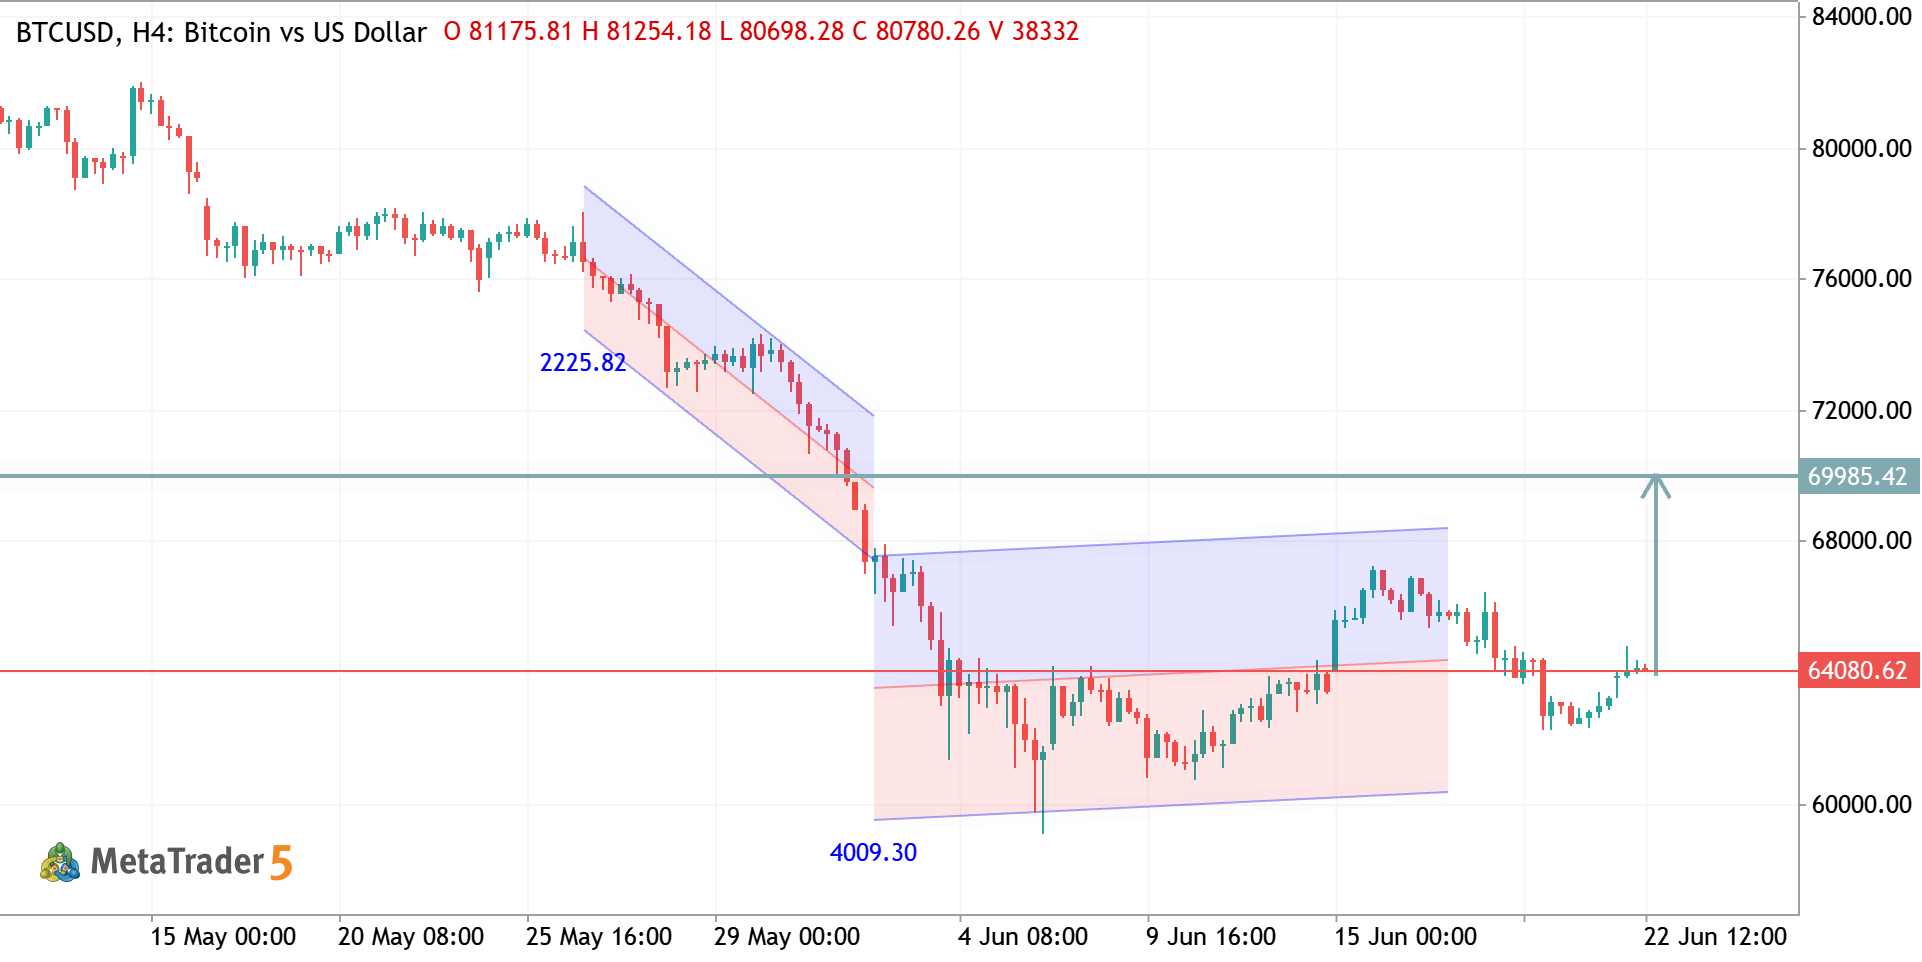
BTCUSD H4 ANALYSIS
BTCUSD | H4 Analysis Price has successfully broken out of the consolidation range and is showing strong bullish momentum. The recent retest of support around 64,000 held firmly, confirming buyer strength. 📈 Bullish Scenario: As long as price remains above the breakout zone, the next target is around 69,800 – 70,000. ⚠️ Risk: A sustained move back below 64,000 could invalidate the bullish outlook and trigger a deeper correction. Bias: Bullish 🚀 | Buy the dips while above key support.
2026.06.22 09:53 3 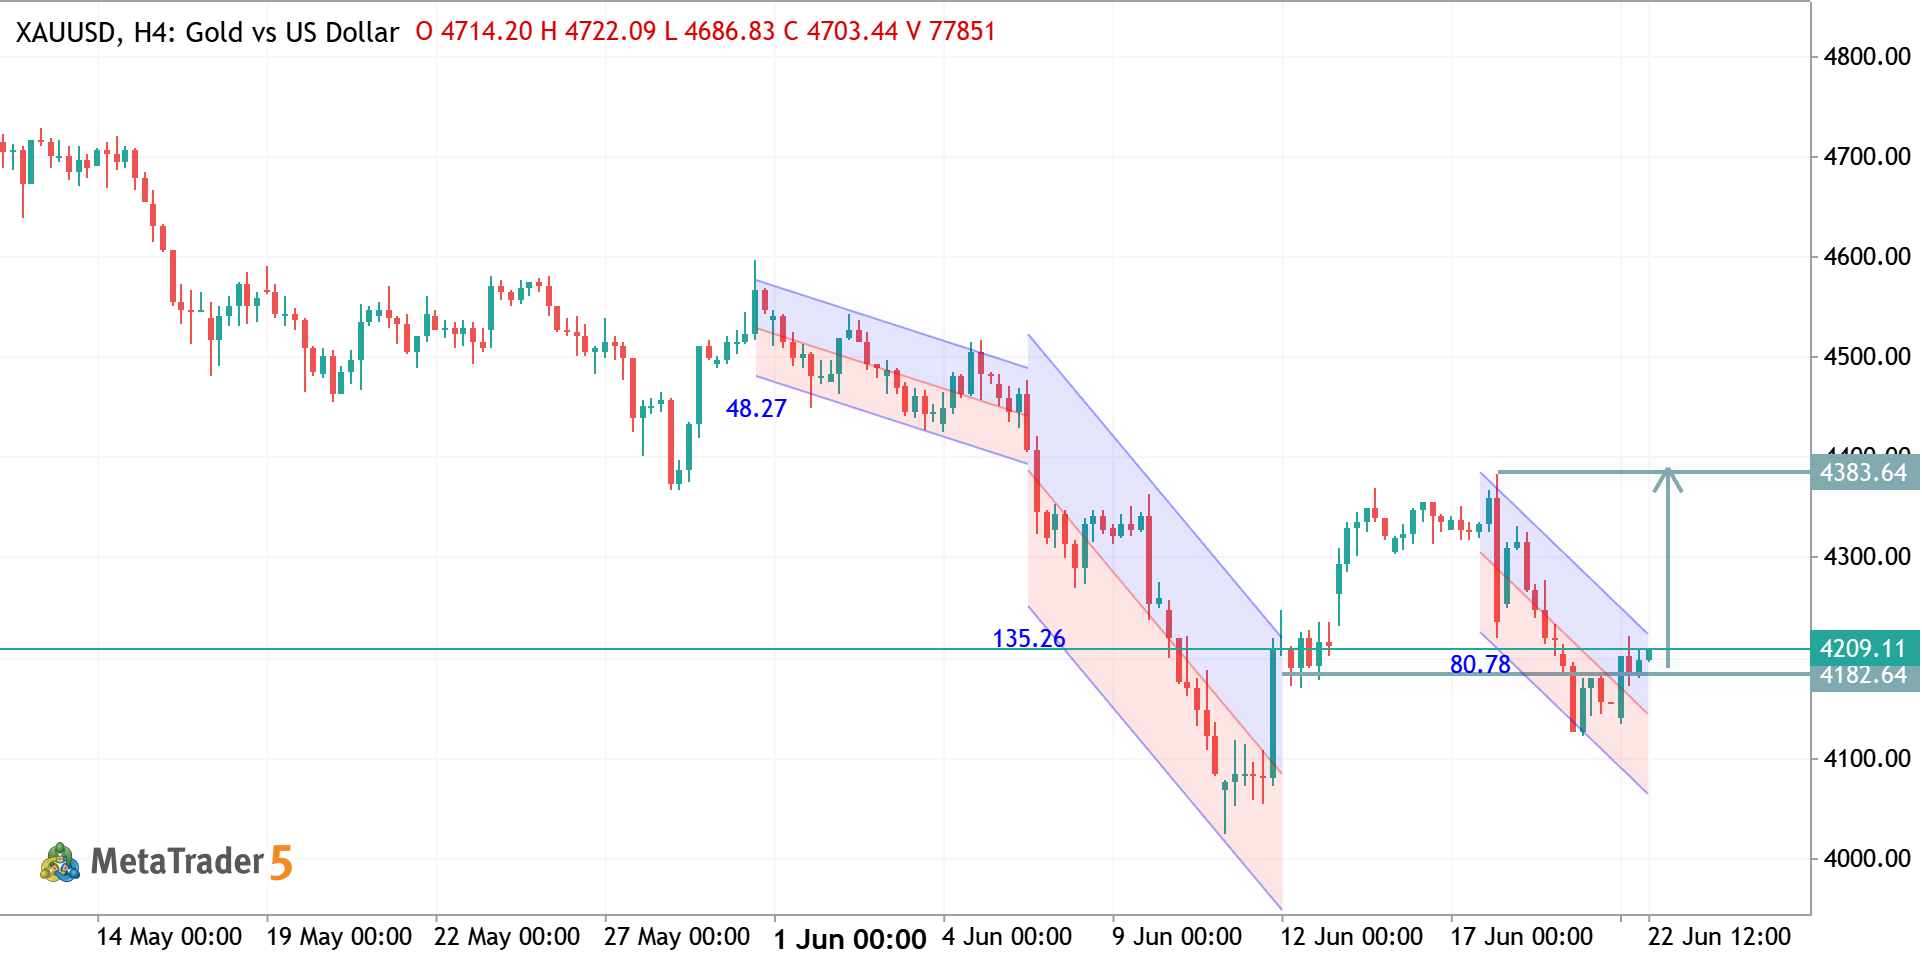
XAUUSD H4 ANALYSIS
XAUUSD Analysis (MQL5 Post) Price is reacting from a descending channel support and showing signs of a bullish recovery. A successful breakout above the current resistance zone could open the way toward 4335+, while holding above 4185 keeps the bullish structure intact. Momentum favors buyers, but confirmation is needed above resistance for further upside. 📈 Bias: Bullish 🎯 Target: 4335+ 🛡️ Key Support: 4185
2026.06.22 09:48 1 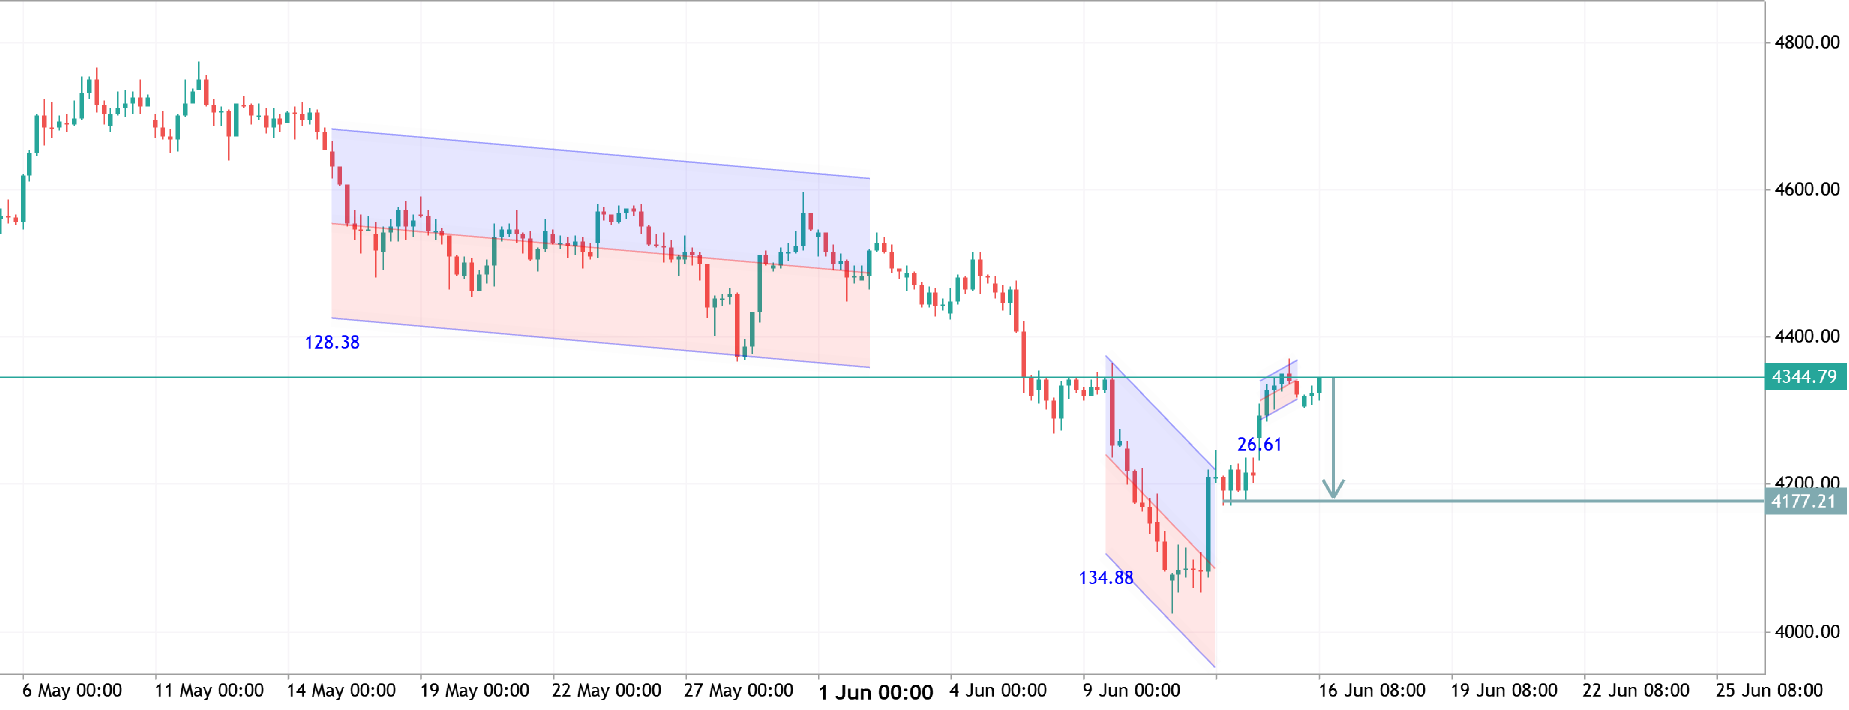
XAUUSD H4 ANALYSIS
XAUUSD H4 Analysis Gold has delivered a strong bullish recovery from the recent bearish channel and is now testing a key resistance zone around 4345. Price action suggests buyers remain active, but a confirmed breakout is needed to unlock further upside potential. 📈 Bias: Bullish Above Resistance 🎯 Targets: 4400 → 4460 ⚠️ Key Support: 4175–4200 As long as price holds above support, the bullish structure remains intact. Watch for a breakout confirmation before targeting higher levels.
2026.06.16 09:06 2 
BTCUSD H4 ANALYSIS
BTCUSD H4 Analysis Bitcoin has broken out of its short-term bearish structure and is now testing a key resistance zone. The recent bullish momentum suggests buyers remain in control, with potential for a continuation move toward higher liquidity levels if resistance is cleared. 📈 Bias: Bullish 🎯 Targets: 64,000 → 68,000 ⚠️ Key Support: 60,000–61,000 Momentum favors the upside, but a rejection from resistance could trigger a pullback before the next move higher. Manage risk accordingly.
2026.06.12 06:16 0