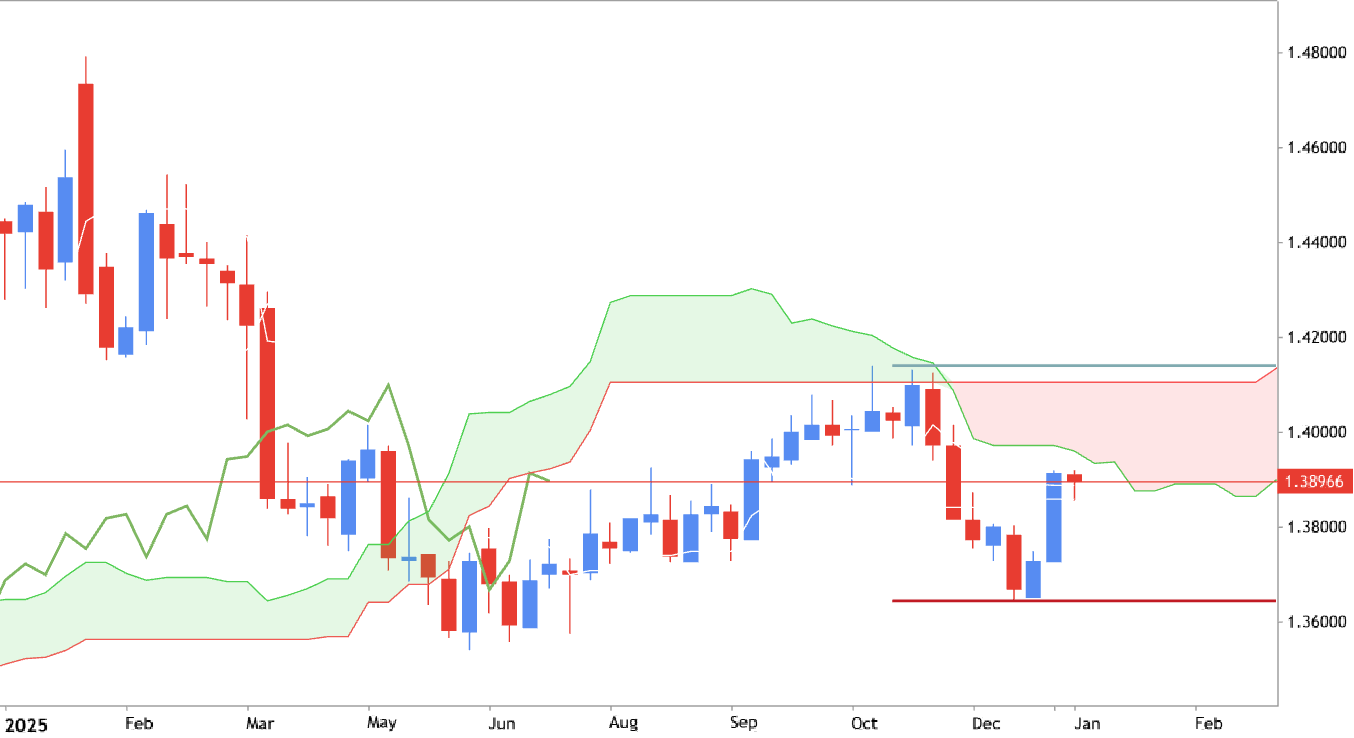
Weekly price is located near and below Ichimoku cloud in the bearish area of the chart. The price was bounced from 1.3642 support to break the symmetric triangle pattern to above and it was stopped near the border of Ichimoku cloud. If the price breaks the resistance level at 1.4140 so the primary bullish reversal will be started; if the price breaks support level at 1.3642 to below so the bearish trend will be continuing; if not so the price will be on ranging within s/r channel waiting for direction.
The price is below Ichimoku cloud in the bearish area of the chart, and support level at 1.3642 is still testing by the price for the bearish trend to be continuing.
Chinkou Span line of Ichimoku indicator broke historical price to below, and the price is crossing 1.3642 support for the good bearish breakdown. Recommendation: bearish breakdown

Yeni yorum
The price is below Ichimoku cloud in the bearish area of the chart, and support level at 1.3642 is still testing by the price for the bearish trend to be continuing.
Trading Summary: bearish ranging.
Chinkou Span line of Ichimoku indicator broke historical price to below, and the price is crossing 1.3642 support for the good bearish breakdown.
Recommendation: bearish breakdown