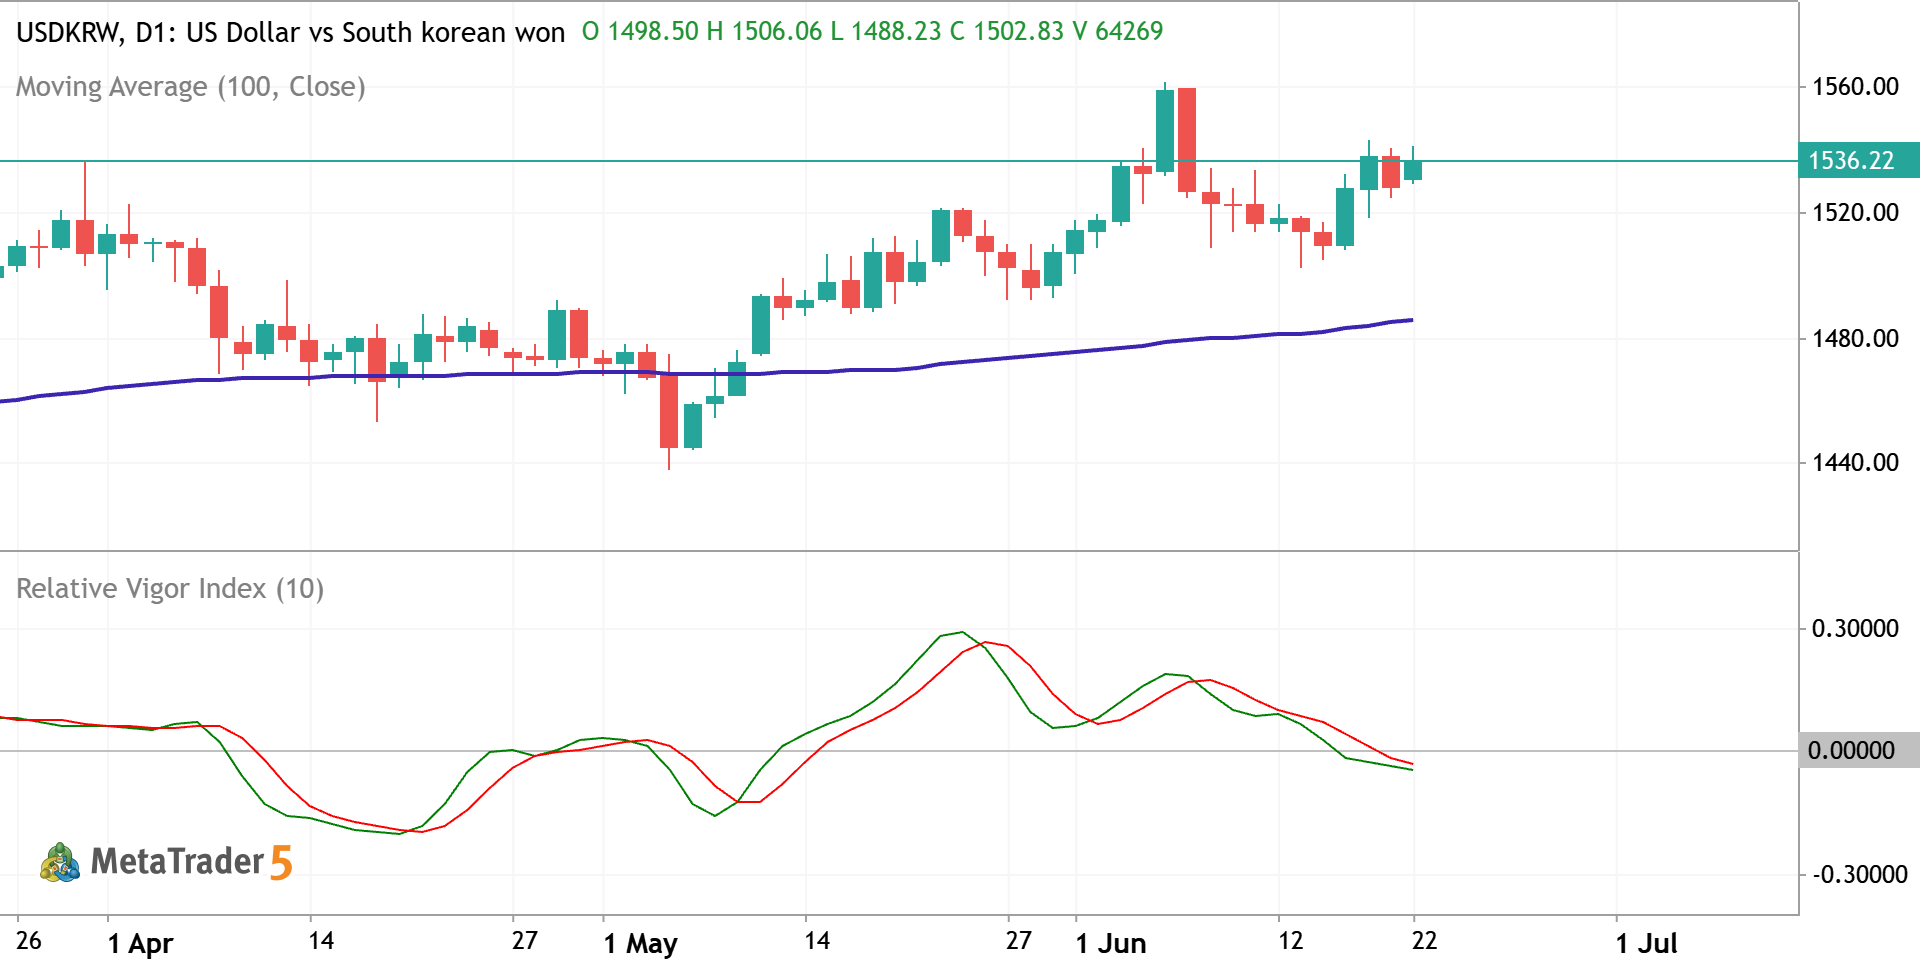
Relative Vigor Index (RVI) measures the strength of a price trend by comparing a currency pair's closing price. It operates on the core logic that, in bullish markets, prices tend to close higher than they open, while in bearish markets, they close lower.
RVI displays two lines: green line (which is the main RVI oscillator line) and red line (the signal line).
- Buy Signal: the green RVI line crosses above the red signal line.
- Sell Signal: the green RVI line crosses below the red signal line.
Those crossover signals are more reliable in the direction of the main primary trend - primary bullish and primary bearish, for example - above/below or on the direction of 100 SMA.

Yeni yorum