
With a market cap of $22.3 billion, Lennar Corporation (LEN) primarily constructs and sells single-family homes while also purchasing, developing, and selling residential land. It operates through several segments, including Homebuilding (East, Central, South Central, and West), Financial Services, Multifamily, and Lennar Other.
Companies valued at $10 billion or more are generally classified as “large-cap” stocks, and Lennar fits this criterion perfectly. In addition to homebuilding, Lennar provides mortgage financing, title insurance, and closing services, and also develops and manages multifamily rental properties.
More Top Stocks Daily: Go behind Wall Street’s hottest headlines with Barchart’s Active Investor newsletter.
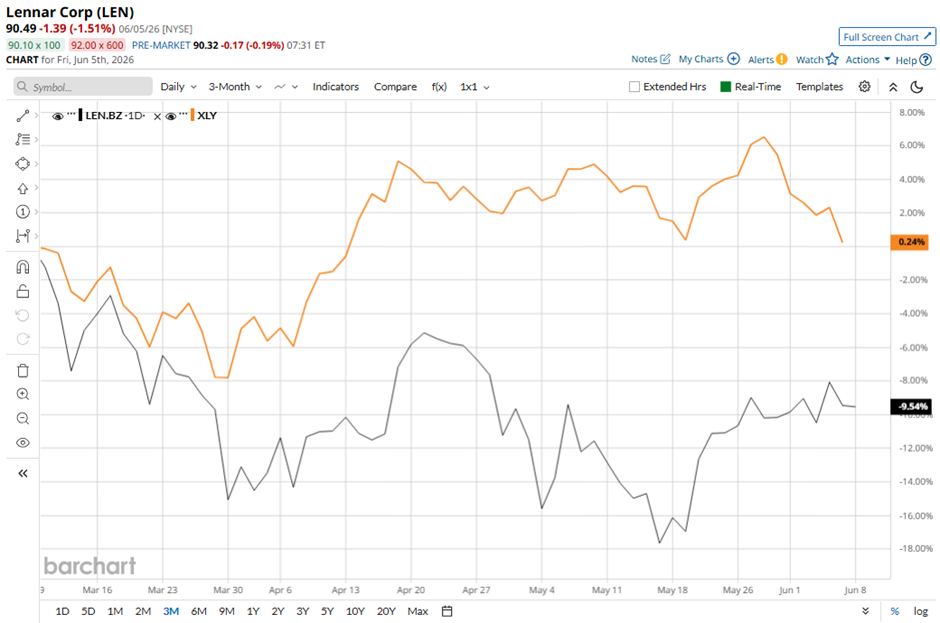
Shares of the Miami, Florida-based company have fallen 37.3% from its 52-week high of $144.24. Lennar’s shares have dropped 13.2% over the past three months, underperforming the broader State Street Consumer Discretionary Select Sector SPDR ETF’s (XLY) 1.5% dip over the same time frame.
 www.barchart.com
 LEN stock is down nearly 12% on a YTD basis, lagging behind XLY’s 3.8% decline. In the longer term, shares of the homebuilder have decreased 17.8% over the past 52 weeks, compared to XLY’s 9.7% gain over the same time frame.
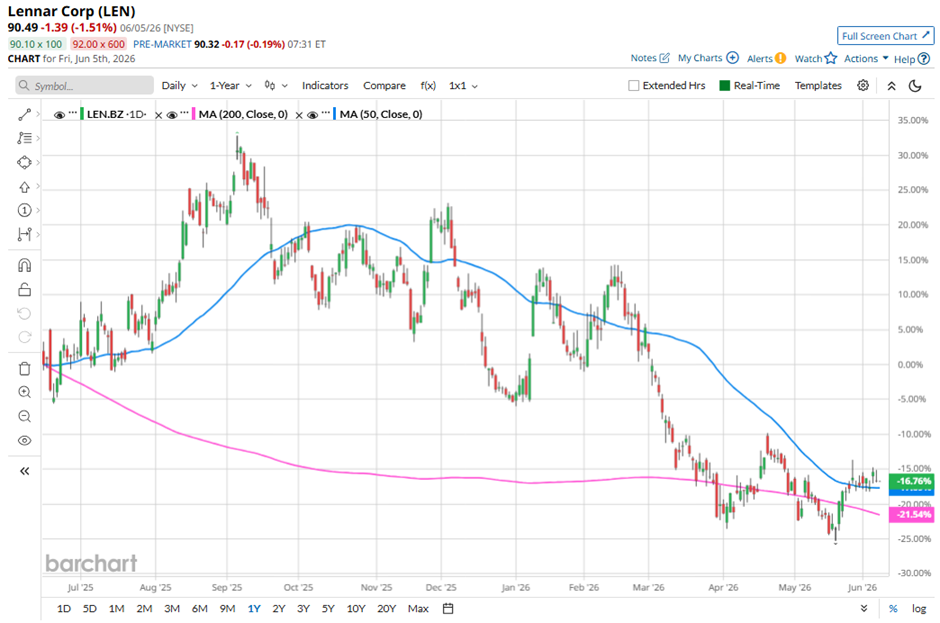
Despite a few fluctuations, the stock has been trading above its 200-day moving average since last year.
 www.barchart.com
 Shares of Lennar rose 2.6% following its Q1 2026 results on Mar. 12. The company reported 18,515 new orders, maintained a sizable backlog of 15,588 homes worth $6 billion, improved cycle time to a record 122 days, reduced construction costs by over 2.5% year-over-year, and generated $2.1 billion in homebuilding cash with no borrowings under its $3.1 billion revolving credit facility.
Additionally, management projected a stronger Q2 with 20,000 - 21,000 deliveries, 21,000 - 22,000 new orders, gross margins improving to 15.5% - 16%, and SG&A improving to 8.9% - 9.1%.
In comparison, LEN stock has performed weaker than its rival, D.R. Horton, Inc. (DHI). DHI stock has increased 18.6% over the past 52 weeks and 1.1% on a YTD basis.
Due to the stock’s underperformance over the past year, analysts remain bearish on LEN. The stock has a consensus rating of “Moderate Sell” from the 20 analysts covering it, and the mean price target of $91.57 is a premium of 1.2% to current levels.
On the date of publication, Sohini Mondal did not have (either directly or indirectly) positions in any of the securities mentioned in this article. All information and data in this article is solely for informational purposes. For more information please view the Barchart Disclosure Policy here.
More news from Barchart
Palo Alto Networks Delivers Strong FCF Margins - Is PANW Worth $350? After Recent Rally Sparked by Jensen Huang’s Comments, Marvell Stock Is a Buy Using SPY Put Options For Portfolio Protection Stock Index Futures Climb as Tech Stocks Rebound, U.S. Inflation Data and SpaceX IPO Awaited