


It was reported Wednesday afternoon that a large call option spread, equating to 500 million bushels, was created in November corn.
This position is a bet on a US weather market through the rest of summer and into fall.
Don’t Miss a Day: From crude oil to coffee, sign up free for Barchart’s best-in-class commodity analysis.
However, a variety of market factors; technical, fundamental, and seasonal, indicate this position could be in for a rough ride.
A look at the quote screen Thursday morning and we find the Corn market in the green, most likely on the latest 6-to-10-day forecast, for July 28 to August 1, that continued to call for above normal temperatures and below normal precipitation across the US Midwest. The September issue (ZCU26) rallied as much as 3.75 cents on trade volume of 21,000 contracts and was sitting 3.25 cents higher at this writing. Meanwhile, the December issue (ZCZ26) added as much as 3.75 cents overnight on trade volume of 50,000 contracts and was sitting 3.75 cents higher at this writing. The September-December futures spread has dropped back to its low daily close of 23.5 cents carry and covering a bearish 76% calculated full commercial carry. Further out, the December-March spread was sitting on a carry of 15.5 cents and covering a neutral 51%. Even further out in the 2026-27 marketing year we see the May-July spread at a carry of only 3.0 cents and covering a bullish 3%, as compared to the 2026 edition of the spread closing this same week last year covering a still bullish 30%. What do all these corn futures spreads tell us?
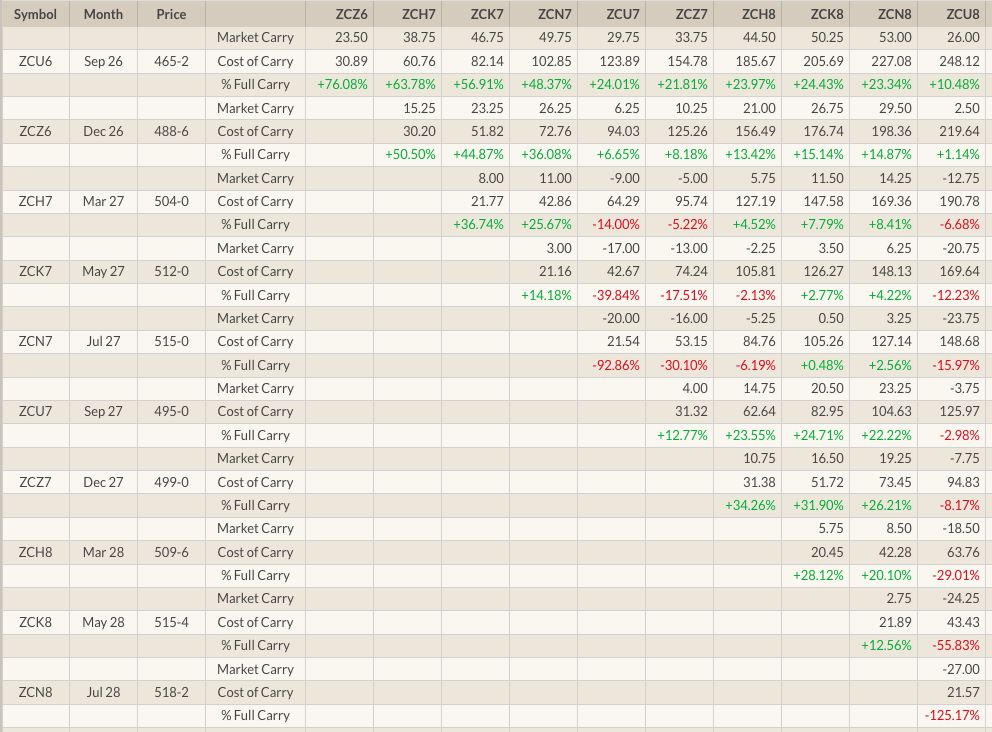 The September-December covering a bearish level of calculated full commercial carry tells us supplies, including some newly harvested supplies in the US Southeast, usually a point of comic relief when it comes to USDA’s September 1 quarterly Grain Stocks figure (recall The 300 Consistency), outweigh demand. The December-March futures spread is covering a neutral level but posted a new low daily close of 15.75 cents carry on Tuesday, July 21 and covered 52.5%, meaning the trend of the spread remains down (and Rule #1 tells us to not get crossways with the trend). However, if a Down Escalator Simulator develops, meaning the Dec-March spread follows the same track as the September-December, then the downtrend of the Dec-March could take it to a similar level as the September-December. This means the commercial side of the market is not concerned about the 2026 US crop. For those of you naïve enough to believe in the Tooth Fairy, the Easter Bunny, and NASS’ weekly crop condition numbers, the latest round of ridiculousness resulted in an Index of 177 points. For what that’s worth – nothing – this was the second highest Week 8 Index figure over the past 5 years, trailing only last year, and the fourth highest of the past 10 years. The May-July spread covering a bullish level of calculated full commercial carry could be the result of a couple factors: First, lower trade volume and open interest in deferred futures, and second, concern over Brazil’s 2027 production due to the much-hyped “Super El Nino”. It’s possible, maybe even probable, US demand stays strong through the 2026-27 marketing year. In its “infinite” wisdom, USDA’s July WASDE estimate for 2026-27 US ending stocks came in at 45.5 million metric tons, as compared to the June guess of 49.8 mmt and the 2025-26 guesstimate of 51.3 mmt. Even by USDA’s asterisk laden standards, US supply and demand isn’t expected to be overly tight.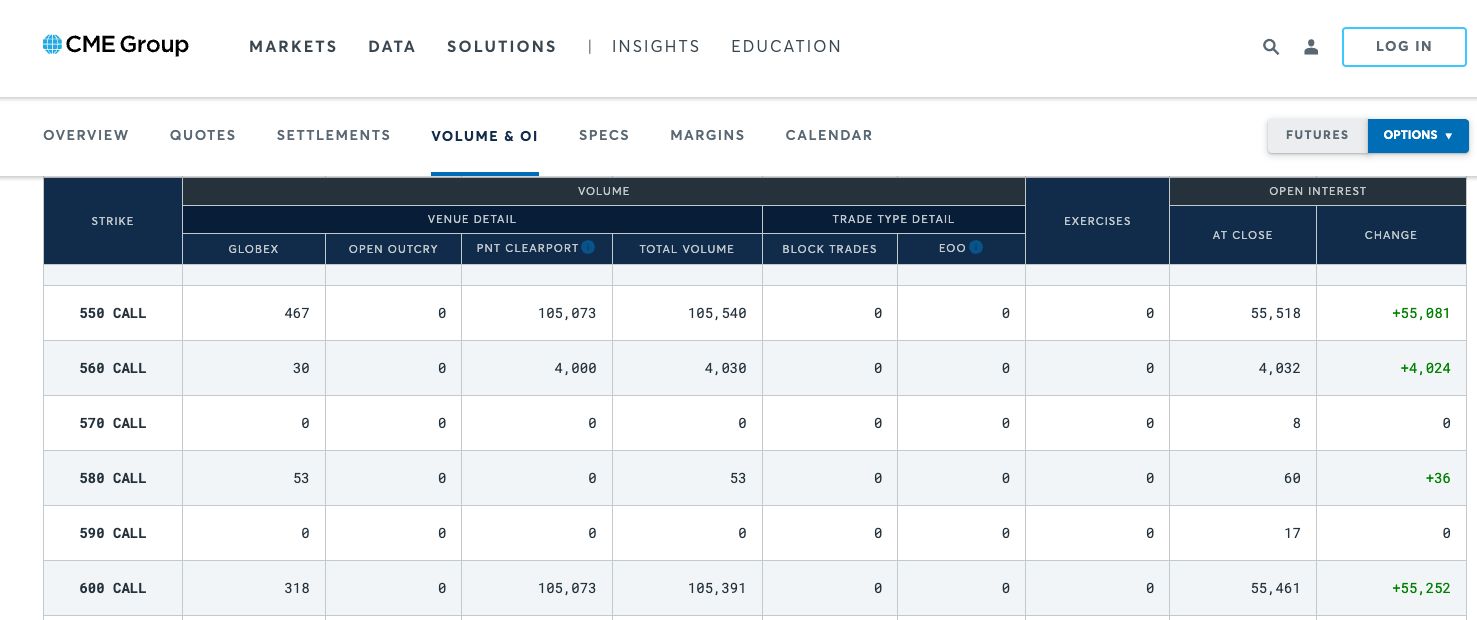
What prompted this discussion of new-crop corn supply and demand on a late summer Thursday morning? After the close on Wednesday, July 22, my friend and host of RFD-TV’s Market Day Report Tony St. James sent me a message asking if we could talk. A story had come out about a November Corn (serial contract) $5.50/$6.00 call option spread, a reported 100,000-contract (500 million bushel) trade. P.J. Quaid, a long-time Chicago-based options trader, reportedly said it was the biggest trade he had ever seen in grains. I did an on-the-spot interview with Tony, who will have P.J. on his program Thursday morning. (So be sure to tune in.) I didn’t have much information to go on at the time, but my Blink reaction was the trade was put on by a large fund, not a professional option trader. Why? Because the latter is not usually concerned about direction[i], and this position is all about corn rallying above $5.50 through option expiration in October. Could it happen? Certainly. But there are a few key factors working against the position:
Again, the commercial outlook for short-term and intermediate-term supply and demand, according to futures spreads, is bearish to neutral. Based on both price distribution and Kernel Density Estimation (price, not ears of corn), the futures market is statistically overpriced in the upper $4.00 range. Seasonally, implied volatility (Vega) tends to decrease from late July through fall harvest. Why is this important? Implied volatility acts as a multiplier of time value, with the latter decaying (Theta) slightly each day.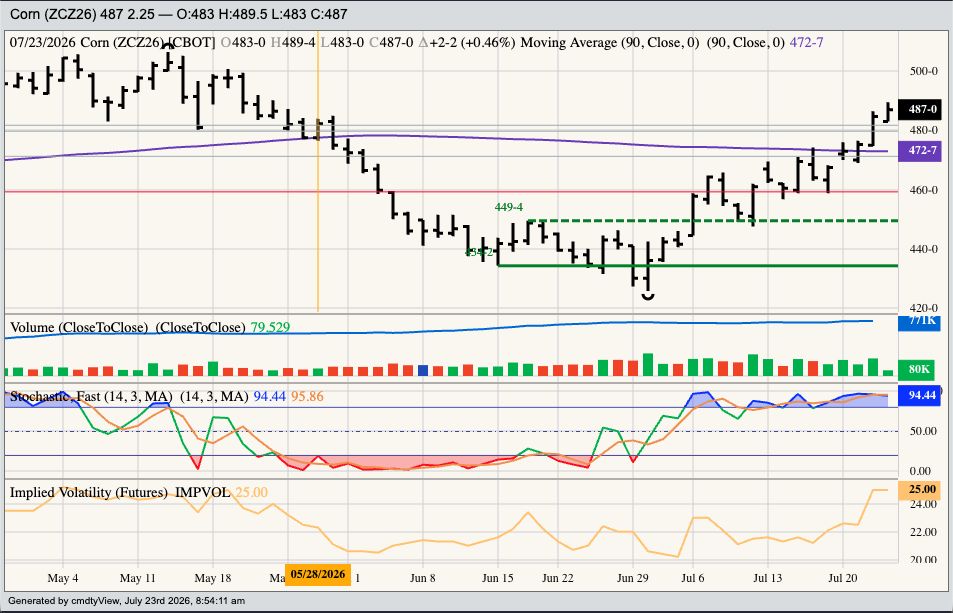
Beyond the latest extended forecast, might there have been a technical trigger for this call option spread trade? My Chart of the Day for Monday, July 20 discussed Dec26 corn and its 90-day moving average.
A look at the issue’s daily chart shows Dec26 had not closed above its 90-day moving average (DMA) since May 28. The 90 DMA was calculated Monday near $4.73. Dec26 poked its head above the 90 DMA overnight through early Monday morning, registering a high of $4.75 Note it did the same last Thursday before closing 5.5 cents lower for the day. Dec26 closed back below $4.73 MondayWhy am I using the 90 DMA? I kept adjusting to find the best fit for the market, looking for an indicator trading algorithms might be using. As we know, when it comes to analysis, as in life, one size does not fit all.
From John J. Murphy’s Technical Analysis of the Futures Markets (1986 ed., pg. 252):
No one moving average worked best in each market. Or stated another way, each market seemed to have its own optimum moving average that worked best.This set the stage for Tuesday’s session, when Dec26 rallied to a high of $4.7650 before closing at $4.7525, above the 90 DMA. I wrote in Afternoon Commentary:
The conversation gets more interesting when we look at the corn market. Recall from Monday’s Chart of the Day, I’ve been keeping an eye on two key technical statistics, according to algorithms, with the more heavily traded December issue: The 90-day moving average and daily stochastics. I’ll start with the latter, stochastics, a momentum indicator that shows Dec26 to be overbought on its short-term daily chart. If Watson is paying attention, this could be viewed as a trigger to start liquidating again after adding to its net-long futures position the last five trading days. For the record, Dec26 closed at $4.7525 Tuesday, up 14.75 cents from last Tuesday’s settlement. But as Hamlet would say, “Aye, there’s the rub”, for today’s close was above the 90-day moving average of $4.73, the first time Dec26 has settled above this statistic since May 28. Again, if Waston is paying attention, this could trigger continued buying in Dec26 corn over the coming days and weeks. Which will it be? While I can’t be certain, my Blink reaction is the cross of the moving average will carry more weight based on the old saying, “A market can stay overbought/oversold longer than most of us can stay solvent”.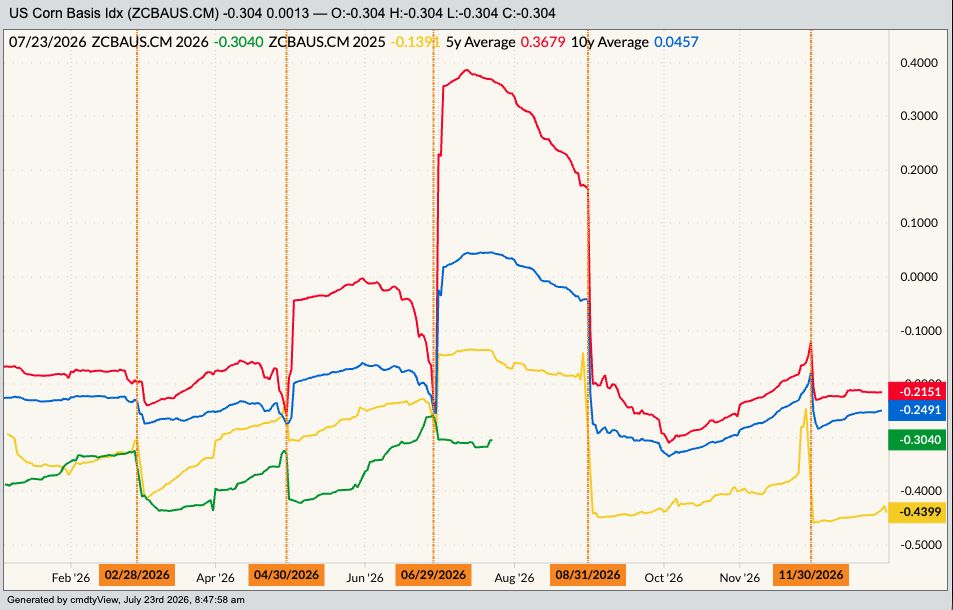
I would be remiss if I didn’t mention the heart of the corn market, national average basis. Following Wednesday’s rally, September finished 9.25 cents higher while December was 9.5 cents in the green. The Barchart National Corn Price Index finished at $4.3146, up 10.39 cents for the day and putting the Barchart National Corn Basis Index at 30.5 cents under September futures. This continues to run weaker than last year, as well as the previous 5-year and 10-year averages. The bottom line is basis remains weak, adding another layer of fundamental reason for Dec26 to not extend its late summer rally through harvest.
So, here we are, with Watson presumably adding to its net-long futures position and possibly making a big call option bet on bullish weather despite market evidence to the contrary. Time will tell how this plays out.
[i] You might recall this is why I look at the CFTC Legacy/Futures Only Commitments of Traders report. True option traders look for anomalies in the Greeks leading to profit opportunities meaning including these positions in the discussion of fund bullishness or bearishness is misleading. To this point, a recent Barchart Partner newsletter email had the subject line, “Why you’re better off NOT trading directionally”, then went on to discuss opportunities in options and cash.
On the date of publication, Darin Newsom did not have (either directly or indirectly) positions in any of the securities mentioned in this article. All information and data in this article is solely for informational purposes. For more information please view the Barchart Disclosure Policy here.
More news from Barchart
Watson Goes Big In the Corn Market Three Key Factors to Watch in Grains During Late Summer Soybean Meal Prices Keep Heading Higher. How to Trade Them at a 9-Week High. Grain Bulls Are Showing Resilience: What’s Keeping Uptrends in Corn, Soybean, and Wheat Prices Alive