

I know the stock market has your attention. But the bond market has mine. Because I think the returns there could rival those of the S&P 500 Index ($SPX) in the next five to 10 years. I won’t get ahead of myself, since a lot has to happen.
However, as a guy who looks at charts almost daily, I can’t help but notice when major trend reversals start shaping up. I think I see one, albeit this is more of a “green shoots” situation. That is, a hint of a trend change, not one firmly in progress.
Join 200K+ Subscribers: Find out why the midday Barchart Brief newsletter is a must-read for thousands daily.
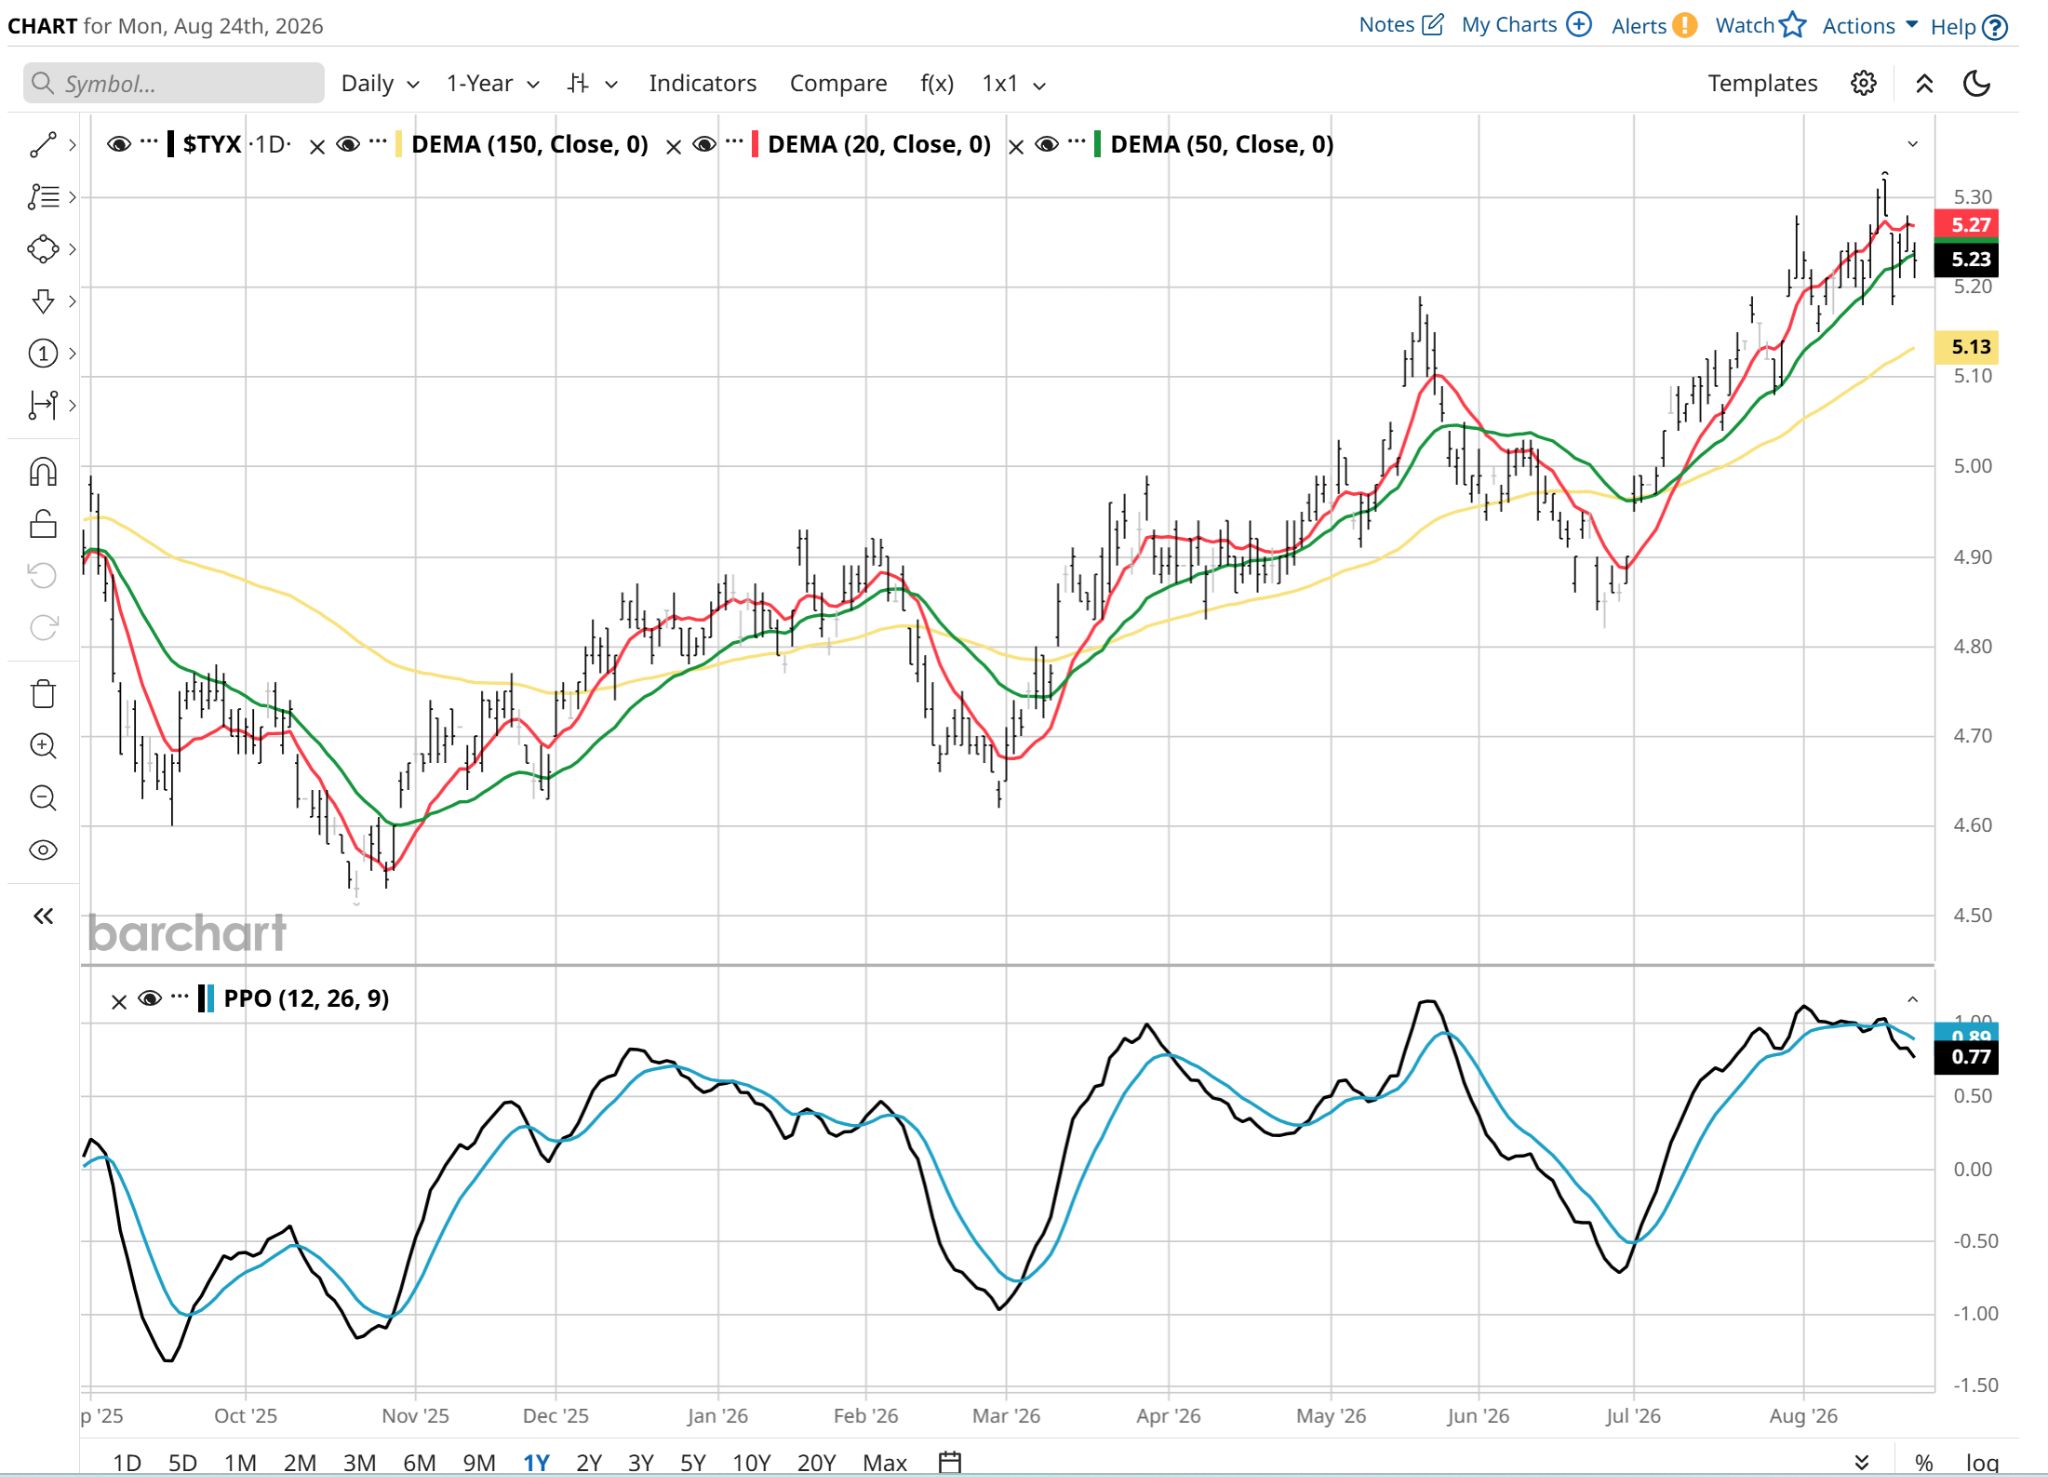
The focal point of this shift is the 30-Year U.S. Treasury Bond ($TYX) yield, which recently reached 5.2%. A 30-year yield at this level has not been seen since 2008. The 2000 tech market top was preceded by a spike in rates similar to what we’ve seen recently.
While historical parallels offer intriguing circumstantial evidence, the current technical price action provides a far more actionable picture to me. The 30-year rate has climbed roughly 1.2% since late 2024, pushing yields to levels where the technical case for a reversal is getting more visible by the day.
 www.barchart.com
 What I see above is a potential top in the PPO indicator, the one at the bottom. If you look back at past peaks for PPO in that high area, it typically has forewarned of lower rates.
The key this time around is that rates have moved up rapidly this summer. That means a reversal could produce a higher return than if rates had just drifted up 10 to 20 basis points. It is the magnitude at stake that interests me here.
 www.barchart.com
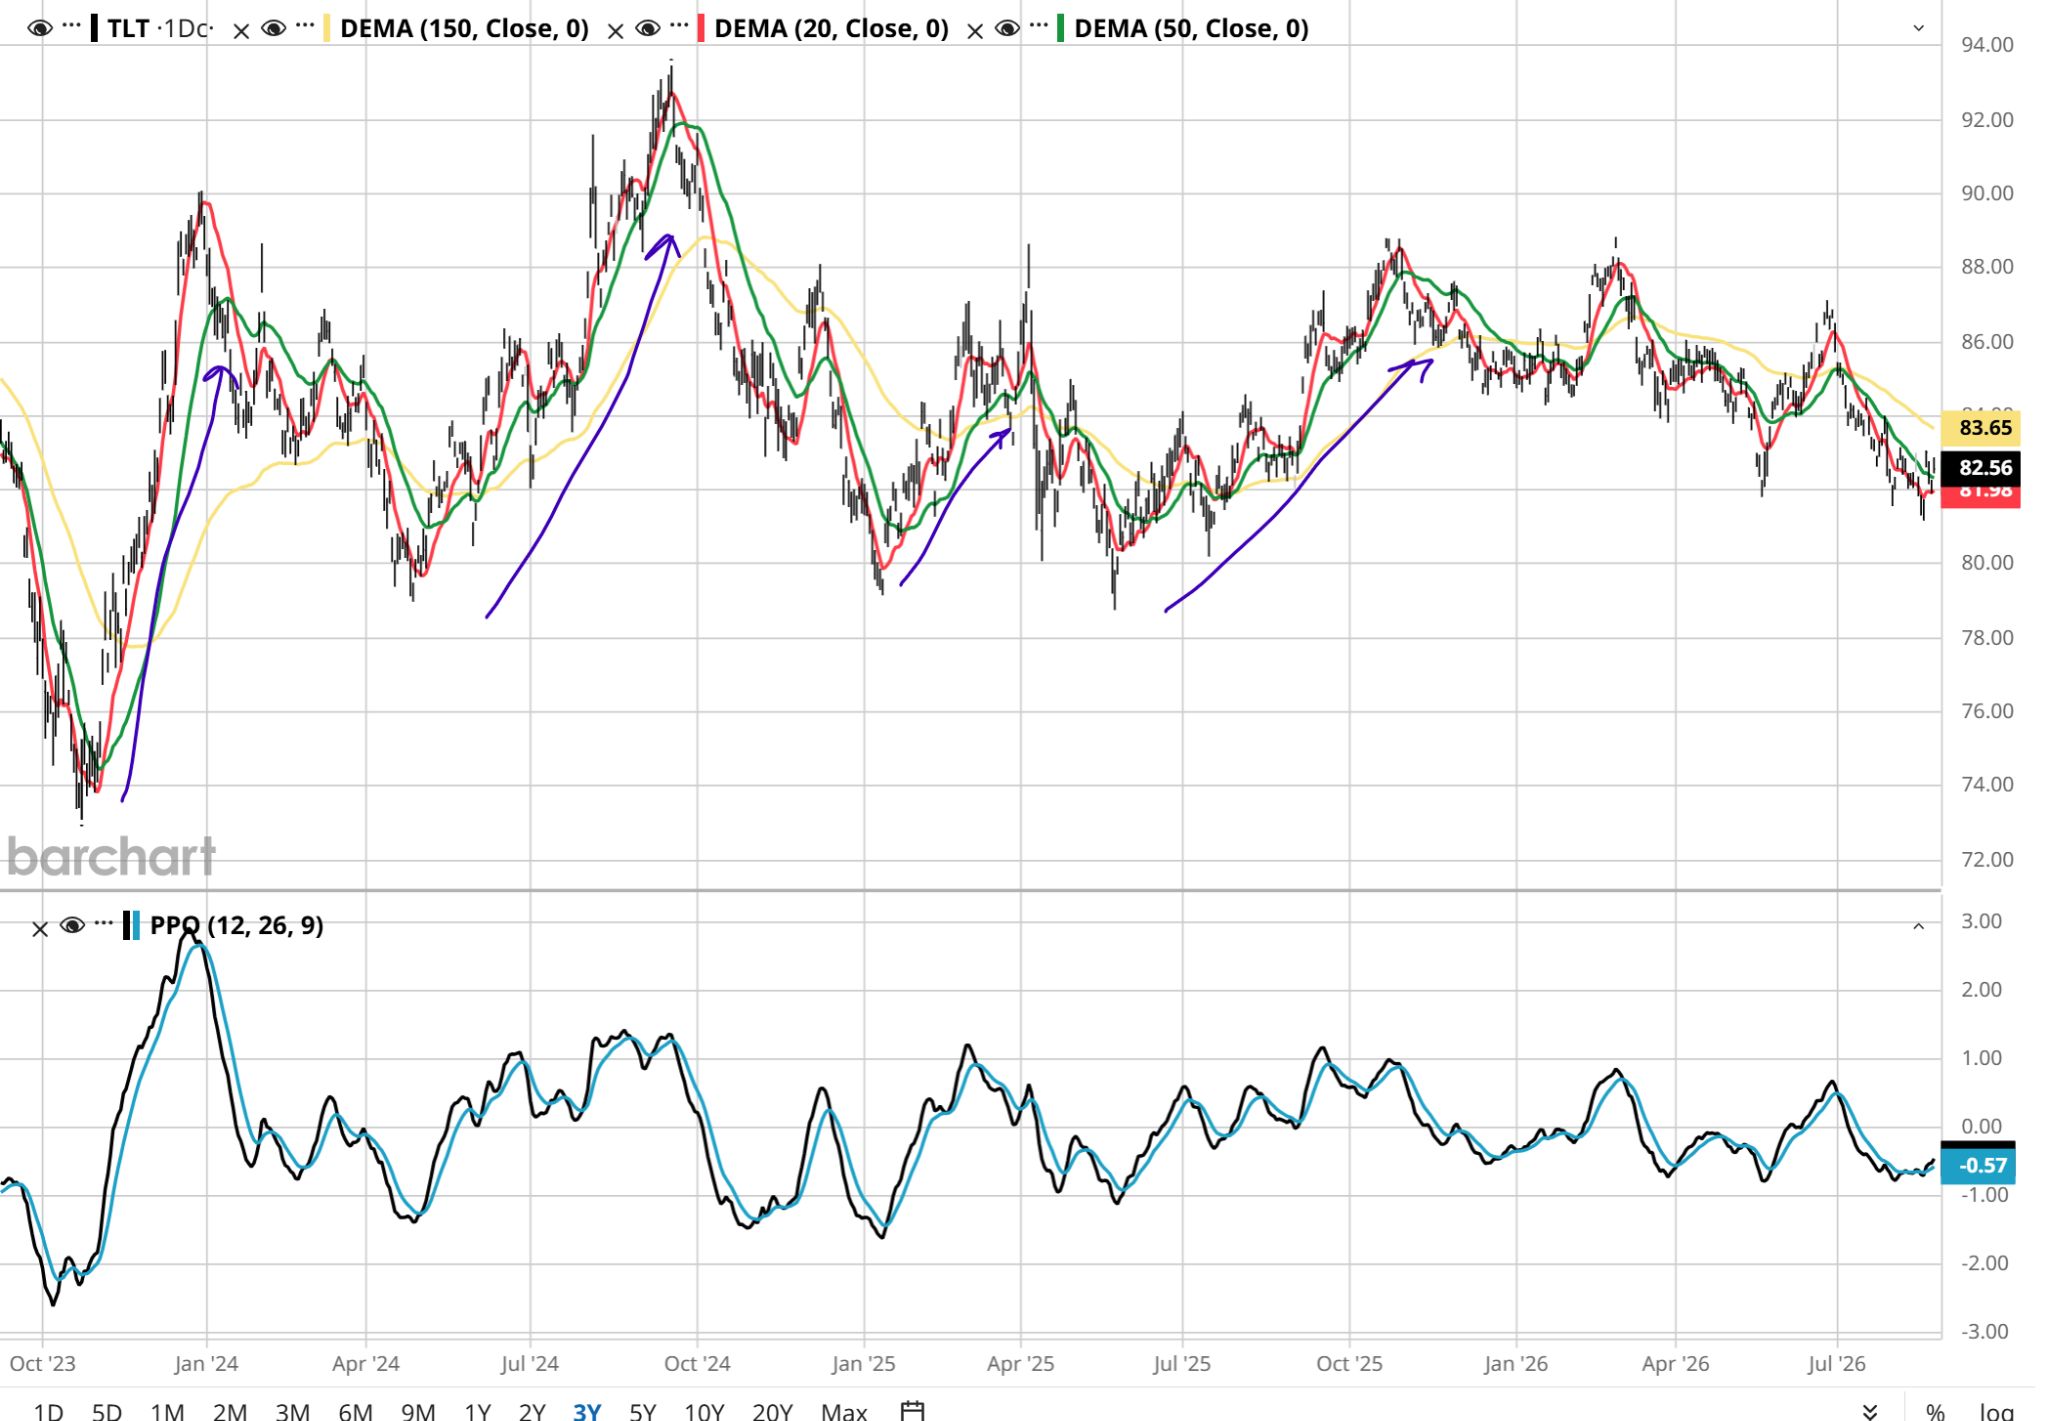
 The go-to way to take advantage of that is through the iShares 20+ Year Treasury Bond ETF (TLT), which owns 20- to 30-year U.S. Treasury bonds. Importantly, the bonds are not held to maturity. So this is about total return, albeit starting with a yield of more than 5%.
The fixed-income landscape has evolved into a high-speed confidence game. You know, just like the stock market has!
But in my view, bond investors blink far more easily than they used to. Quantitative algorithms and institutional traders react violently to fiscal debt headlines, temporary inflation blips, and Treasury auction supply metrics, pushing yields higher in sudden, aggressive bursts. These panic-driven spikes routinely set up powerful mean-reversion rallies once fundamentals check back into the ballgame.
The Case for Lower Long Bond Yields
Borrowing costs above 5% across mortgage markets, corporate credit, and sovereign debt act as a direct brake on economic expansion. I dare you to name an elected official who wants that to persist for much longer.
As restrictive financing conditions cool business spending and labor markets, the appetite for new credit slows, naturally pulling long-term yields lower. Furthermore, if elevated interest rates and stretched valuations finally cause the stock market to falter, the massive pool of capital currently chasing equity momentum will seek safe, cash-generating havens. That, in particular, is creeping up my odds board as we near autumn.
When long-term yields drop from elevated levels, bond prices rise proportionally to their duration. That price dynamic creates a dual-engine return profile: an attractive, high-income yield combined with significant capital appreciation as long-duration bond prices adjust upward.
Bonds may be considered boring compared to high-beta stocks, but there is nothing boring about putting a 5% yield in your pocket, with upside. Securing that level of yield with capital appreciation potential, especially with the messy stock market I continue to see, could present one of the cleanest risk-reward opportunities in modern market history. I looked at that sentence three times, and still decided to submit it in the final version of this article. So yes, I’m seeing potential for this to grow.
Finally, you may have noticed in the TLT chart above that I drew four purple arrows. Those show the strongest rallies in that exchange-traded fund (ETF) over just the past three years. Their gains: a pair of around 20% each, plus a 15% gain, and another over 10%. They each occurred over a period of three to six months.
Annualize those rallies, and tell me you are not intrigued versus the volatile, overvalued stock market that continues to hang onto the AI trade for dear life! Bonds, I see you. Even if many people don’t. At least not yet.
Rob Isbitts is a semi-retired CIO, former fiduciary investment advisor, and Barchart columnist. Check out his other work at ETFYourself.com (featuring the Fresh Charts weekly trading post), and ROAR.PiTrade.com, helping investors to better-manage their own portfolios.
On the date of publication, Rob Isbitts did not have (either directly or indirectly) positions in any of the securities mentioned in this article. All information and data in this article is solely for informational purposes. For more information please view the Barchart Disclosure Policy here.