


When the going gets tough, the tough look around. We are in a period of tremendous stagnation for individual stock selection. Not many people seem to realize it, likely because the past few years at the headline S&P 500 Index ($SPX) level have been so friendly.
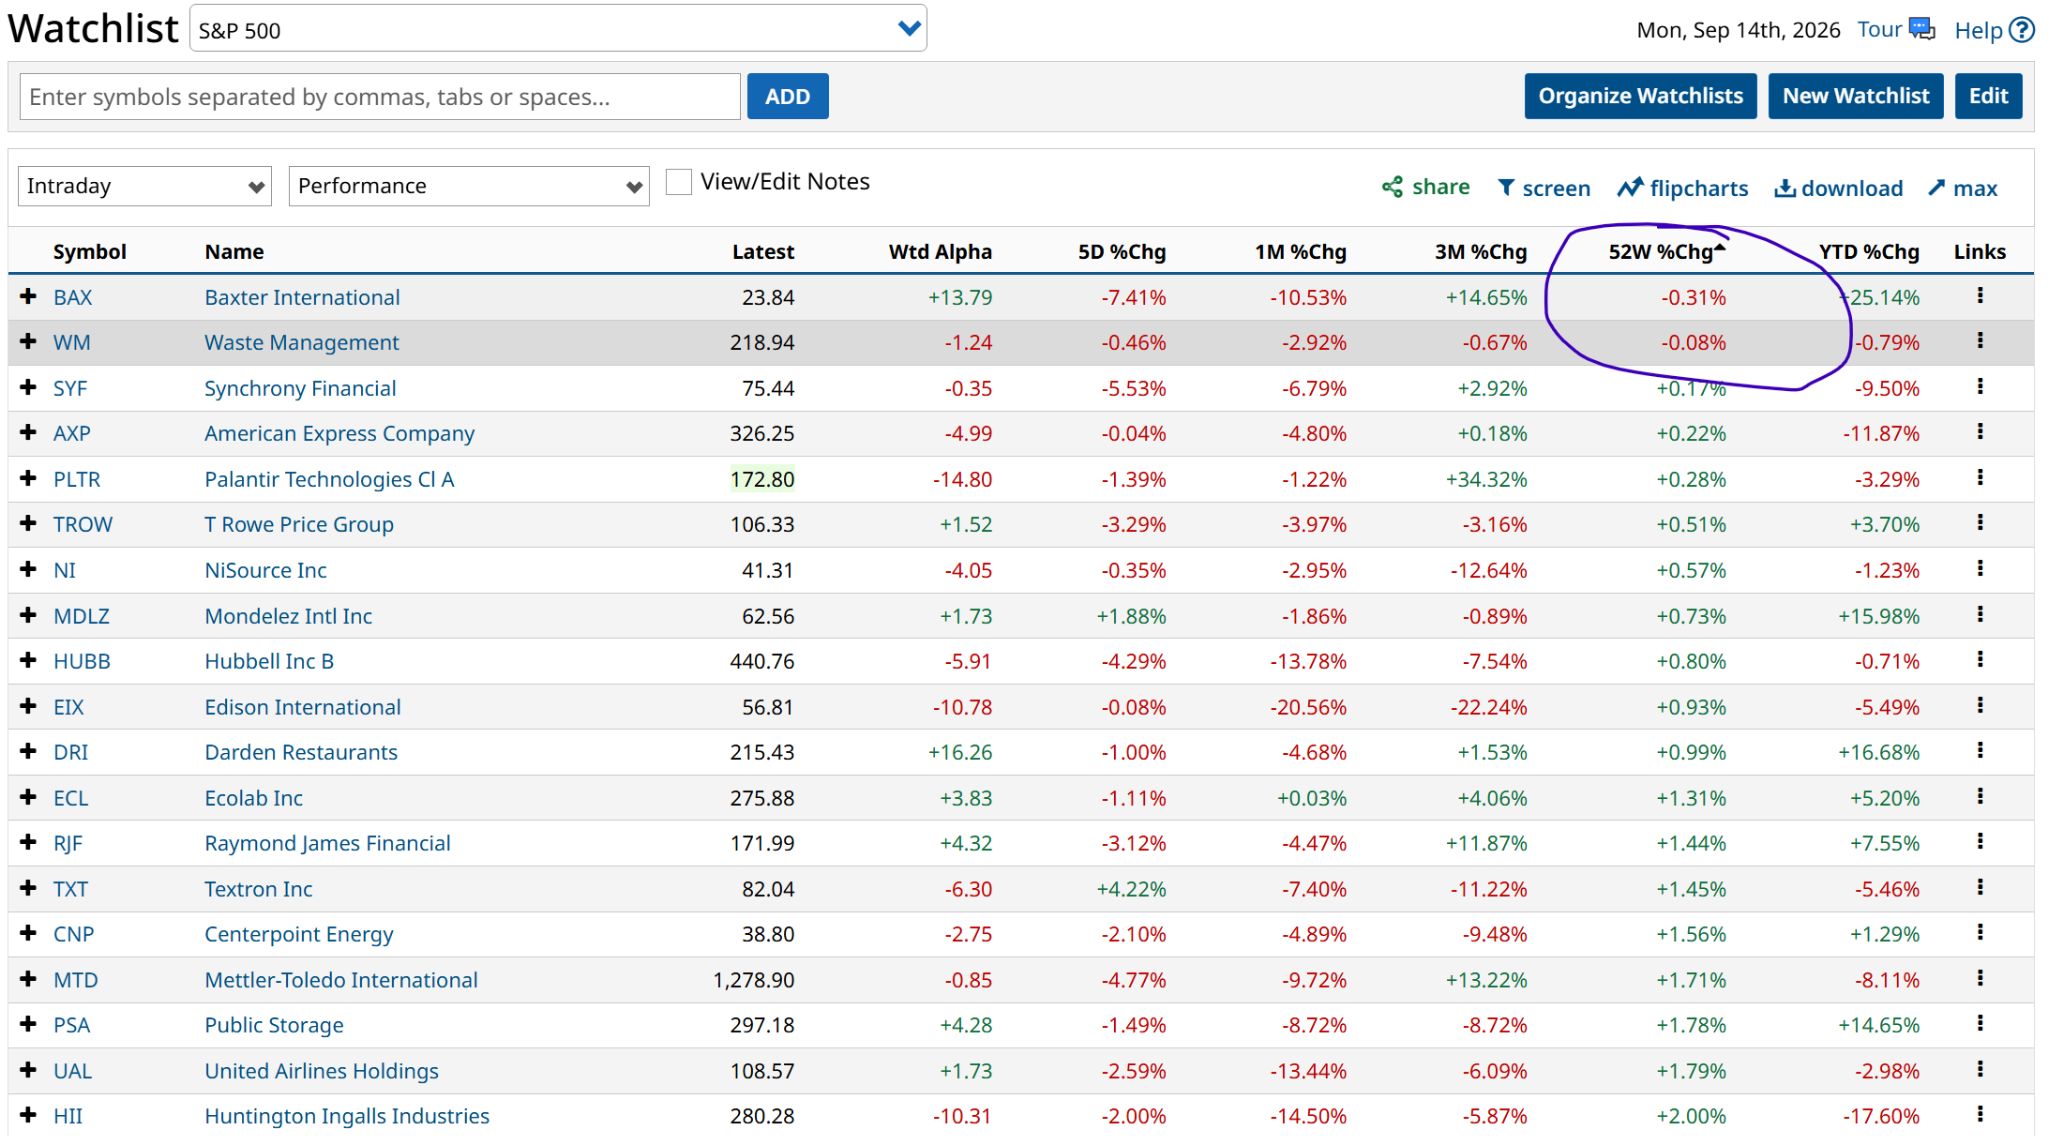
However, when we peel things back a bit, finding single stock investments is tough. Very few names appear to be priced to move higher on a multi-year, forward basis. Even with the S&P 500, if you go back over the past 52 weeks, scanning 100 stocks per page in reverse order of return (worst to best), you’ll see red ink bleed all the way into page three.
More Top Stocks Daily: Go behind Wall Street’s hottest headlines with Barchart’s Active Investor newsletter.
 www.barchart.com
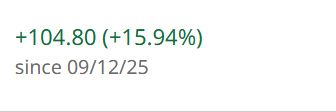
 In other words, more than 200 of the S&P 500 stocks have lost money over the past 52 weeks. Yet if you look up the SPDR S&P 500 ETF (SPY), it shows this:
 www.barchart.com
 How can an index be up 16%, yet more than four out of 10 component stocks are down? And more than 60% of the index’s constituents have made less than the SPY over time?
That’s today’s stock market for you. The big get bigger, and the rest get ignored. This is not a 52-week situation. It’s a 4-year period and counting.
I am not saying you can’t find stocks priced for a nice “pop.” But I was trained on stock selection as an endeavor to double my money within 4-5 years. That implies a 15%-18% compounded return, well above a “normal” index return. Today, you’re more likely to double your money in two months on a stock with no earnings, only to see it fall back to earth.
That’s what has led me to de-emphasize long-term stock selection in my own portfolio. And to look for something, anything, that might produce a regular stream of good trading ideas.
How the J-Pattern Indicator Identifies Potential Stock Winners
The J-Pattern seems to be having its “moment” in 2026. It has been around for a while, and like any indicator, can be inconsistent at times. However, in this skittish, chaotic market climate, it appears to be more reliable than usual.
The J-Pattern occurs in four steps: up, down, up, down. The key step is the second, in that it is really just a “pause that refreshes” before a stronger up-move. The trick with this indicator is that sometimes the moves happen so fast, stocks hit escape velocity too quickly, leaving little remaining room to profit without taking on a lot more risk.
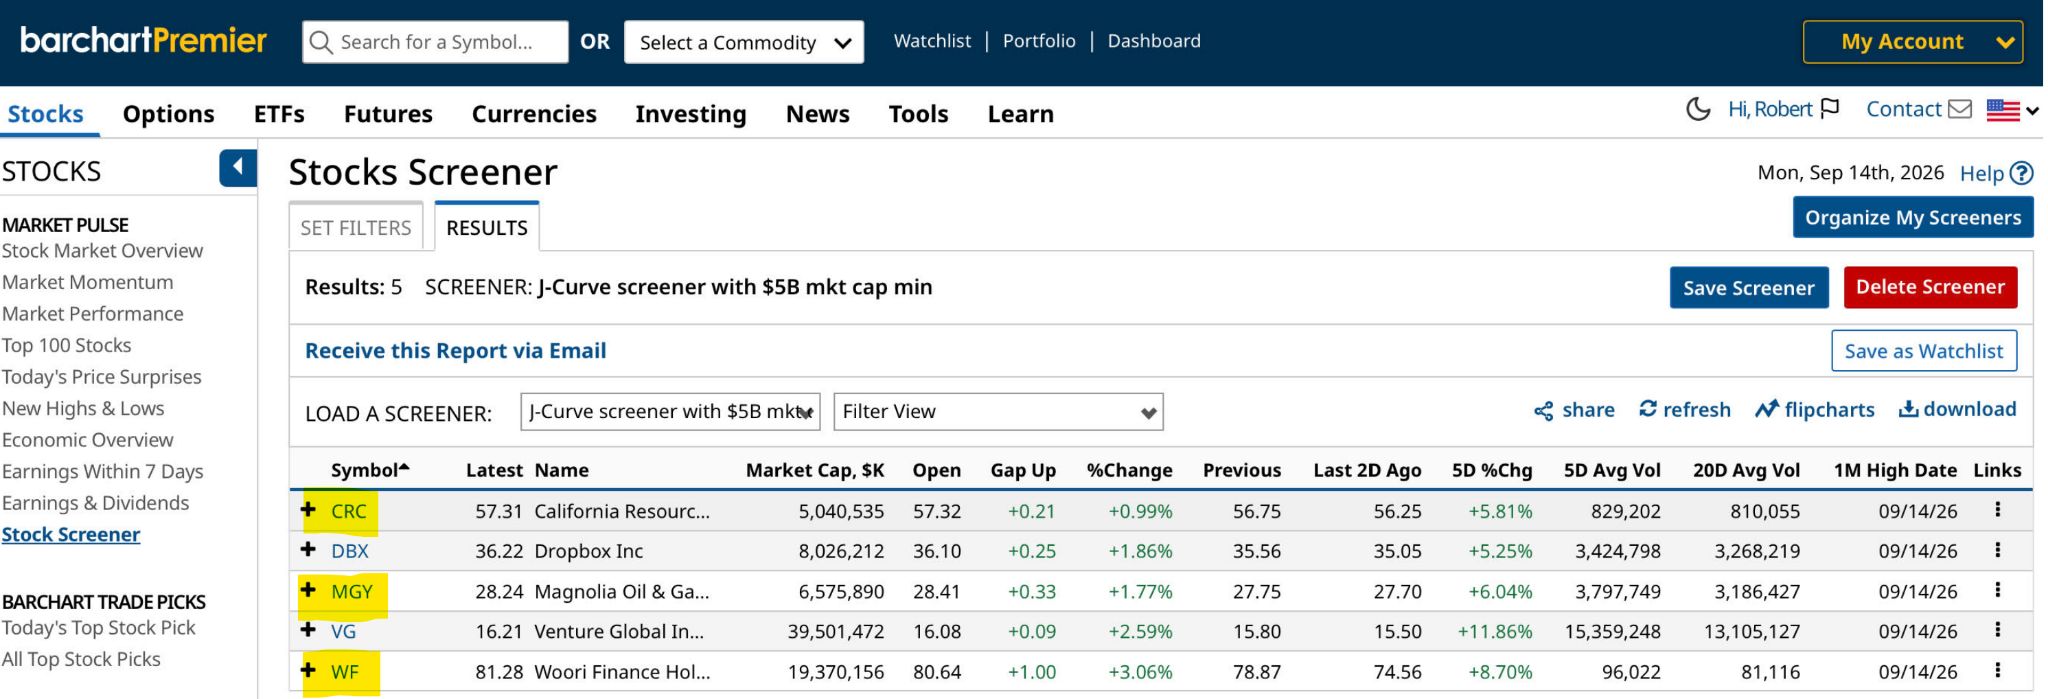
Still, I run this Barchart Screener at least weekly for myself, with one extra filter. I screen for stocks with at least a $5 billion market cap. I’m trying to avoid the shenanigans that occur more frequently with the very smallest stocks.
Here’s what that screener produced on Monday morning. Five stocks, three of which I highlighted in yellow below. Those three look better to me than the other two.
 www.barchart.com
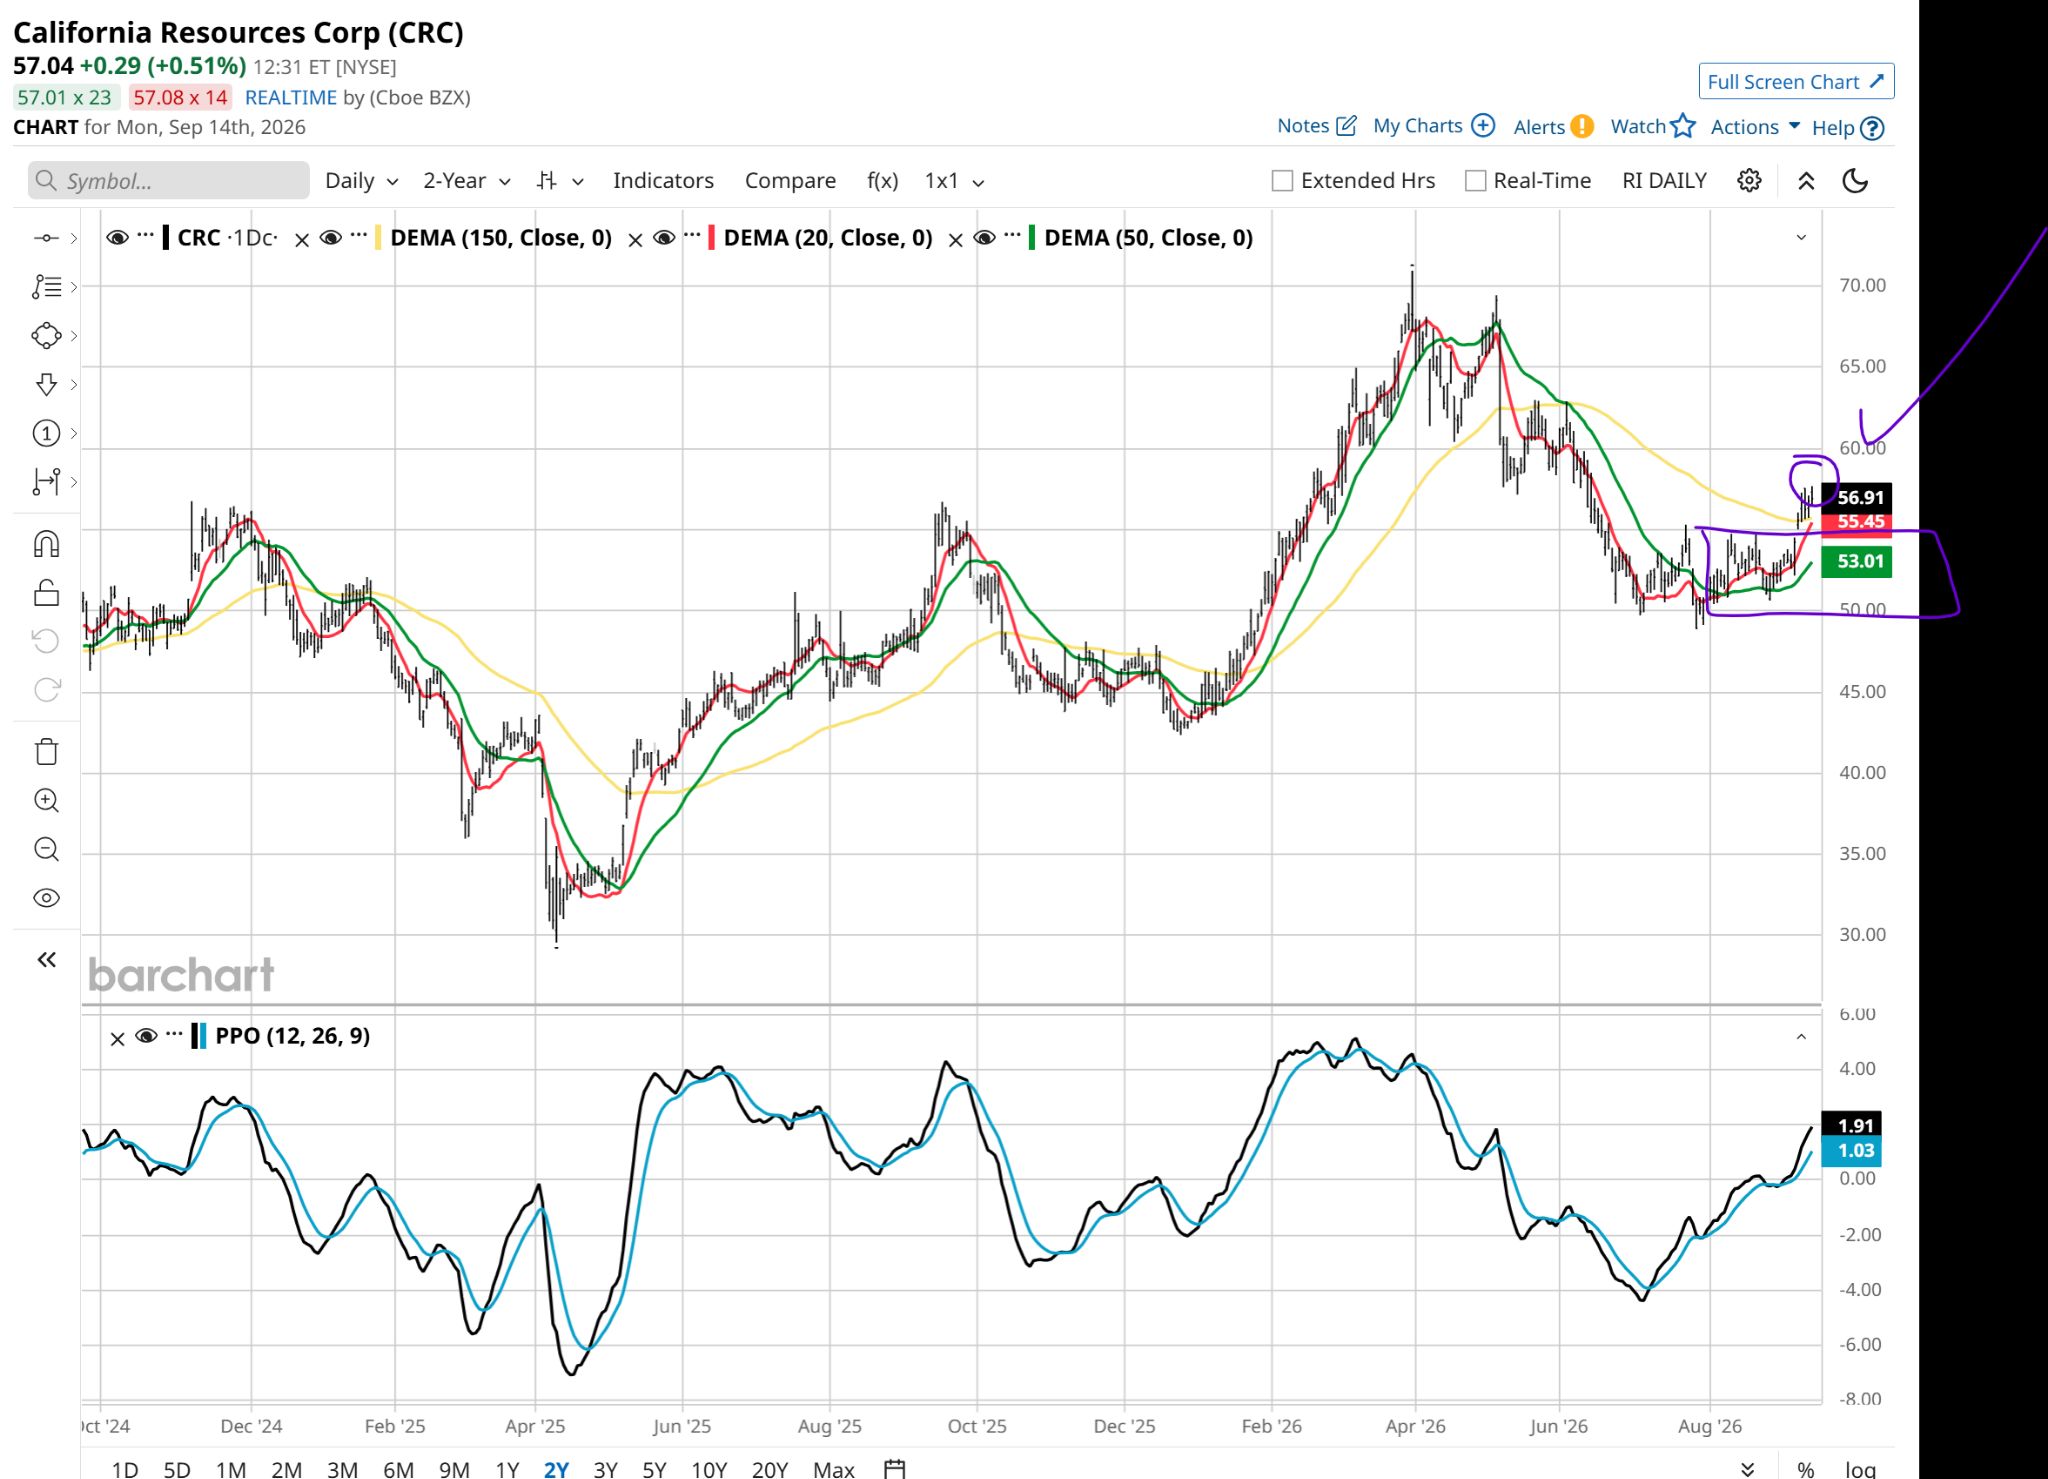
 Here’s what I saw, using the first one, California Resources (CRC), as an example.
 www.barchart.com
 With this or any other indicator, I find safety in numbers. That is, I’m more likely to find 10 to 20 J-Pattern stocks and allocate small amounts to them all, then determine which ones are worth holding for more than a few days.
And, even when things go well for a stock, the issue these days is limited upside potential. Again with CRC as an example, there was a time when seeing that stock move toward $57 with a recent high around $70 would make me think “20%+ move coming.” But I have seen too many fits and starts, even with a solid indicator like this one, to not be more cautious than usual.
The J-Pattern is a regular scan for me. And as with all Barchart screeners, they update continuously throughout the day. If I ever had the time, I’d just try to run a model portfolio that buys them as they roll into the screener, and set sell rules. My suspicion is there could be some serious alpha there, at least in this market environment.
However, since I have created my own technical indicator as featured here (The ROAR Score), I checked to see if my own proprietary tool is in sync with the J-Pattern screener I ran. It sure is!
This chart of CRC shows exactly what I’d hope it did to match the J-Curve signal. A gradual ascent from the 20-30 area (red zone, higher risk) to the 50 area (neutral, but improving). For a researcher like me, that opens up all kinds of possibilities to explore, as we continue to advance what we are doing in the ROAR “lab.”
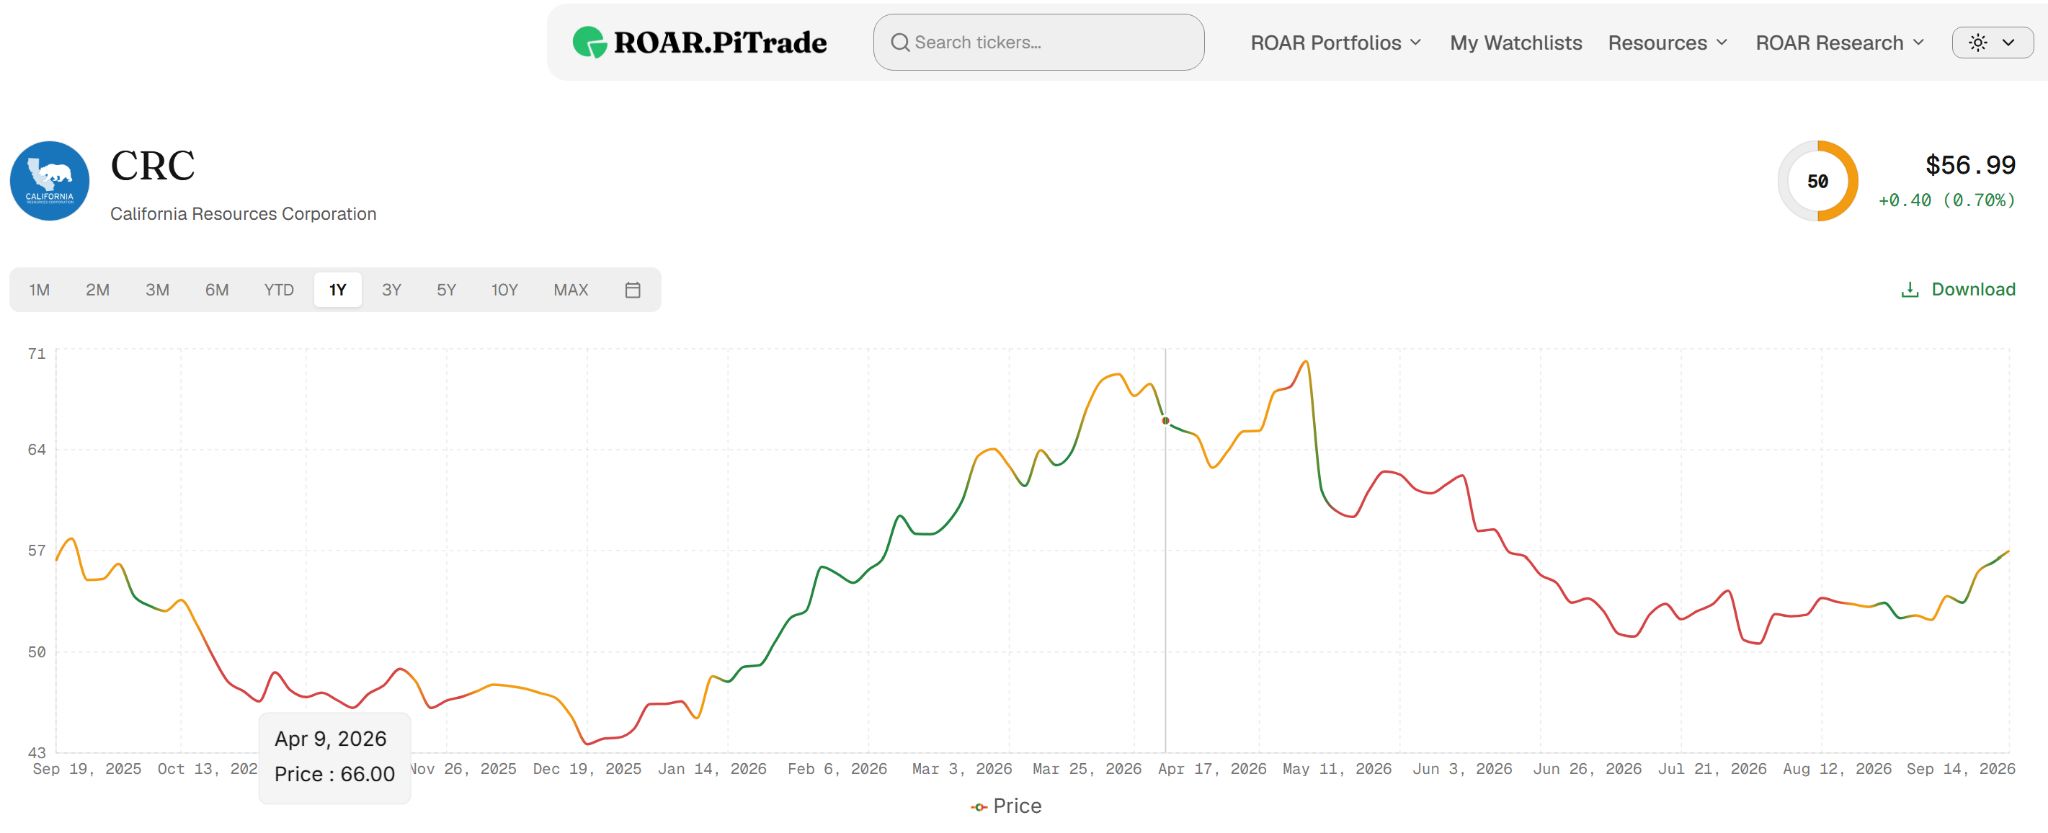 Chart courtesy of Rob Isbitts via ROAR.PiTrade.com
 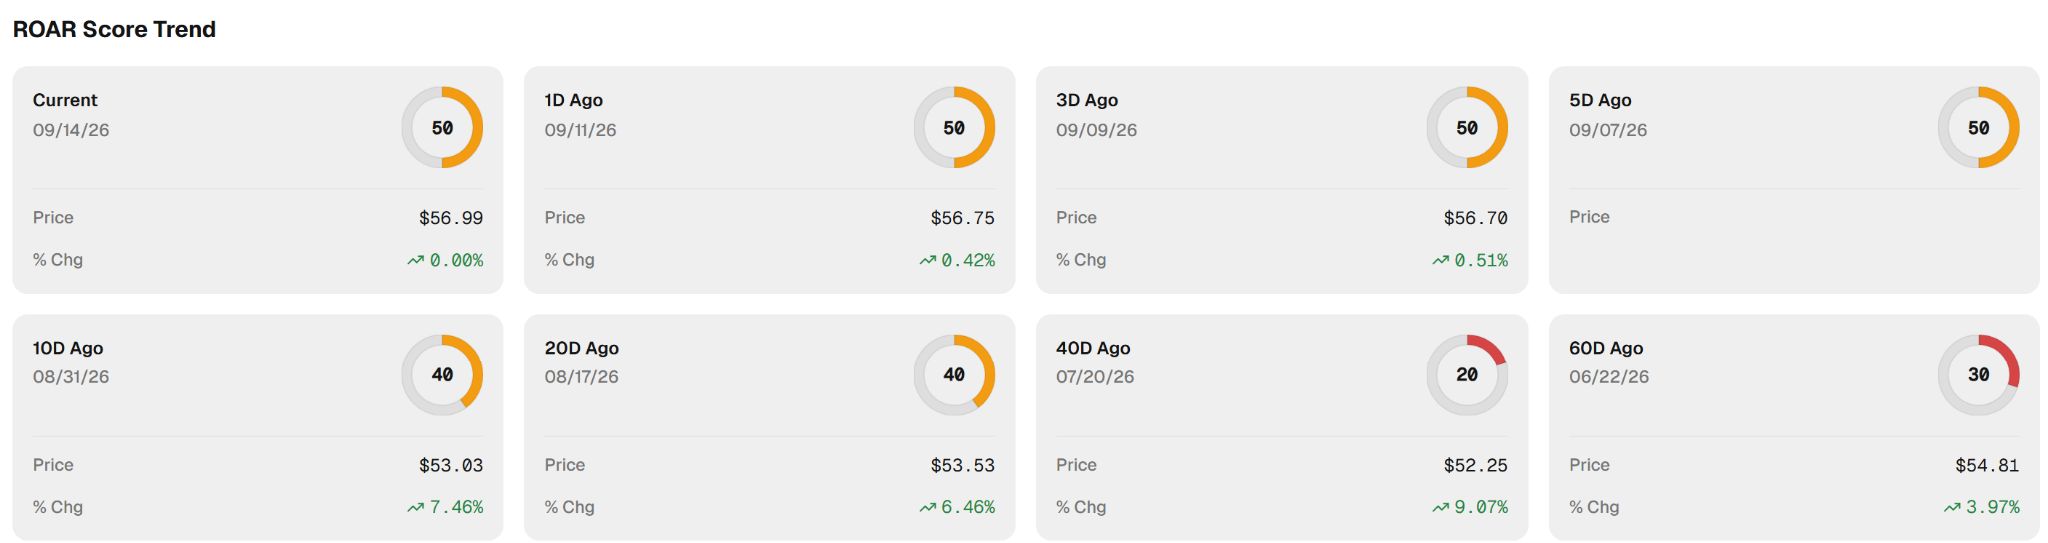 Chart courtesy of Rob Isbitts via ROAR.PiTrade.com
 The J-Pattern is also known as the “J-Hook,” not to be confused with the “Sky Hook” made famous by Dr. J’s onetime competitor Kareem Abdul-Jabbar. I don’t have a great hook shot. But when it comes to finding niche trading strategies like those displayed 24/7 at Barchart.com, there are no barriers to entry.
Rob Isbitts is a semi-retired CIO, former fiduciary investment advisor, and Barchart columnist. Check out his other work at ETFYourself.com (featuring the Fresh Charts weekly trading post), and ROAR.PiTrade.com, helping investors to better-manage their own portfolios.
On the date of publication, Rob Isbitts did not have (either directly or indirectly) positions in any of the securities mentioned in this article. All information and data in this article is solely for informational purposes. For more information please view the Barchart Disclosure Policy here.
More news from Barchart
Dear Tesla Stock Fans, Mark Your Calendars for October 1 How I’m Using This Great Barchart Stock Screener to Feel Like the ‘Dr. J’ of Trading If You Missed the Nancy Pelosi Rally, Here’s the Case for Buying Bloom Energy Stock Now ’AI Not Worth Pursuing’ If It’s Not ‘Helping Humanity.’ Microsoft’s Satya Nadella Pushes Back on Anthropic’s Control Framing and Offers a Practical Way Out.