


I last wrote about U.S. natural gas futures and the upcoming peak demand season on Barchart on September 29, 2026, when I concluded with the following:
I expect a volatile winter season in the natural gas futures market as European shortages could drain U.S. stocks as LNG demand increases. However, the weather and temperatures in the U.S. and Europe from November through February will determine how high natural gas prices can rise. I believe the downside in natural gas prices could be limited over the coming weeks and months, but careful attention to risk-reward dynamics is always advisable in the volatile energy commodity.
Don’t Miss a Day: From crude oil to coffee, sign up free for Barchart’s best-in-class commodity analysis.
Nearby NYMEX natural gas futures traded at $3.13 on September 28, 2026, with January 2027 delivery at $3.862 per MMBtu. In late October, the nearby and January 2027 prices were lower, which could be an opportunity. U.K. and Dutch prices were also slightly higher on September 28 at 185.08 and 73.165, but have exploded over the past months.
U.S. natural gas price is trending higher
The daily continuous NYMEX U.S. natural gas futures chart shows the bullish trend in the energy commodity since the August 6 $2.616 per MMBtu low.
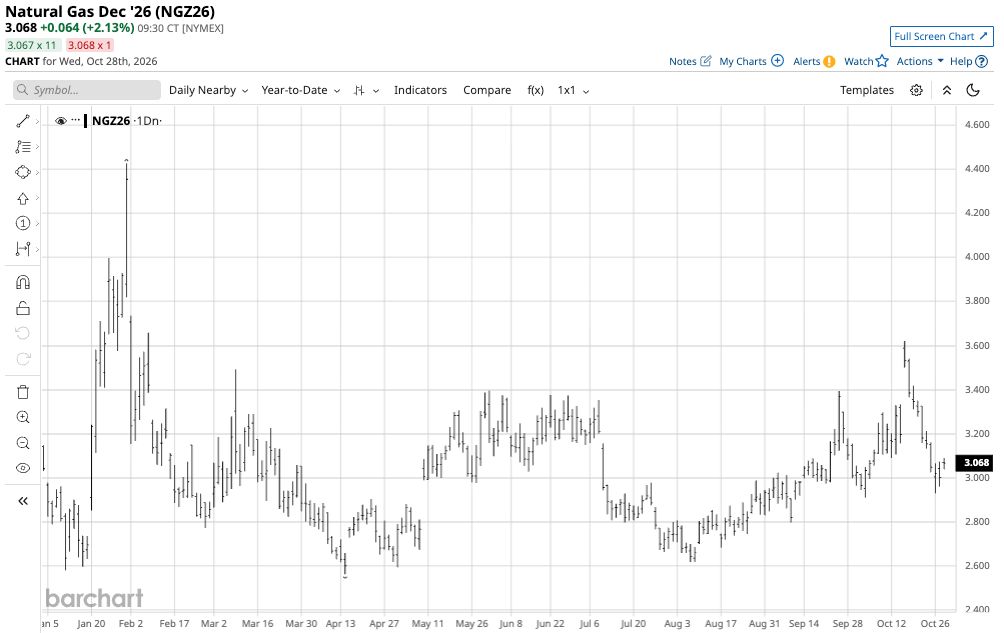
The chart shows the rally to a high of $3.622 on October 15. At over $3.00 per MMBtu in late October, U.S. natural gas remains in a bullish trend of higher lows but has corrected toward the latest higher low at just over $2.90 per MMBtu.
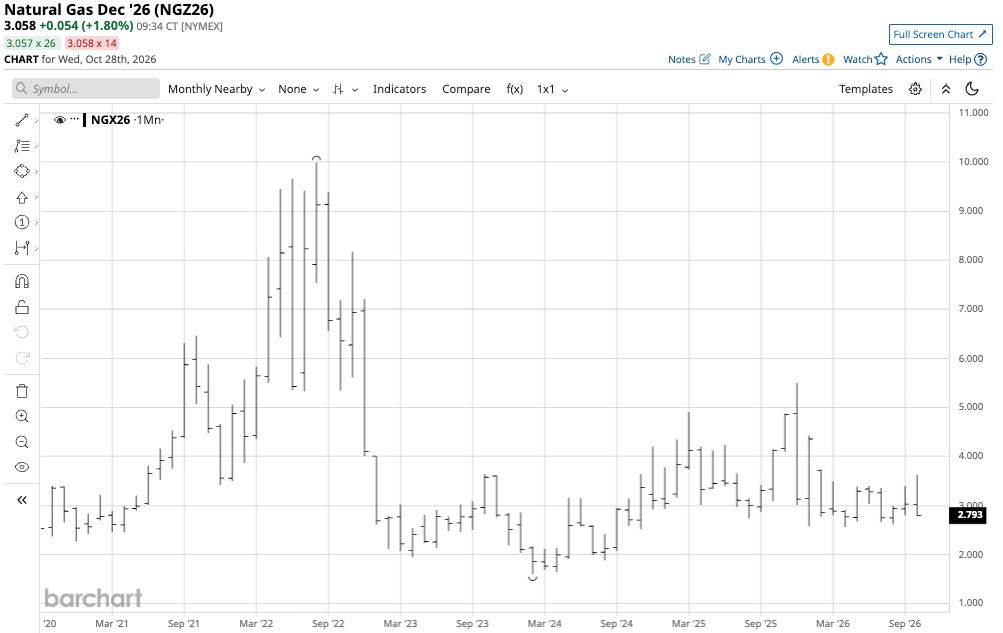
The monthly chart shows that the range for U.S. natural gas futures prices in October 2026 was from $2.704 to $3.622 per MMBtu. In October 2025, the range was from $3.089 to $4.124. In October 2024, the range was from $2.588 to $3.146. In October 2023, the range was from $2.820 to $3.643. Although the October 2026 range was lower than in October 2025, price action over the coming weeks and months will depend on weather conditions and heating demand during the peak season. However, LNG demand could affect prices, as European prices have soared.
U.K. and Dutch prices trend higher
European natural gas prices have deviated from previous years in 2026.
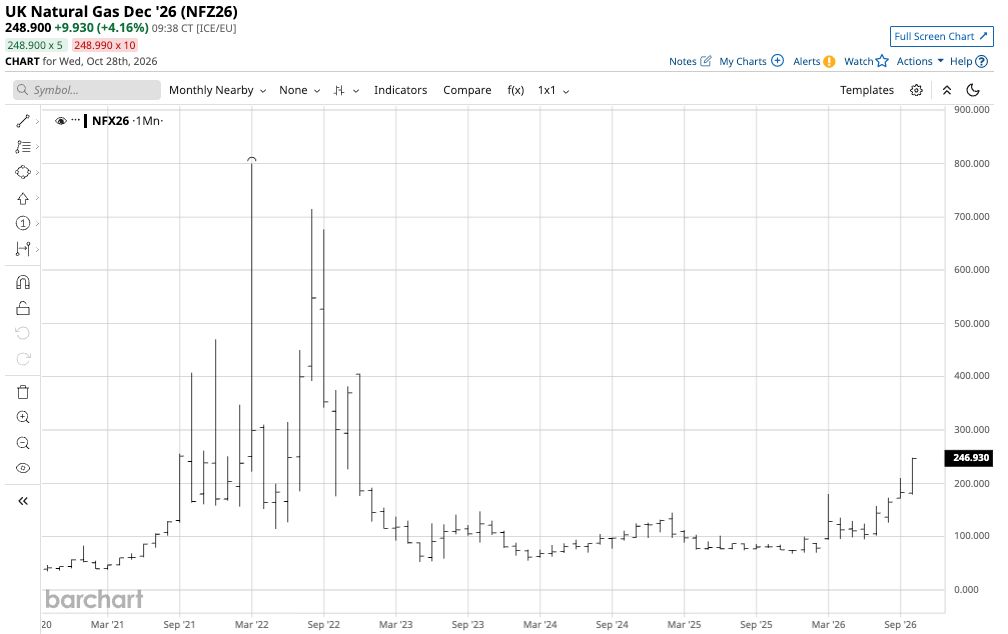
The monthly chart shows that the range for ICE U.K. natural gas futures prices in October 2026 was from 179.32 to 247.99 GBP per 1,000 therms. In October 2025, the range was from 78.77 to 86.38. In October 2024, the range was from 92.56 to 111.50. In October 2023, the range was from 88.39 to 147.88.
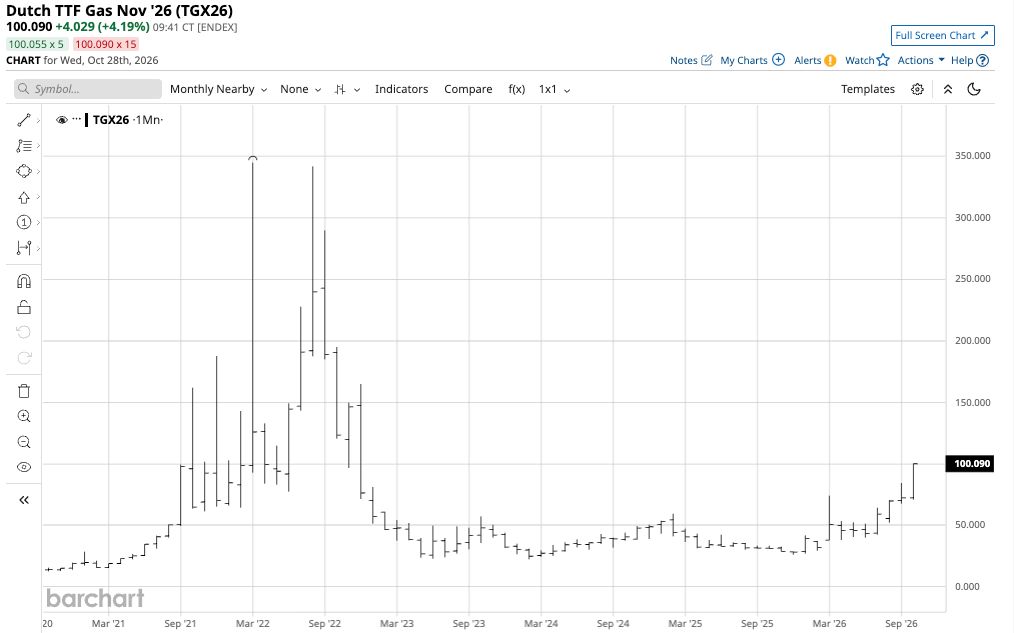
The monthly chart shows that the range for Dutch natural gas futures prices in October 2026 was from 71.05 to 100.30 euros per MWh. In October 2025, the range was from 30.735 to 33.635. In October 2024, the range was from 37.40 to 44.15. In October 2023, the range was from 35.605 to 57.405.
The potential for explosive moves in Europe
U.K. and Dutch natural gas futures prices in 2026 highlight significant supply concerns.
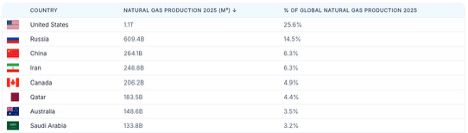
The world’s leading natural gas-producing countries in 2025 were:
 Source: worldpopulationreview.com
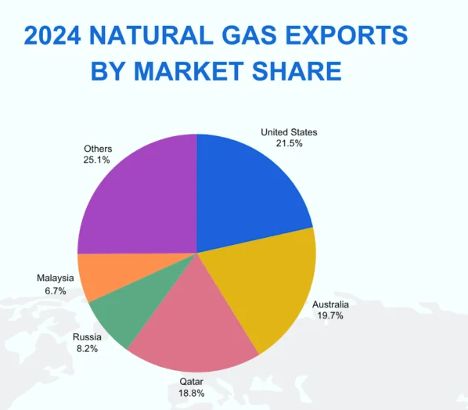
The world’s leading natural gas exporting countries in 2024 were:
 Source: tradeint.com
The U.K., the Netherlands, and other Western European countries had depended on the Russian pipeline network for natural gas supplies until Russia invaded Ukraine and sanctions and retaliation cut off those supplies. Europe then turned to the Middle East, where Qatar is a leading natural gas producer and exporter. In 2026, the war between the U.S. and Iran has caused attacks on Middle Eastern oil and gas infrastructure by Iran and its proxies, causing supply concerns for Europe.
The Netherlands stores gas for all of Europe in its underground gas storage facilities. The Netherlands faces a gas shortage as it will miss its target to fill its gas reserves before the 2026/2027 winter season, with significant ramifications across Western Europe at a time when sanctions on Russia and war in the Middle East are limiting supplies.
U.S. stocks will likely be lower than the start of last year’s peak season
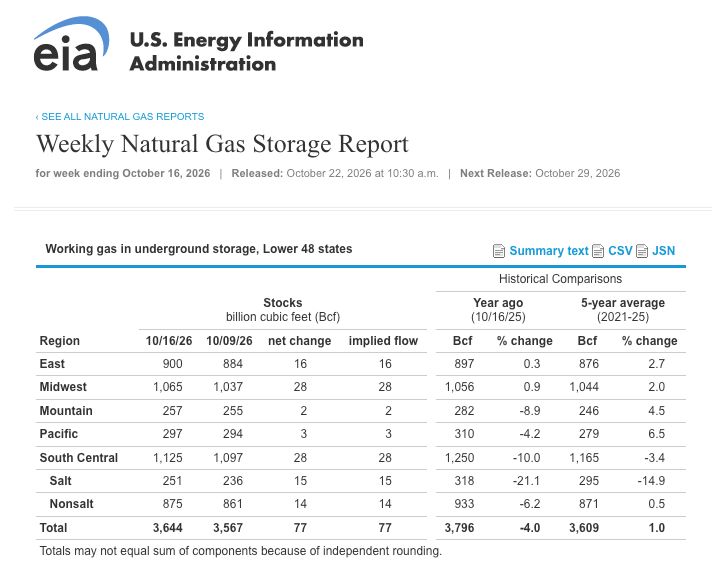
As of the week ending on October 2, 2026, natural gas inventories across the United States were lower than at the beginning of October 2025, but still slightly above the five-year average for early October.
 Source: EIA
At 3.644 trillion cubic feet (TCF), U.S. natural gas in storage was 4.0% lower than last year’s level, but still 1.0% above the five-year average. Natural gas stocks ended the 2025 injection season with 3.96 tcf in storage. Inventories will need to rise by 316 billion cubic feet (bcf) by late November to reach last year’s level. With three to four weeks until the withdrawal season, the average injection needed is around 90 bcf. As injections begin to tail off in November with increased heating demand, stocks are likely to fall short of last year’s peak level.
The potential for a European natural gas shortage is likely increasing demand for U.S. LNG. A cold winter in Europe and the U.S. could quickly draw down U.S. inventories in December 2026 through March 2027, putting upward pressure on U.S. NYMEX natural gas futures.
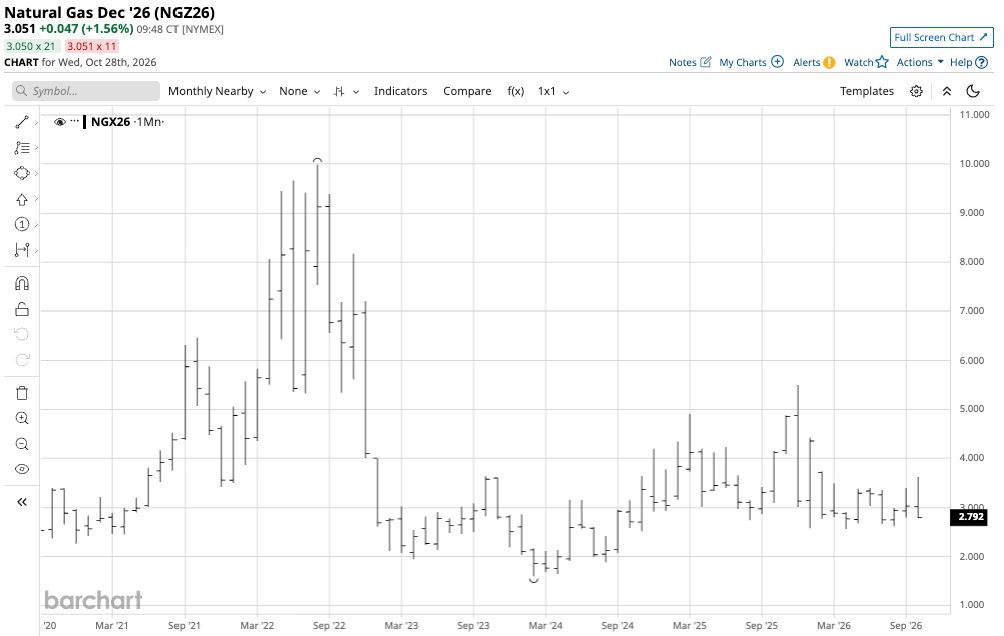
The monthly chart shows that U.S. natural gas futures reached a high of $5.496 per MMBtu in December 2025.
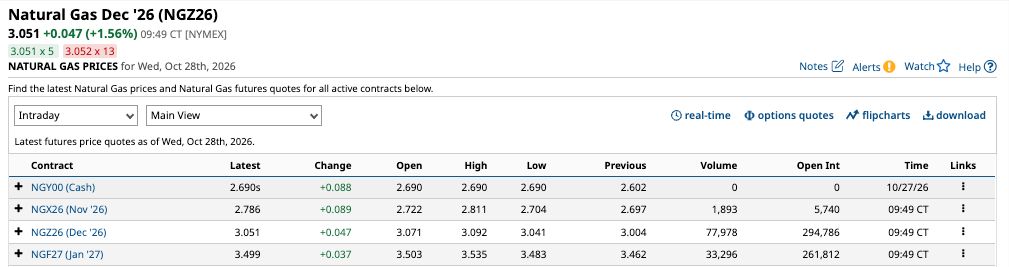
The forward curve shows that at below $3.50 per MMBtu for January 2027 delivery, natural gas could be inexpensive at current levels due to current inventory levels, uncertainty about weather during the upcoming winter, and the potential for European gas shortages.
UNG is the unleveraged U.S. natural gas ETF
While the most direct route for a risk position in U.S. natural gas prices is the futures and futures options on the CME’s NYMEX division, the U.S. Natural Gas Fund ETF (UNG) tracks U.S. NYMEX natural gas futures prices.
At $9.58 per share, UNG has over $533.5 million in assets under management. UNG trades an average of over 26.45 million shares per day, making it a liquid product that tracks the volatile natural gas futures market.
In 2025, UNG traded in a range from $11.47 to $24.33 per share. In 2026, UNG’s range has been from $9.31 to $17.02 per share. UNG is an unleveraged ETF in a highly volatile energy commodity. I believe that the downside risk in natural gas is limited during the 2026/2027 peak demand season. Therefore, buying UNG at the current price level, leaving room to add to a long position at lower prices over the coming weeks, could be optimal.
The 2026/2027 natural gas withdrawal season could have explosive price potential. UNG is an ETF that will track the energy commodity’s price.
On the date of publication, Andrew Hecht did not directly have a position in any of the securities mentioned in this article. All information and data in this article is solely for informational purposes. For more information please view the Barchart Disclosure Policy here.
More news from Barchart
What is on the Horizon for the 2026/2027 Natural Gas Withdrawal Season? Billionaire Investor Jeffrey Gundlach Warns the Fed Is ‘Falling Behind the Curve.’ The Bond Market Seems to Agree. Dear ExxonMobil Stock Fans, Mark Your Calendars for October 30 Dear Shell Stock Fans, Mark Your Calendars for October 29