


Intercontinental Exchange ICE reported third-quarter 2026 adjusted earnings of $2.02 per share, up 18.1% year over year and ahead of the Zacks Consensus Estimate of $1.97 by 2.54%. Net revenues of $2.77 billion climbed 14.7% and surpassed the consensus mark of $2.73 billion by 1.33%.
Stronger energy and financial markets trading lifted exchange revenues, while fixed income data continued to grow. Transaction-based net revenues increased 23.2% to $1.400 billion, and recurring revenues advanced 7.1% to $1.365 billion.
Shares of ICE gained about 0.3% in the pre-market trading session to reflect the outperformance.
Intercontinental Exchange Inc. Price, Consensus and EPS Surprise
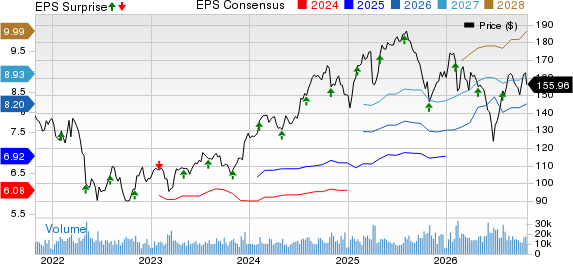
Intercontinental Exchange Inc. price-consensus-eps-surprise-chart | Intercontinental Exchange Inc. Quote
ICE Exchanges Gain From Broad-Based Trading Growth
Exchanges net revenues climbed to $1.542 billion from $1.265 billion a year ago. Energy generated $603 million versus $482 million, while financials contributed $190 million compared with $139 million. Agriculture and metals revenues rose to $83 million from $51 million.
Cash equities and equity options net revenues improved to $132 million from $105 million. Data and connectivity services delivered $292 million, up from $264 million, and listings increased to $130 million from $125 million. Adjusted operating income rose to $1.169 billion from $924 million, lifting the adjusted margin to 76% from 73%.
Intercontinental's Data Business Builds Recurring Sales
Fixed income and data services revenues grew to $674 million from $618 million. Fixed Income Data and Analytics contributed $336 million versus $311 million, while Data and Network Technology increased to $202 million from $184 million. CDS Clearing rose to $102 million from $90 million.
Recurring revenues advanced to $538 million from $495 million. Annual subscription value reached $2.107 billion, compared with $1.955 billion a year earlier, indicating a larger contracted subscription base. Adjusted operating income was $309 million, up from $282 million, with the adjusted margin widening to 46% from 45%.
ICE Mortgage Revenues Climb, Profitability Slips
Mortgage technology revenues increased to $549 million from $528 million. Servicing Software was the largest contributor at $229 million versus $216 million, while Origination Technology edged up to $189 million from $188 million. Closing Solutions increased to $60 million from $58 million, and Data and Analytics reached $71 million from $66 million.
Recurring revenues rose to $405 million from $391 million. However, adjusted operating expenses increased to $330 million from $304 million, outpacing revenue growth. Adjusted operating income fell to $219 million from $224 million, and the adjusted margin narrowed to 40% from 42%.
Intercontinental Sees Higher Profits Despite Costs
Consolidated adjusted operating expenses increased to $1.068 billion from $981 million. Compensation costs reached $526 million from $483 million, while technology and communication expenses rose to $245 million from $219 million. Acquisition-related transaction and integration costs also increased to $49 million from $9 million on a GAAP basis.
Adjusted operating income grew to $1.697 billion from $1.430 billion, while the adjusted margin widened to 61% from 59%. GAAP operating income improved to $1.410 billion from $1.174 billion. GAAP earnings were $1.67 per share, compared with $1.42 a year earlier.
ICE Cash Generation Fuels Shareholder Returns
Operating cash flow for the first nine months of 2026 rose to $4.486 billion from $3.387 billion. Adjusted free cash flow grew to $3.728 billion from $3.178 billion. Capital expenditures and capitalized software development costs totaled $664 million over the period.
ICE returned $2.486 billion to stockholders through September, including $1.6 billion in repurchases and $884 million in dividends. Unrestricted cash totaled $936 million at quarter-end, compared with $837 million at the end of 2025. Outstanding debt was $23.3 billion, including $3.704 billion in MarketAxess deal-related borrowings.
Intercontinental Raises Outlook as MarketAxess Deal Advances
Management now expects 9% growth in exchange recurring revenues in 2026, compared with its earlier high-single-digit outlook. Fixed income and data services recurring growth forecast is 8%, up from the prior 7%-8% range. Mortgage technology revenues are still projected to grow at a low-to-mid-single-digit rate.
For the fourth quarter, ICE projects adjusted operating expenses of $1.082-$1.092 billion and adjusted non-operating expenses of $175-$185 million. It forecasts 558-563 million weighted average shares outstanding and approximately $1.050 billion of 2026 capital expenditures and capitalized software spending, compared with the prior $850 million forecast.
ICE received early termination of the U.S. antitrust waiting period for its planned MarketAxess acquisition on Oct. 21. Other approvals and closing conditions remain outstanding. The company now expects to close the transaction in the first quarter of 2027, ahead of its earlier first-half 2027 timeline.
Zacks Rank
ICE currently carries a Zacks Rank #2 (Buy). You can see the complete list of today’s Zacks #1 Rank (Strong Buy) stocks here.
Performance of Other Industry Players
CME Group Inc. CME reported third-quarter 2026 adjusted earnings per share of $3.02, which beat the Zacks Consensus Estimate by 1.3%. The bottom line increased 12.7% year over year. CME Group’s revenues of $1.73 billion increased 13% year over year. The year-over-year increase was primarily due to higher clearing and transaction fees, market data and information services, and other factors. The top line beat the Zacks Consensus Estimate by 1.2%.
Total expenses rose 5.5% year over year to $595.9 million, attributable to higher technology, depreciation and amortization, licensing and other fee agreements, and other expenses. Operating income increased 17.3% from the prior-year quarter to $1.14 billion.
Nasdaq, Inc. NDAQ reported third-quarter 2026 non-GAAP earnings of $1.04 per share, which increased 18% year over year. The figure beat the Zacks Consensus Estimate of $1.02 by 1.96%.
Net revenues increased 13% to $1.48 billion and topped the consensus estimate of $1.46 billion by 1.4%. Growth was driven by strong Index and Financial Technology performance. Annualized recurring revenues rose 12% to $3.37 billion, with organic growth reaching 14%.
Nasdaq updated its 2026 non-GAAP operating expense guidance to $2.550-$2.580 billion from the previous range of $2.530-$2.570 billion. The revision follows increased compensation costs tied to revenue execution and continued investments in technology.
Upcoming Release
Cboe Global Markets, Inc. CBOE is set to report third-quarter 2026 results on Oct. 30, before market open. The Zacks Consensus Estimate for third-quarter earnings per share is pegged at $3.40, suggesting an increase of 27.3% from the year-ago quarter’s reported figure.
CBOE’s earnings beat estimates in each of the last four quarters.
Zacks' Research Chief Names "Stock Most Likely to Double"
Our team of experts has just released the 5 stocks with the greatest probability of gaining +100% or more in the coming months. Of those 5, Director of Research Sheraz Mian highlights the one stock set to climb highest.
Of course, all our elite picks aren't winners, but this one could far surpass earlier Zacks' Stocks Set to Double like D-Wave Quantum, which shot up +680.1%.
Free: See Our Top Stock And 4 Runners UpWant the latest recommendations from Zacks Investment Research? Today, you can download 7 Best Stocks for the Next 30 Days. Click to get this free report
Intercontinental Exchange Inc. (ICE): Free Stock Analysis Report
CME Group Inc. (CME): Free Stock Analysis Report
Nasdaq, Inc. (NDAQ): Free Stock Analysis Report
Cboe Global Markets, Inc. (CBOE): Free Stock Analysis Report
This article originally published on Zacks Investment Research (zacks.com).