

META
#8
Meta Platforms, Inc. - Class A Common Stock
642.6 2 USD
-0.01%
Market Price
Sektör: İletişim Hizmetleri
Baz: USD
Kar Para Birimi: USD
Günlük Aralık
Yıllık Aralık
Günlük Değişim
-0.96%
Aylık Değişim
-16.42%
6 Aylık Değişim
-4.23%
Yıllık Değişim
-14.27%
Önceki Kapanış
648.8 5
Open
638.1 2
Düşük
633.2 7
Yüksek
648.0 4
Financials
2012
Annual report, FY2012
Meta Platforms, Inc. annual report, FY2012
10-K
Current report, 28 Nov 2012
Meta Platforms, Inc. current report, 28 November 2012
8-K
Current report, 25 Oct 2012
Meta Platforms, Inc. current report, 25 October 2012
8-K
Current report, 23 Oct 2012
Meta Platforms, Inc. current report, 23 October 2012
8-K
Current report, 12 Oct 2012
Meta Platforms, Inc. current report, 12 October 2012
8-K
Quarterly report, Q3 FY2012
Meta Platforms, Inc. quarterly report, Q3 FY2012
10-Q
Current report, 30 Aug 2012
Meta Platforms, Inc. current report, 30 August 2012
8-K
Current report, 26 Jul 2012
Meta Platforms, Inc. current report, 26 July 2012
8-K
Quarterly report, Q2 FY2012
Meta Platforms, Inc. quarterly report, Q2 FY2012
10-Q
Current report, 24 Jun 2012
Meta Platforms, Inc. current report, 24 June 2012
8-K
Haberler
Haftanın öne çıkan hisseleri
Blackstone’un 2,3 Milyar Dolarlık CoreWeave Bahsi, Trilyon Dolarlık Bir Yapay Zekâ Kredilendirme Patlamasını Tetikledi
Yapay zeka çipi satışları ’temellerden kopuk’ diyor LYNX
ÖZEL: Paul Kedrosky, Yapay Zeka Benimsenmesi Artarken Bile Yapay Zeka Veri Merkezi Patlamasının Başarısız Olabileceği Konusunda Uyarıyor
Meta’nın oy hakkı olmayan hisseleri Zuckerberg’in kontrolünü koruyacak
BofA, Meta’yı en iyi yapay zeka hissesi seçti
Meta’nın sermaye planları yapay zeka patlamasının zayıflığını ortaya koyuyor
Argus, dava anlaşması sonrası Meta hissesi için görüşünü korudu
TSX vadeli işlemleri altın fiyatı düşüşü ve yapay zeka endişeleriyle geriledi
Anthropic’in 1,5 Trilyon Dolarlık Yolu %30 Marj Gerektiriyor: Makul, Ama Bunu Gerçekleştirmek Başka Bir Konu
Mercari hisseleri Meta AI ortaklığıyla yükseldi
Grafikler ve Fikirler
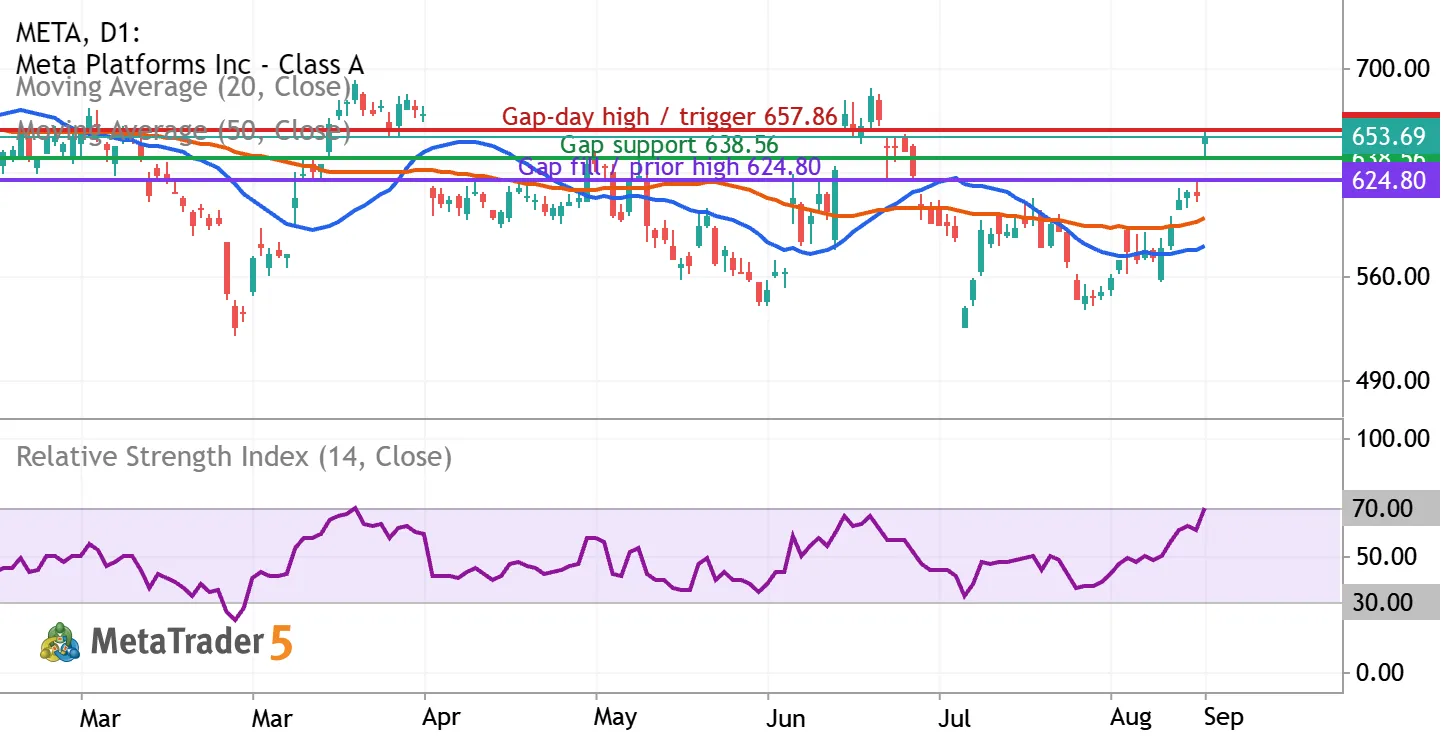
META: gap-up rally puts $638.56 support in focus
Meta Platforms (NASDAQ: META) | Daily chart | September 10, 2026 View: conditionally bullish, with patience after a sharp gap higher. Horizon: 2–4 weeks. META closed September 9 at $653.69, up 6.55%. The session low of $638.56 stayed above September 8’s $624.80 high, leaving an unfilled daily gap. Holding that gap would support continuation; a failure would weaken the breakout. Reading the indicators The blue line is the 20-day simple moving average, the orange line the 50-day simple moving average, and the lower panel is RSI(14), all using closing prices. At the September 9 candle, MetaTrader showed approximately $580.54, $598.58, and 70.43 respectively. Price is above both averages, but the 20-day average remains below the 50-day: this is a strong recovery without a fully bullish


The META doesn’t have other trading ideas at this time
Browse ready-made trading ideas or select a symbol and create your own
Go to Charts and Trading Ideas