Market Structure:
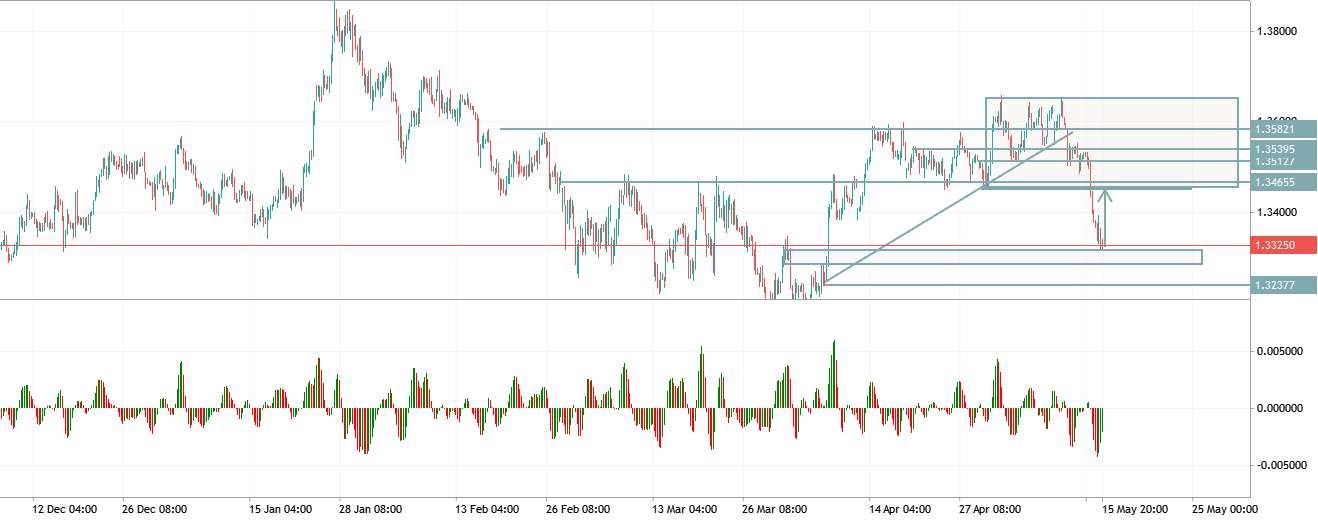
The chart shows a recent bearish breakdown after price failed to sustain above the ascending trendline and resistance zone around 1.3530–1.3580. Momentum shifted lower after rejection from the upper range, suggesting short-term bearish pressure.
Key Levels:
- Resistance: 1.3465 – 1.3539 (previous support turned resistance)
- Major Resistance: 1.3580 area
- Support: 1.3325 (current reaction zone)
- Lower Support: 1.3235 area
Technical View:
Price broke below structure support and dropped sharply into a demand/support area near 1.3325. A short-term pullback toward 1.3460–1.3500 is possible before continuation lower if sellers remain in control. Failure to reclaim the broken trendline favors bearish continuation.
Trading Bias:
- Bearish below 1.3465 → downside targets near 1.3325 then 1.3235
- Bullish recovery only if price reclaims 1.3530+ and holds above resistance
Risk Note:
Wait for confirmation (retest, rejection candle, or breakout confirmation) before entering trades; avoid chasing impulsive moves.

新评论