
Educational example · Historical EURUSD H4 review
A bullish liquidity sweep tells us something about a particular candle. Understanding what happens next requires a separate assessment of market structure.
Chart context and reference
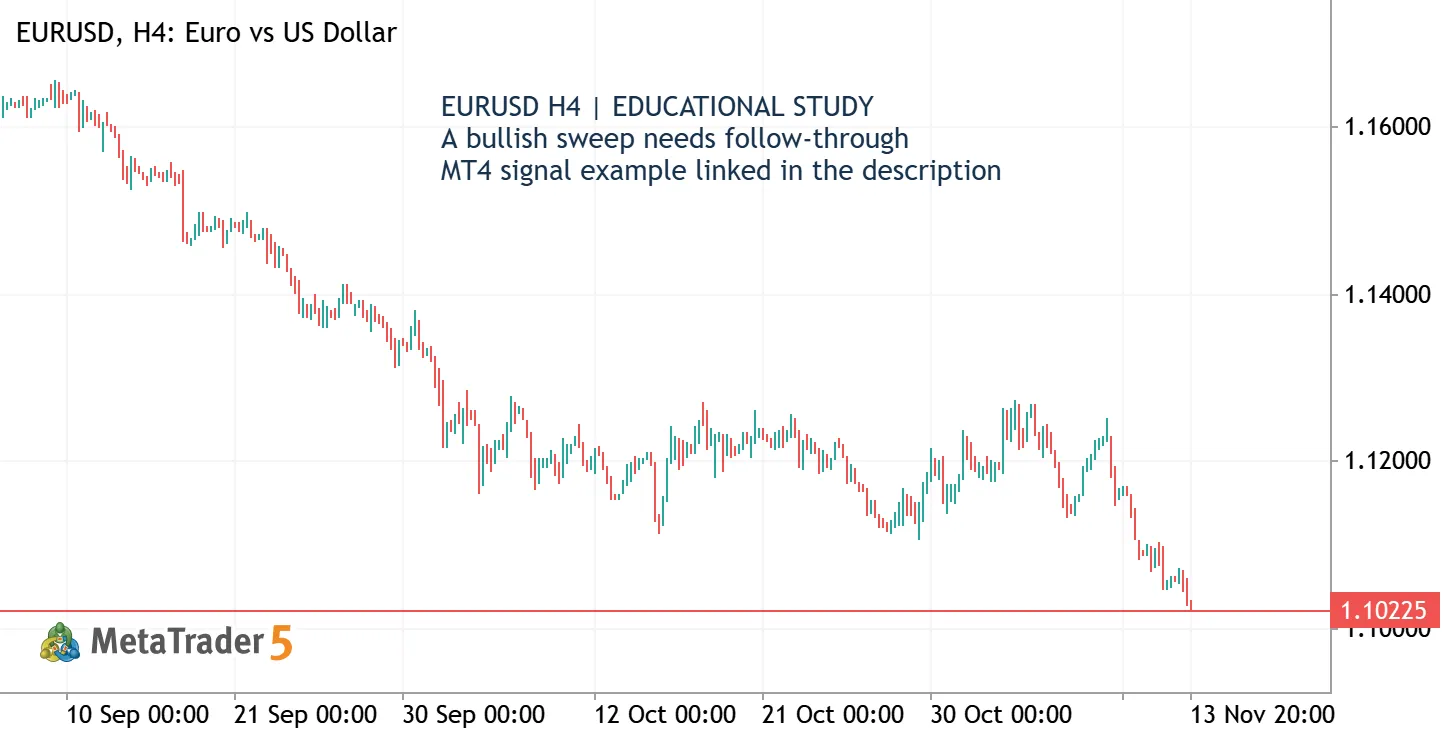
The attached MetaTrader chart provides EURUSD H4 price context. The Smart Liquidity Hunter signals discussed below come from a separate historical MT4 screenshot.
Historical MT4 reference chart:
https://forexsignal24.com/wp-content/uploads/2026/11/smart-liquidity-hunter-mt4-bullish.png
In the linked historical MT4 example, green bullish sweep markers appear while the broader price structure continues lower. That makes it a useful example of why a signal needs context.
What the marker represents
Smart Liquidity Hunter identifies an eligible, previously confirmed swing low. A qualifying candle trades below that reference, closes back above it, and passes the enabled penetration, wick and closing-position filters.
The evaluation uses a completed candle. An unfinished candle can still change its shape and closing position.
How I would review the setup
First, mark the reclaimed swing level and the sweep candle’s high and low. Then observe whether subsequent candles can hold above the reclaimed level and close above the sweep candle’s high.
That follow-through would support the bullish interpretation. It is a separate, manual confirmation framework; the indicator does not automatically apply this trading plan.
For this example, a subsequent close below the sweep candle’s low would invalidate the bullish rejection scenario. A return below the reclaimed swing level would be an earlier reason to reassess.
The practical lesson
Record the signal when the candle closes, then review what actually follows. Keep examples that fail as well as those that develop favourably.
Smart Liquidity Hunter uses OHLC prices as a proxy for liquidity. It does not observe resting orders or execute trades. This historical example illustrates a review process and makes no claim about the next market move.

 MQL5 个人资料






新评论