

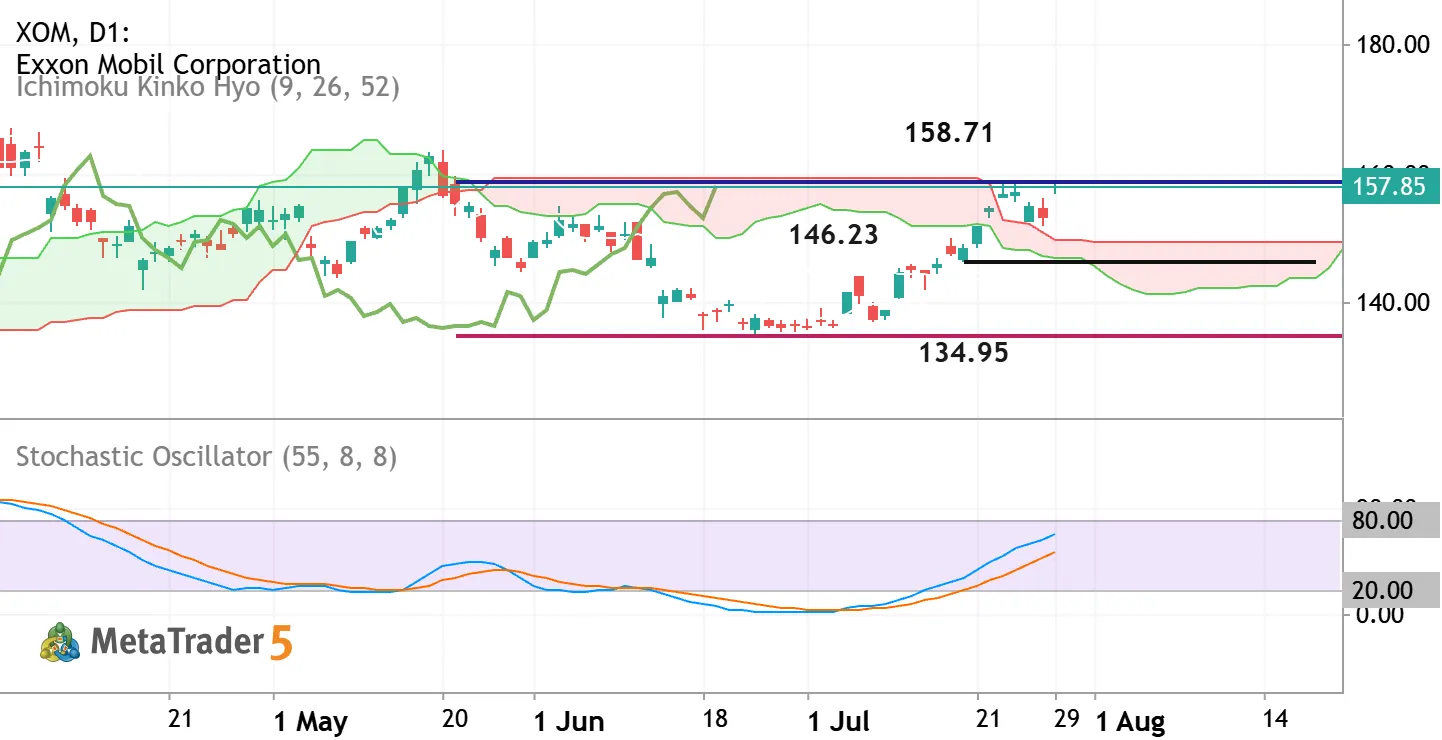
The daily price is located near and above Ichimoku cloud in the bullish area of the chart: Chinkou Span line of Ichimoku indicator already broke the historical price to above for the good breakout to be started, and the price crosses the Ichimoku cloud to above as well for the daily primary bullush reversal.
- If the price breaks resistance level at 158.71 so the strong bullish trend may be continuing.
- If the price crosses support level at 146.23 to 134.95 as the nearest possible target so primary bearish trend will be resumed.
- Alternatively, the price will be on secondary ranging to be near and inside Ichimoku cloud and within s/r channel waiting for direction of the strong trend to be started.
Trading Summary: breakout with the possible daily bullish reversal

 MQL5 个人资料
新评论
Hi, friend. Sorry to message you out of the blue. I just wanted to share something that has genuinely been a positive experience for me. I've been using an EA that has helped me trade more consistently, and I've been happy with the results. If you're interested, I'd be glad to share more details with you. No pressure—just let me know.