


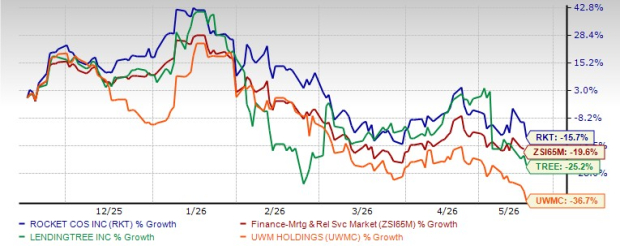
Rocket Companies RKT has outperformed its industry over the past six months, but the ride has been anything but smooth. From here, the setup is less about broad optimism and more about execution. Investors are watching whether Rocket can manage integration work (Mr. Cooper and Redfin), manage costs, and convert rate-driven demand into profitable volume in a choppy mortgage market.
In the same time frame, RKT’s peers have fared worse. Shares of LendingTree, Inc. TREE and UWM Holdings Corporation UWMC are down 25.2% and 36.7%, respectively, over the past six months.
6-Month Price Performance
Image Source: Zacks Investment Research
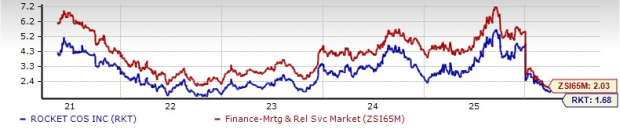
RKT Valuation: What 1.68x Book Implies
RKT trades at 1.68x trailing 12-month book value, below the Zacks sub-industry multiple of 2.03x. This shows Rocket is optically cheaper on this lens.
The valuation also sits closer to the low end of its own history. Over the past five years, the stock has ranged from 1.39x to 5.68x book, with a five-year median of 2.80x. The price target of $15.75 is tied to 1.92x trailing book, implying modest multiple expansion versus today’s level rather than a return to prior-cycle peaks.
P/B TTM
Image Source: Zacks Investment Research
Rocket’s Current Setup
Rocket is coming off a quarter that reflected the Mr. Cooper and Redfin acquisitions, with a strategy built around a broader ecosystem and a large servicing base. The company is leaning on recapturing recurring fee income and lowering customer acquisition costs to make its revenue mix more durable across cycles.
Moreover, artificial intelligence (AI)-enabled prospecting and digital pre-approvals tools will lift conversion and expand origination capacity without matching fixed-cost growth. That framework raises the stakes on execution because integrations must proceed without disruption or cost leakage while rate volatility keeps demand uneven.
Rocket’s Earnings Momentum and Near-Term Guidance
Rocket’s first-quarter 2026 adjusted earnings were 15 cents per share, topping the Zacks Consensus Estimate of 13 cents. Adjusted revenues were $2.82 billion, above the $2.7 billion consensus, supported by origination momentum and strength across multiple revenue lines.
Profitability also returned on a generally accepted accounting principles basis. Net income was $297 million versus a $212 million loss a year earlier, and adjusted EBITDA was $738 million, up from $169 million.
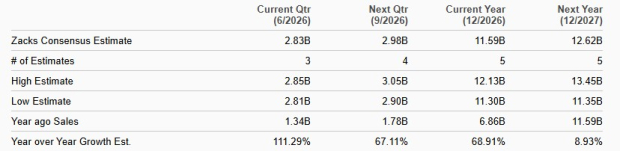
For the second quarter of 2026, adjusted revenues are expected to be in the range of $2.7-$2.9 billion, with the spring season developing unevenly. That unevenness matters because Rocket’s results hinge on whether rate moves translate into consistent closes rather than sporadic bursts of activity.
Sales Estimates
Image Source: Zacks Investment Research
RKT Cost Path: Expenses and Interest Burden Front and Center
Cost discipline is pivotal because Rocket carries a heavier expense and interest burden while it absorbs integration work. Total expenses were $2.54 billion in the first quarter of 2026, up from $1.32 billion a year earlier, with increases across compensation, marketing, general and administrative costs, and interest expense.
The longer-term trend reinforces the concern. From 2019 through 2025, total expenses grew at an 8.8% compound annual growth rate, and that trajectory continued into the first quarter of 2026. Without a stronger rate-driven volume tailwind, elevated costs can delay meaningful operating leverage.
Management expects sequential improvement in the second quarter at the midpoint of its revenue outlook, driven by synergy realization and ongoing benefits from artificial intelligence initiatives. It anticipates expenses of about $2.43 billion, including $110 million of intangible amortization, $100 million of stock-based compensation, and $20 million of one-time acquisition costs. Excluding those items, adjusted expenses are expected to be about $2.2 billion, roughly $60 million below the first-quarter level.
Rocket’s Synergy Targets and What to Watch Quarterly
Rocket’s integration plan is increasingly framed in measurable synergy checkpoints. The company expects $400 million of Mr. Cooper expense synergies to be realized by the end of 2026, a year earlier than previously targeted, and it reported $75 million in annualized run-rate savings achieved through the end of the first quarter.
The synergy story also includes revenue expectations. Management anticipated an incremental $100 million of revenues tied to higher blended recapture rates, while total cost synergies across the Redfin and Mr. Cooper deals are targeted at $540 million.
The quarterly scorecard is straightforward: track progress in annualized run-rate savings, look for sequential cost improvement consistent with guidance, and watch for signs that integration complexity is driving cost leakage or timing slippage.
RKT Demand Sensitivity: Rates, Inventory, and Margins
Rocket’s volume outlook remains highly sensitive to the housing and rate backdrop. Limited inventory, elevated home prices, and affordability pressure continue to suppress turnover and restrict purchase demand, while mortgage rate volatility keeps origination patterns uneven.
That environment can also force a trade-off between volume and pricing. In the first quarter of 2026, total closed mortgage loan origination volume was $44.7 billion and total gain-on-sale margin was 2.74%.
There are also signs of stronger economics in parts of the book. Excluding correspondent activity, closed loan volume was $37.8 billion and gain-on-sale margin improved to 3.22%, which management tied to rising capacity and conversion benefits from AI-driven origination tools. Still, the key question is whether those efficiency gains can offset competitive pricing and macro-driven swings.
Rocket’s Zacks Signals for Positioning, Not Prediction
At present, RKT carries a Zacks Rank #3 (Hold). Its Style Scores are VGM F, Value F, Growth C, and Momentum F, which suggests the setup may appeal more to investors focused on execution-driven upside than those screening for strong style factor support today. You can see the complete list of today’s Zacks #1 Rank (Strong Buy) stocks here.
On the other hand, LendingTree sports a Zacks Rank #1, while UWM Holdings has a Zacks Rank #4 (Sell).
Rocket’s earnings estimate trends add a near-term overhang. The company’s 2026 and 2027 earnings estimates have been revised lower over the past 30 days, a reminder that sentiment can turn quickly when costs and integration are under scrutiny.
Earnings Estimates Trend
Image Source: Zacks Investment Research

Research Chief Names "Single Best Pick to Double"
From thousands of stocks, 5 Zacks experts each have chosen their favorite to skyrocket +100% or more in months to come. From those 5, Director of Research Sheraz Mian hand-picks one to have the most explosive upside of all.
This company targets millennial and Gen Z audiences, generating nearly $1 billion in revenue last quarter alone. A recent pullback makes now an ideal time to jump aboard. Of course, all our elite picks aren’t winners but this one could far surpass earlier Zacks’ Stocks Set to Double like Nano-X Imaging which shot up +129.6% in little more than 9 months.
Free: See Our Top Stock And 4 Runners UpWant the latest recommendations from Zacks Investment Research? Today, you can download 7 Best Stocks for the Next 30 Days. Click to get this free report
Rocket Companies, Inc. (RKT): Free Stock Analysis Report
LendingTree, Inc. (TREE): Free Stock Analysis Report
UWM Holdings Corporation (UWMC): Free Stock Analysis Report
This article originally published on Zacks Investment Research (zacks.com).