
Dave Inc. DAVE witnessed sequential growth in revenues over the past five quarters, backed by a new pricing model, the widening of average revenues per user (ARPU), and the growing number of ExtraCash originations. Notably, the company registered a 63% year-over-year and a 15% sequential surge in its top line in the third quarter of 2025.
Dave’s operational efficiency stood out during the quarter, as evidenced by a whopping 193% year-over-year increase in adjusted net income and a 137% upsurge in adjusted EBITDA. Despite 16.6% year-over-year growth in total operating expenses, its percentage of the top line fell sharply by 2,800 basis points (bps). While this lofty performance is impressive, we must also question whether this level of profitability is sustainable for the company.
We have identified three sustainability drivers. Firstly, the combination of modified underwriting and acquisition strategies, and prudent fixed cost control resulted in 85% flow-through to adjusted EBITDA. Impressions were witnessed in the company’s adjusted EBITDA margin that expanded 1,200 bps, which positioned Dave to scale effectively and drive profitable growth in the long run.
Secondly, CashAI v5.5’s underwriting precision not only enhances approval rates, driving ARPU, but also lowers manual labor costs. Finally, consistent customer acquisition costs of $19 and a gross profit payback period under four months support customer base expansion at low costs. These market forces, coupled with Dave’s pivot to a funding model with low cost of capital in 2026, position it to maintain strong margins and remain profitable in the long run.
DAVE’s Price Performance, Valuation & Estimates
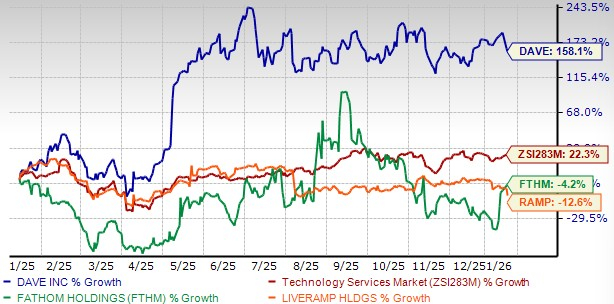
The stock has skyrocketed 158.1% in the past year, significantly outperforming its peers, LiveRamp RAMP and Fathom FTHM, and the industry as a whole. The industry has gained 22.3%. LiveRamp and Fathom have plummeted 4.2% and 12.6%, respectively.
1-Year Share Price Performance
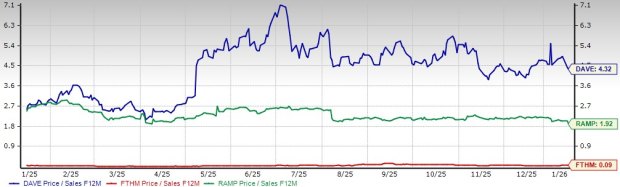
From a valuation standpoint, DAVE trades at a 12-month forward price-to-sales ratio of 4.32, higher than LiveRamp’s 1.92 and Fathom’s 0.09.
Price/Sales - F12M
DAVE carries a Value Score of C, while Fathom and LiveRamp carry D and B.
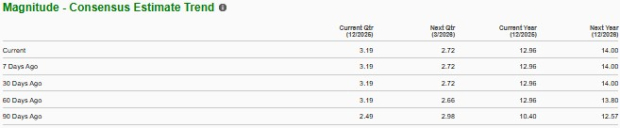
The Zacks Consensus Estimate for DAVE’s earnings for 2025 and 2026 is pinned at $12.96 and $14 per share, respectively, unchanged over the past 30 days.
DAVE currently flaunts a Zacks Rank #1 (Strong Buy). You can see the complete list of today’s Zacks #1 Rank stocks here.
Just Released: Zacks Top 10 Stocks for 2026
Hurry – you can still get in early on our 10 top tickers for 2026. Handpicked by Zacks Director of Research Sheraz Mian, this portfolio has been stunningly and consistently successful.
From inception in 2012 through November, 2025, the Zacks Top 10 Stocks gained +2,530.8%, more than QUADRUPLING the S&P 500’s +570.3%.
Sheraz has combed through 4,400 companies covered by the Zacks Rank and handpicked the best 10 to buy and hold in 2026. You can still be among the first to see these just-released stocks with enormous potential.
See New Top 10 Stocks >>Want the latest recommendations from Zacks Investment Research? Today, you can download 7 Best Stocks for the Next 30 Days. Click to get this free report
Dave Inc. (DAVE): Free Stock Analysis Report
LiveRamp Holdings, Inc. (RAMP): Free Stock Analysis Report
Fathom Holdings Inc. (FTHM): Free Stock Analysis Report
This article originally published on Zacks Investment Research (zacks.com).