


It’s not difficult to cast doubt on AST SpaceMobile (ASTS). While you can wax poetic about the projected multi-trillion-dollar total addressable market of the space economy, AST has suffered significant challenges on the way. Further, the initial public offering of SpaceX (SPCX) imposes obvious competition. Nevertheless, for those seeking a high-risk, high-reward opportunity, ASTS stock could make an attractive case over the coming weeks.
Before we begin, prospective traders must recognize the bullish idea as highly speculative. For one thing, the Barchart Technical Opinion indicator warns that ASTS stock suffers from a 72% Strong Sell rating, noting that short-term outlook is fraught with downside risk. And while we’re on the topic of the technicals, the ticker is down roughly 23% on a year-to-date basis and has tumbled by more than 46% in the past six months.
Can’t Get Enough Options?: Join the list for Barchart’s daily unusual options report, delivered free.
Fundamentally, launch partner setbacks and timeline delays have hurt the investment thesis for ASTS stock. In addition, financial headwinds — such as dilution fears from a surprise capital raise and a first-quarter earnings miss and high cash burn — have clouded sentiment. When you combine these elements with the SpaceX rivalry, the volatility becomes easier to understand.
Still, the smart money seems to be contradicting this bearishness toward ASTS stock, which adds intrigue to the contrarian position.
Volatility Skew for ASTS Stock Points in an Optimistic Direction
If you take a look at the volatility skew for the options chain expiring Sep. 18, the distinct imagery can’t be avoided. Even if you didn’t know anything about this indicator, you can see that the call (right-side) tail is vastly more expansive than the put tail. Essentially, this distortion in the volatility surface reflects a high-upside narrative that the bulls appear to be betting on.
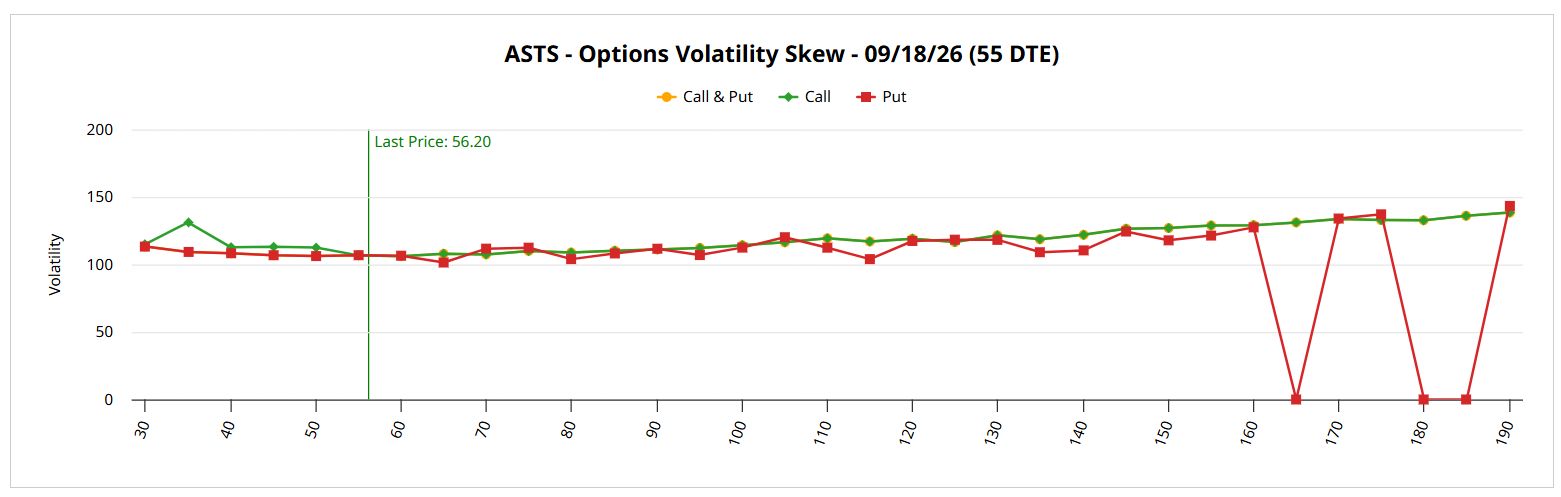
Moreover, the reading for implied volatility — the expected movement of the underlying security — is higher for out-the-money (OTM) calls than it is for OTM puts. In other words, as smart money traders make their transactions, the heightened demand profile elevates IV. To me, it’s significant that, despite ASTS stock suffering a beatdown, the heavier weight toward calls suggests that a recovery may be in the works.
To use options parlance, traders appear to be prioritizing upside convexity over downside protection; that is, they see a greater risk in not having leverage should ASTS stock spike northward rather than the prospect of the ticker tumbling even further.
We need to be careful here and stress that traders effectively buying upside insurance doesn’t necessarily mean that ASTS stock will move higher. But there’s another wrinkle to consider — and that’s the quantitative mechanics of the market.
Future Market Returns are Dependent Variables
One mathematical point that basically serves as a hidden premise in practically every article by the financial publication ecosystem is this: future market returns are dependent variables.
What do I mean by that? Simply, the future state of the market depends on its current state. For example, as I stated earlier, ASTS stock is down more than 46% in the past six months. As such, when traders decide on what to do with ASTS, they’re almost certainly going to take that volatility into account.
My hunch is that both human traders and rules-based algorithms are viewing the satellite designer and manufacturer as a discounted opportunity. Indeed, when you look at the structure of the volatility skew, you can visually sense the optimistic speculation.
What’s more, we can measure the implied forward trajectory of ASTS stock under the current bearish state through an inductive analysis. Specifically, in the past 10 weeks, ASTS has printed only three up weeks, thus leading to a downward slope. This 3-7-D quantitative sequence has materialized 44 times since its public market debut and has frequently led to an above-average performance.
Following the flashing of the signal, traders can historically expect a 10-week forward distribution landing between $50 and $73 (assuming a starting price of $56.20), with probability density peaking at around $57.50. Under a random 10-week hold, ASTS stock would only be expected to range between $55.40 and $56.50, with peak probability density reaching $56.08 (thus suffering a negative bias).
From the data, the implication is that usually, a short-term hold on ASTS stock is a losing proposition. However, if you are going to buy, it has statistically been better to do so following an extended downturn.
ASTS Call Options Could be Favorably Mispriced
As an options trader, what makes ASTS stock so enticing is that in week 8 following the flashing of the 3-7-D signal, the ticker’s median endpoint price is the equivalent of approximately $66. If a similar trend were to materialize over the next eight weeks, then the 60/65 bull call spread expiring Sep. 18 would make a lot of sense.
For this trade to be fully profitable, ASTS stock will need to rise through the second-leg strike ($65) at expiration. If so, the maximum payout would be over 163%. However, because Wall Street assigns a modest probability of profit of 40.8% — or the likelihood that ASTS will rise above the breakeven price of $61.90 — the opportunity is viewed as highly speculative.
Still, what should be noted is that this probability is derived from a Black-Scholes framework, which functionally assumes that market returns are independent of all currently observable variables. In other words, it doesn’t matter to the Black-Scholes model that ASTS stock suffered a six-month loss of over 46%. It’s going to calculate a probability based on the current IV and the strict parameters of the formula.
Of course, I and practically every other financial writer dispute this. Instead, we are working with the presupposition that the future value of ASTS stock — whatever it may be — actually depends on that severe six-month loss.
Interestingly, the data shows that of the 44 times that ASTS flashed the 3-7-D signal, the ticker exceeded the equivalent of the $61.90 breakeven price a total of 25 times at the end of week 8 (Sep. 18). If so, the observed, conditional probability of profit could actually be 56.8%, which is a massive improvement over 40.8%.
Essentially, if we assume the validity of the above model, bullish traders would be underpaying for the risk that ASTS stock historically absorbs under similar quantitative circumstances. That’s why I believe this satellite company is compellingly mispriced.
On the date of publication, Josh Enomoto did not have (either directly or indirectly) positions in any of the securities mentioned in this article. All information and data in this article is solely for informational purposes. For more information please view the Barchart Disclosure Policy here.
More news from Barchart
Despite Challenges, AST SpaceMobile Stock Could Make a Compelling Options Trade for Contrarians Here ConocoPhillips Stock Has Attractive Short-Put Yields for One Month As Oil Price Rise Everyone Loves November Soybeans Right Now. History Doesn't! Option Volatility And Earnings Report For July 27-31