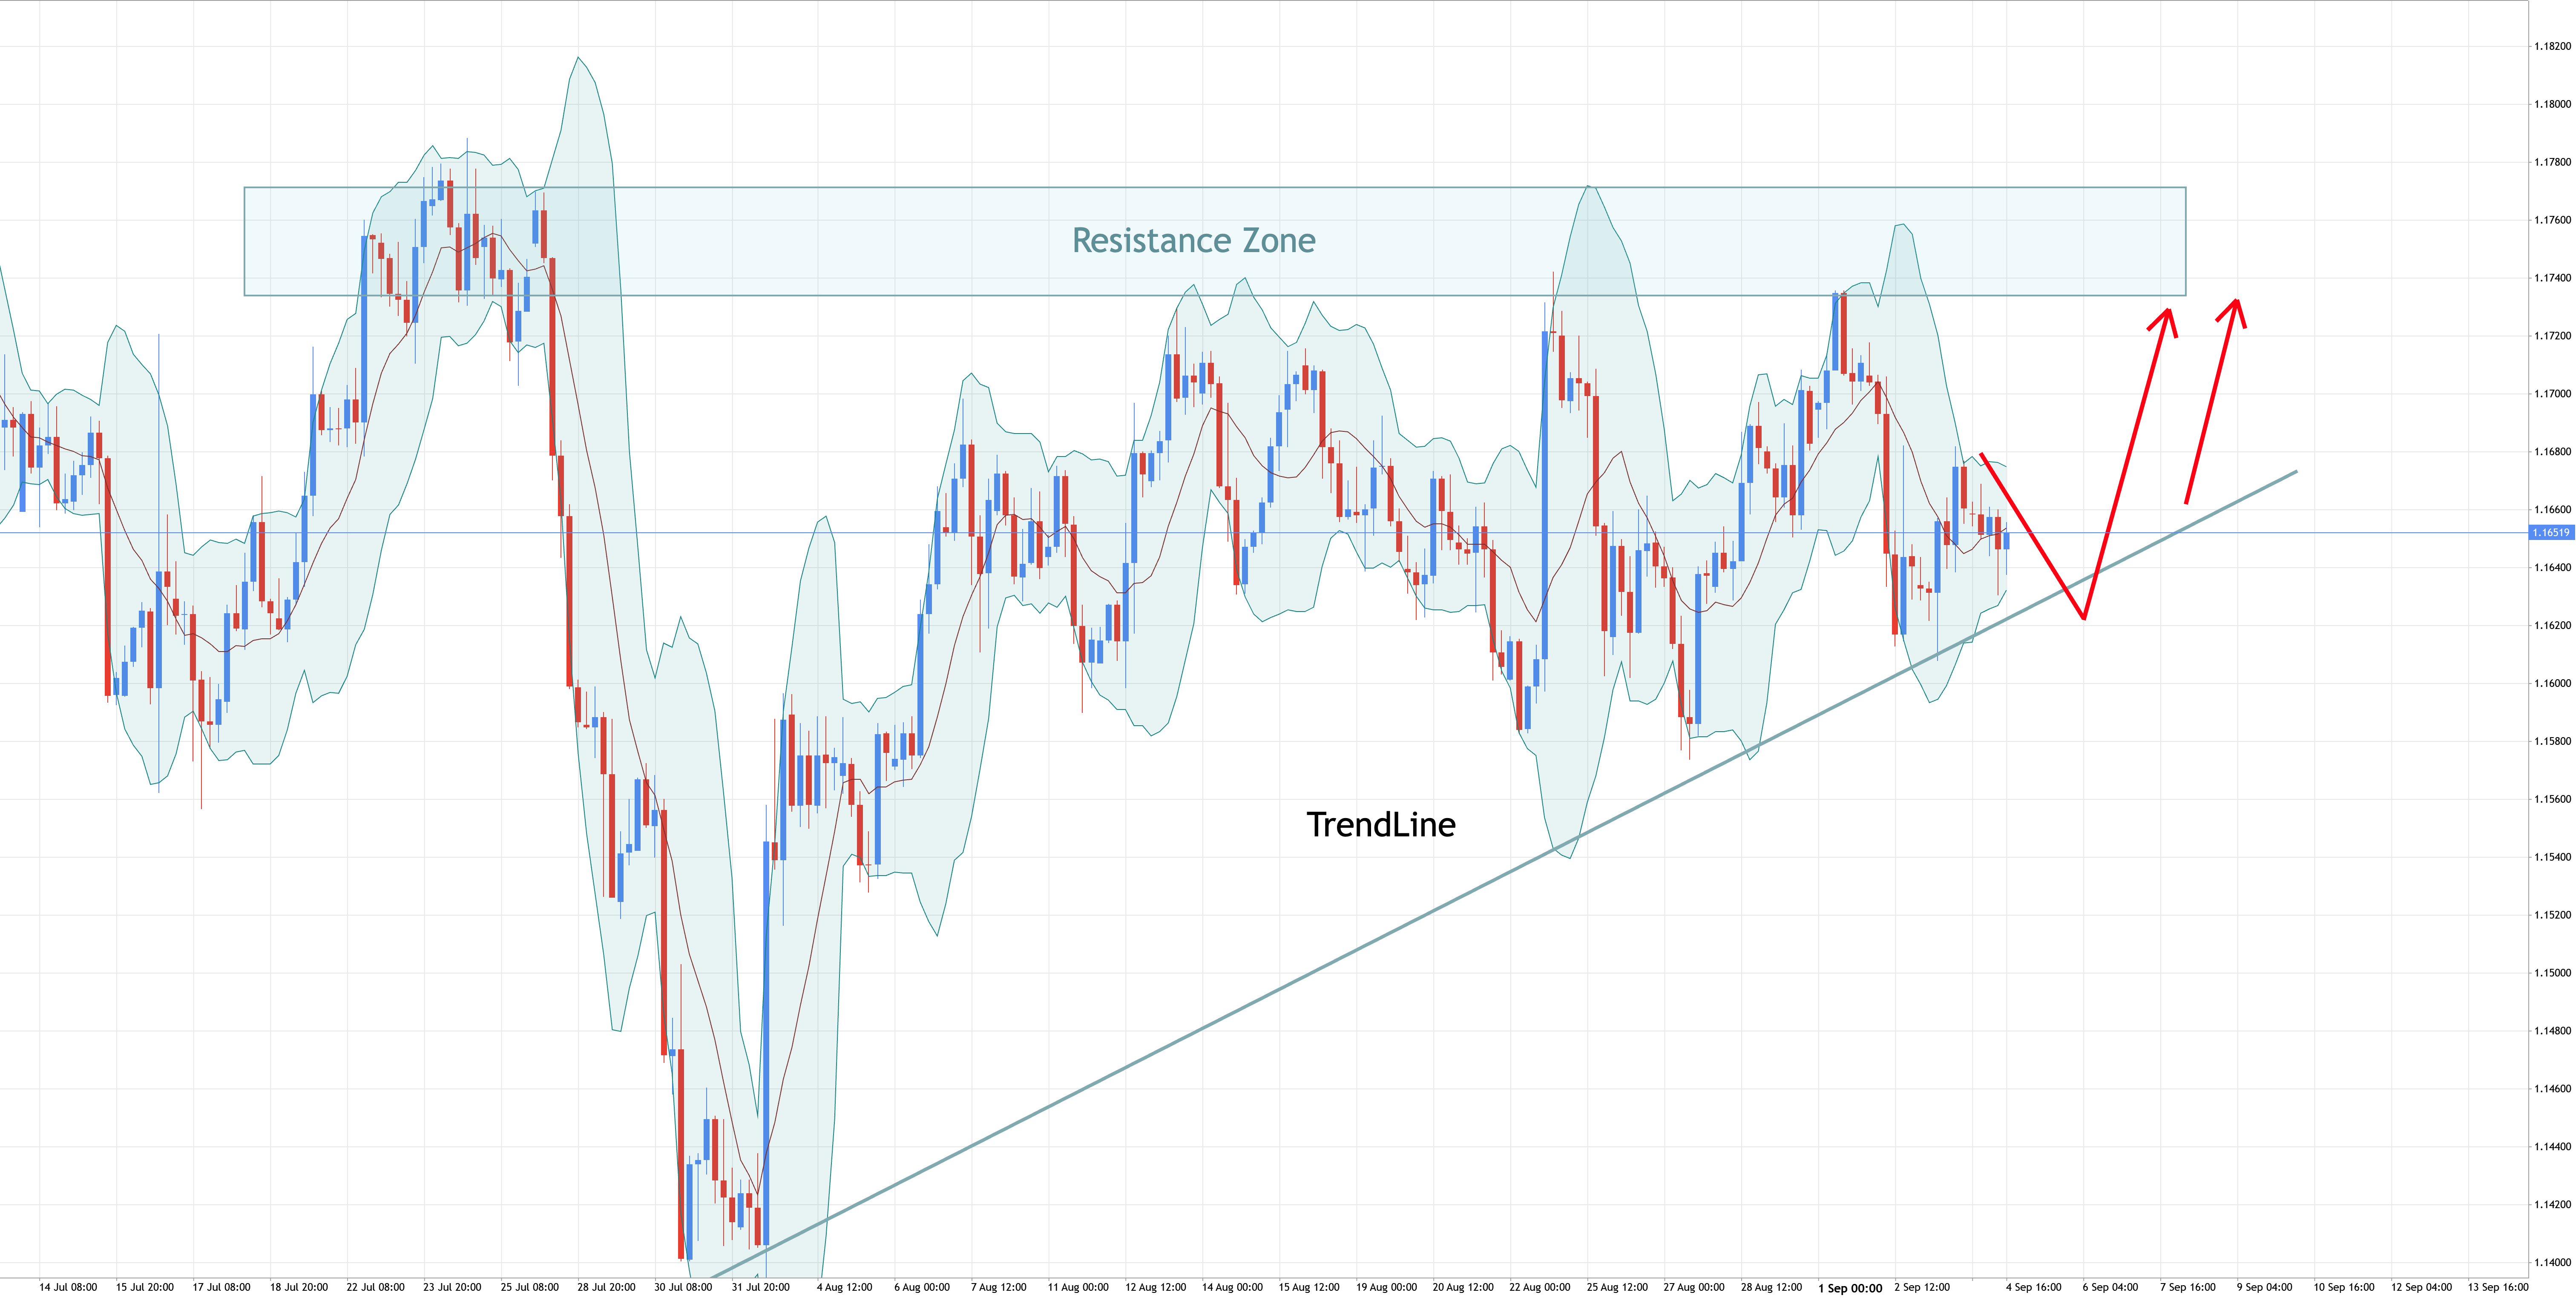
EURUSD EURUSD – Struggling in the Decision Zone 👋Hello everyone, what do you think about the EURUSD trend? Today, EURUSD continues to move within a narrow range, reflecting a sideways market after several sessions of consolidation. At the moment, price is still supported by the rising trendline and the 1.1620 – 1.1580 support zone. This remains a crucial foundation for buyers to maintain their advantage. On the upside, the resistance zone at 1.1730 – 1.1760 is still a strong barrier. If buying pressure is sufficient to break through, the bullish trend will be reinforced, opening the path to higher targets. With ongoing economic uncertainty in the US and expectations that the ECB will maintain its stable stance, EURUSD is facing the chance for a significant breakout. Where do you think this pair will head next? 2025.09.04 13:53 🔥 1 0
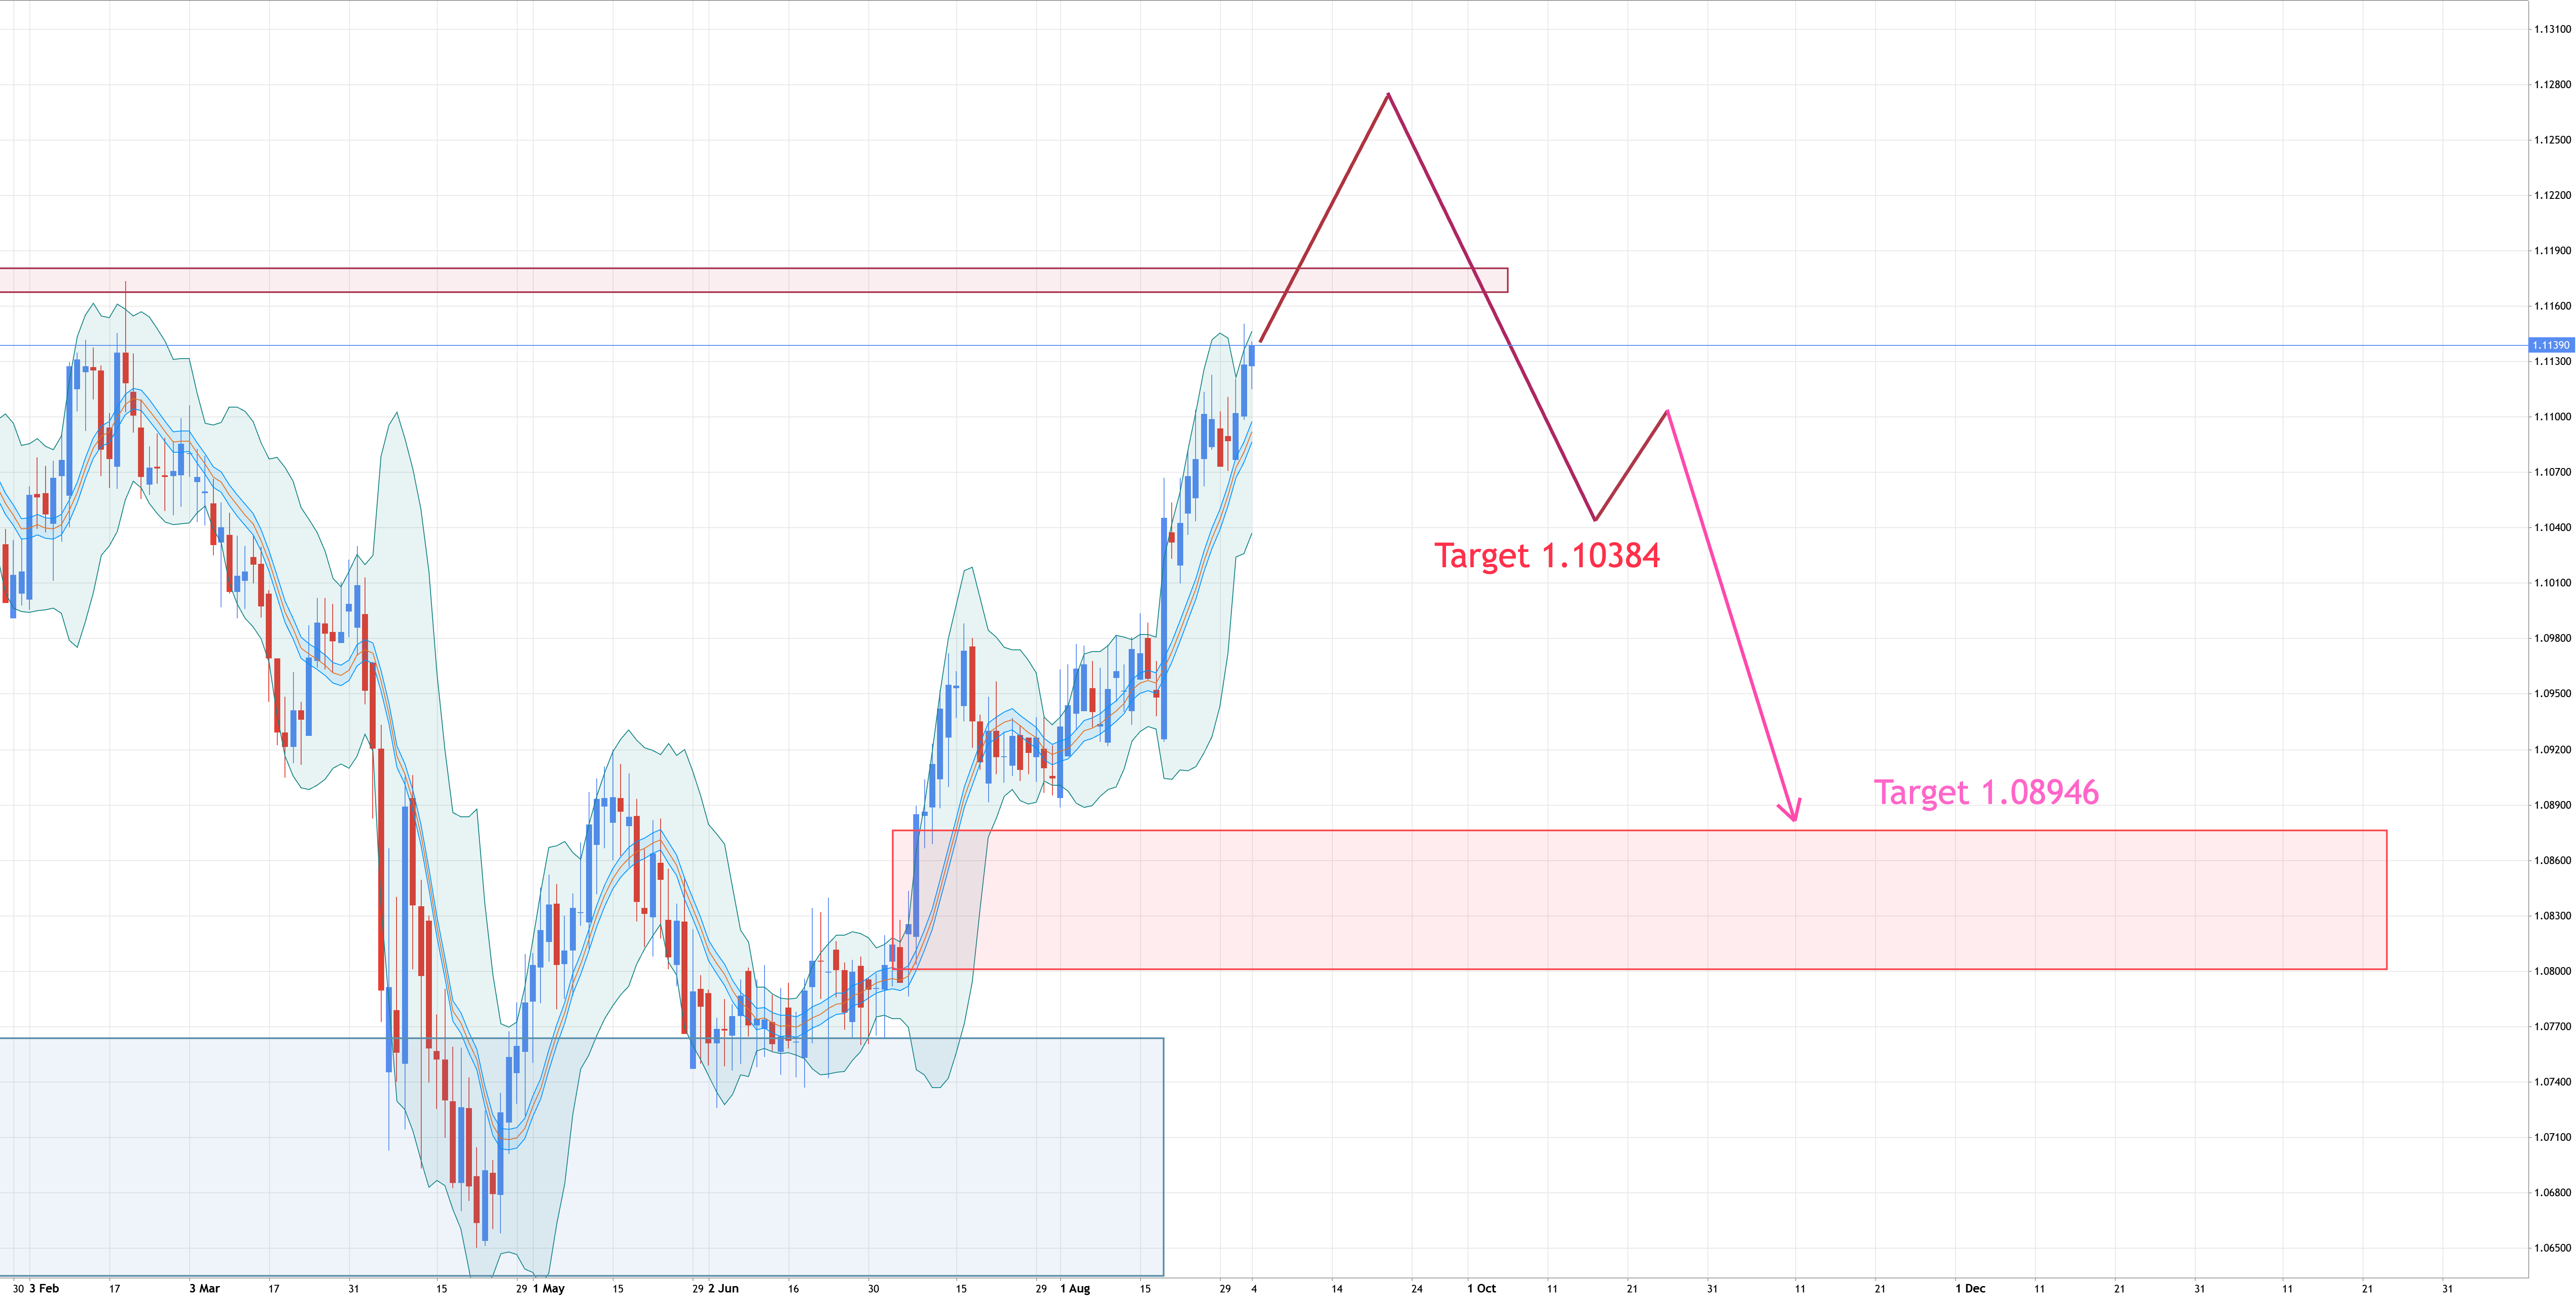
AUDNZD AUDNZD - false breakout will trigger trend reversal Consolidation 1.099 - 1.0913 and its distribution phase, which has practically reached the boundary of the 1.1156 range. There is no trend in the global market, and a false breakout and trend reversal can be expected with a high degree of probability. Focus on the 1.1156 zone. Huge liquidity pool above the level. Retest of resistance more than six months after the last test. Energy has run out. There is no potential for a breakout at all. Except for force majeure... The price may go beyond the level, but it would be premature to say that this is a breakout. A reaction is needed. I am waiting for a false breakout and the price closing below the specified resistance, which will form an entry point for me to sell. 1.103 and 1.091 can be considered as medium-term targets. 2025.09.04 13:47 🔥 0
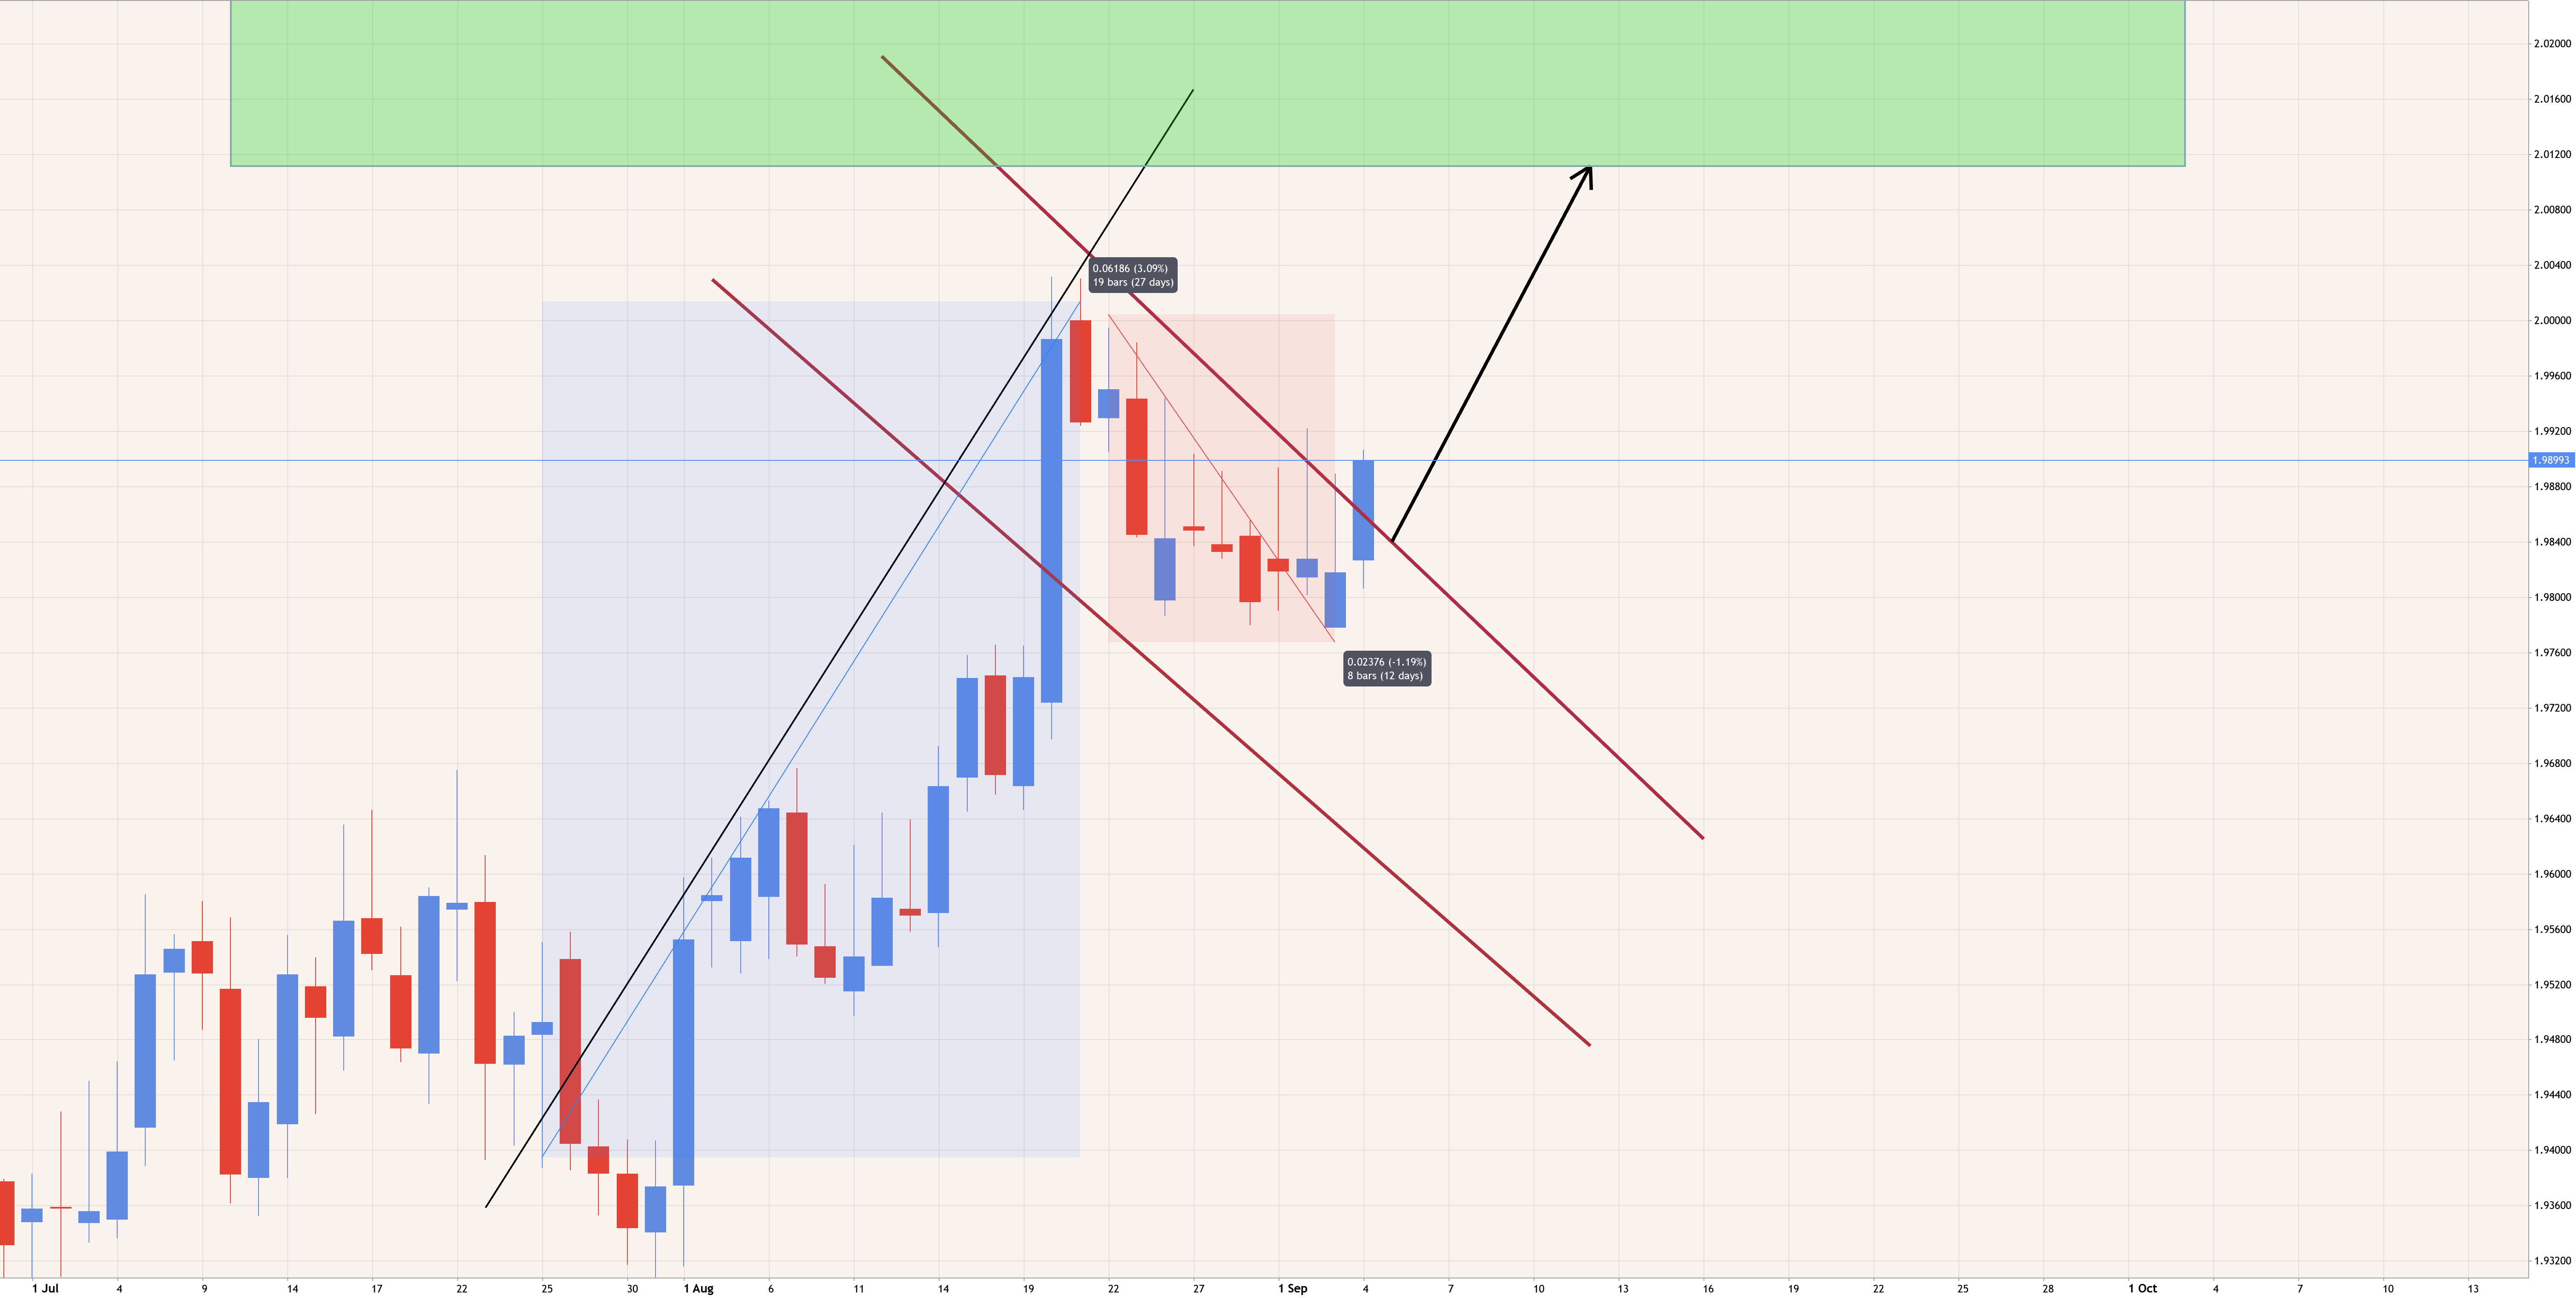
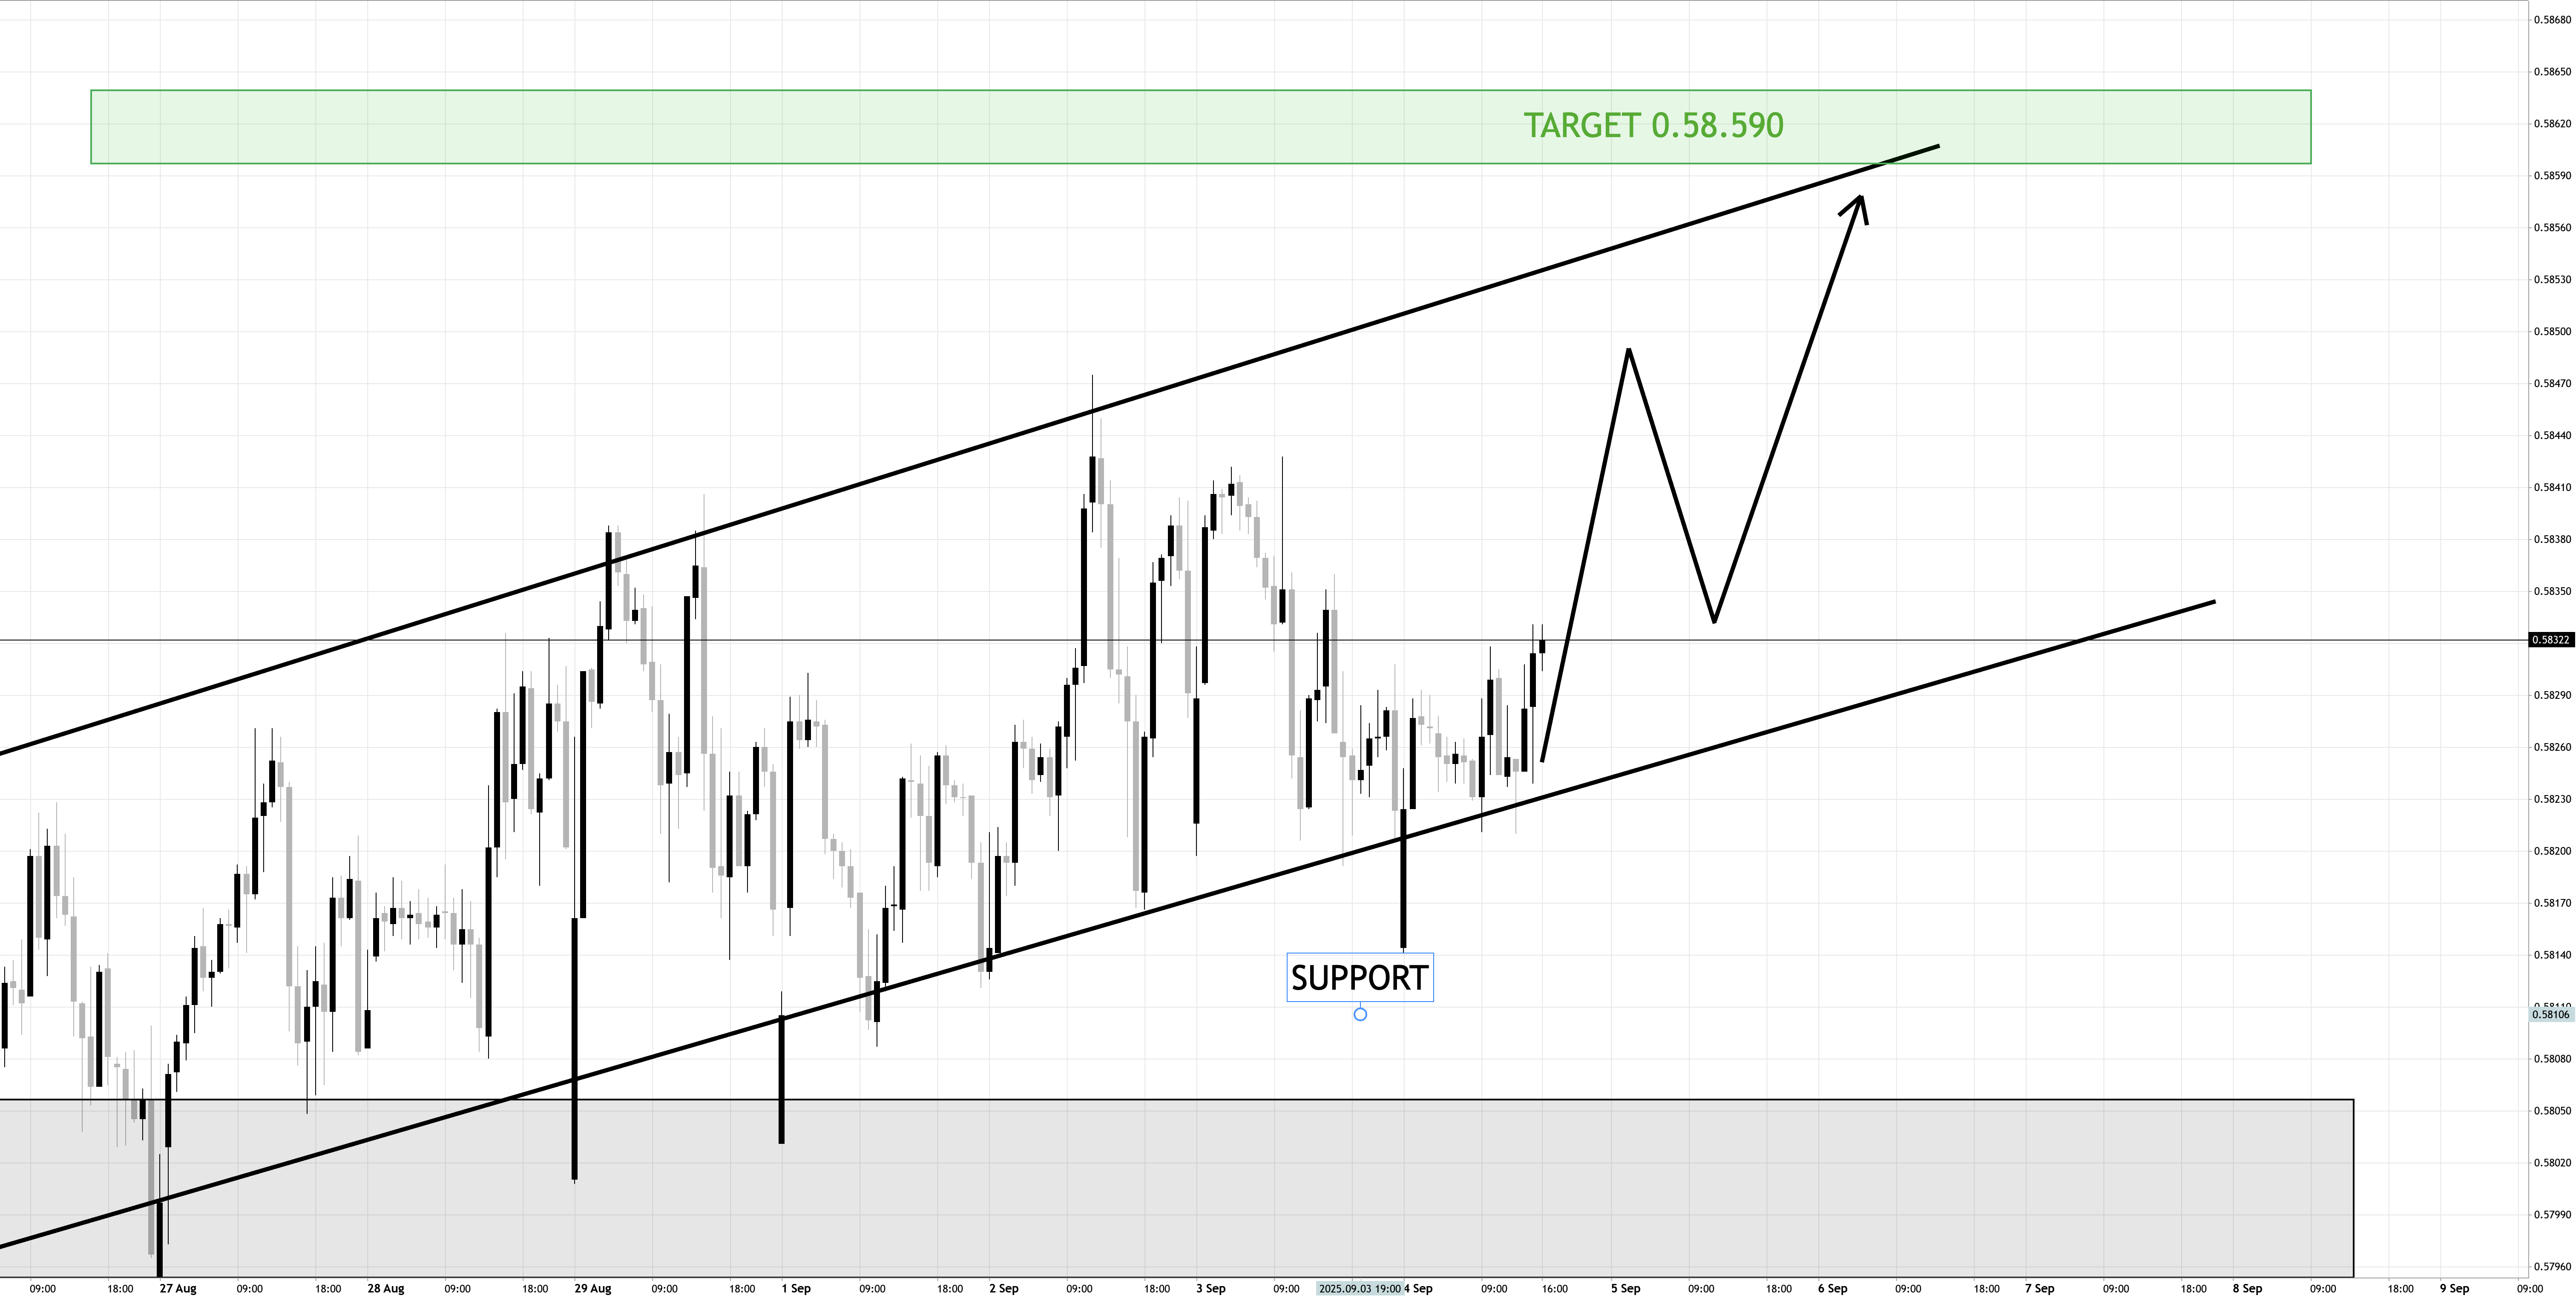
EURNZD EURNZD: Rose steadily and created a Bullish Flag EURNZD looks quite interesting at the moment. Price rose to the upside steadily and now seems to have created a well known pattern: a bullish flag. My expectation is for the price to continue, but first I would wait for a full strong candle to confirm the signal. I would target 2.00500. If, on the other hand, price will decline below the flag, that would invalidate the continuation, and we can expect a short-term pullback incoming. What do you think? 2025.09.04 13:31 🔥 0
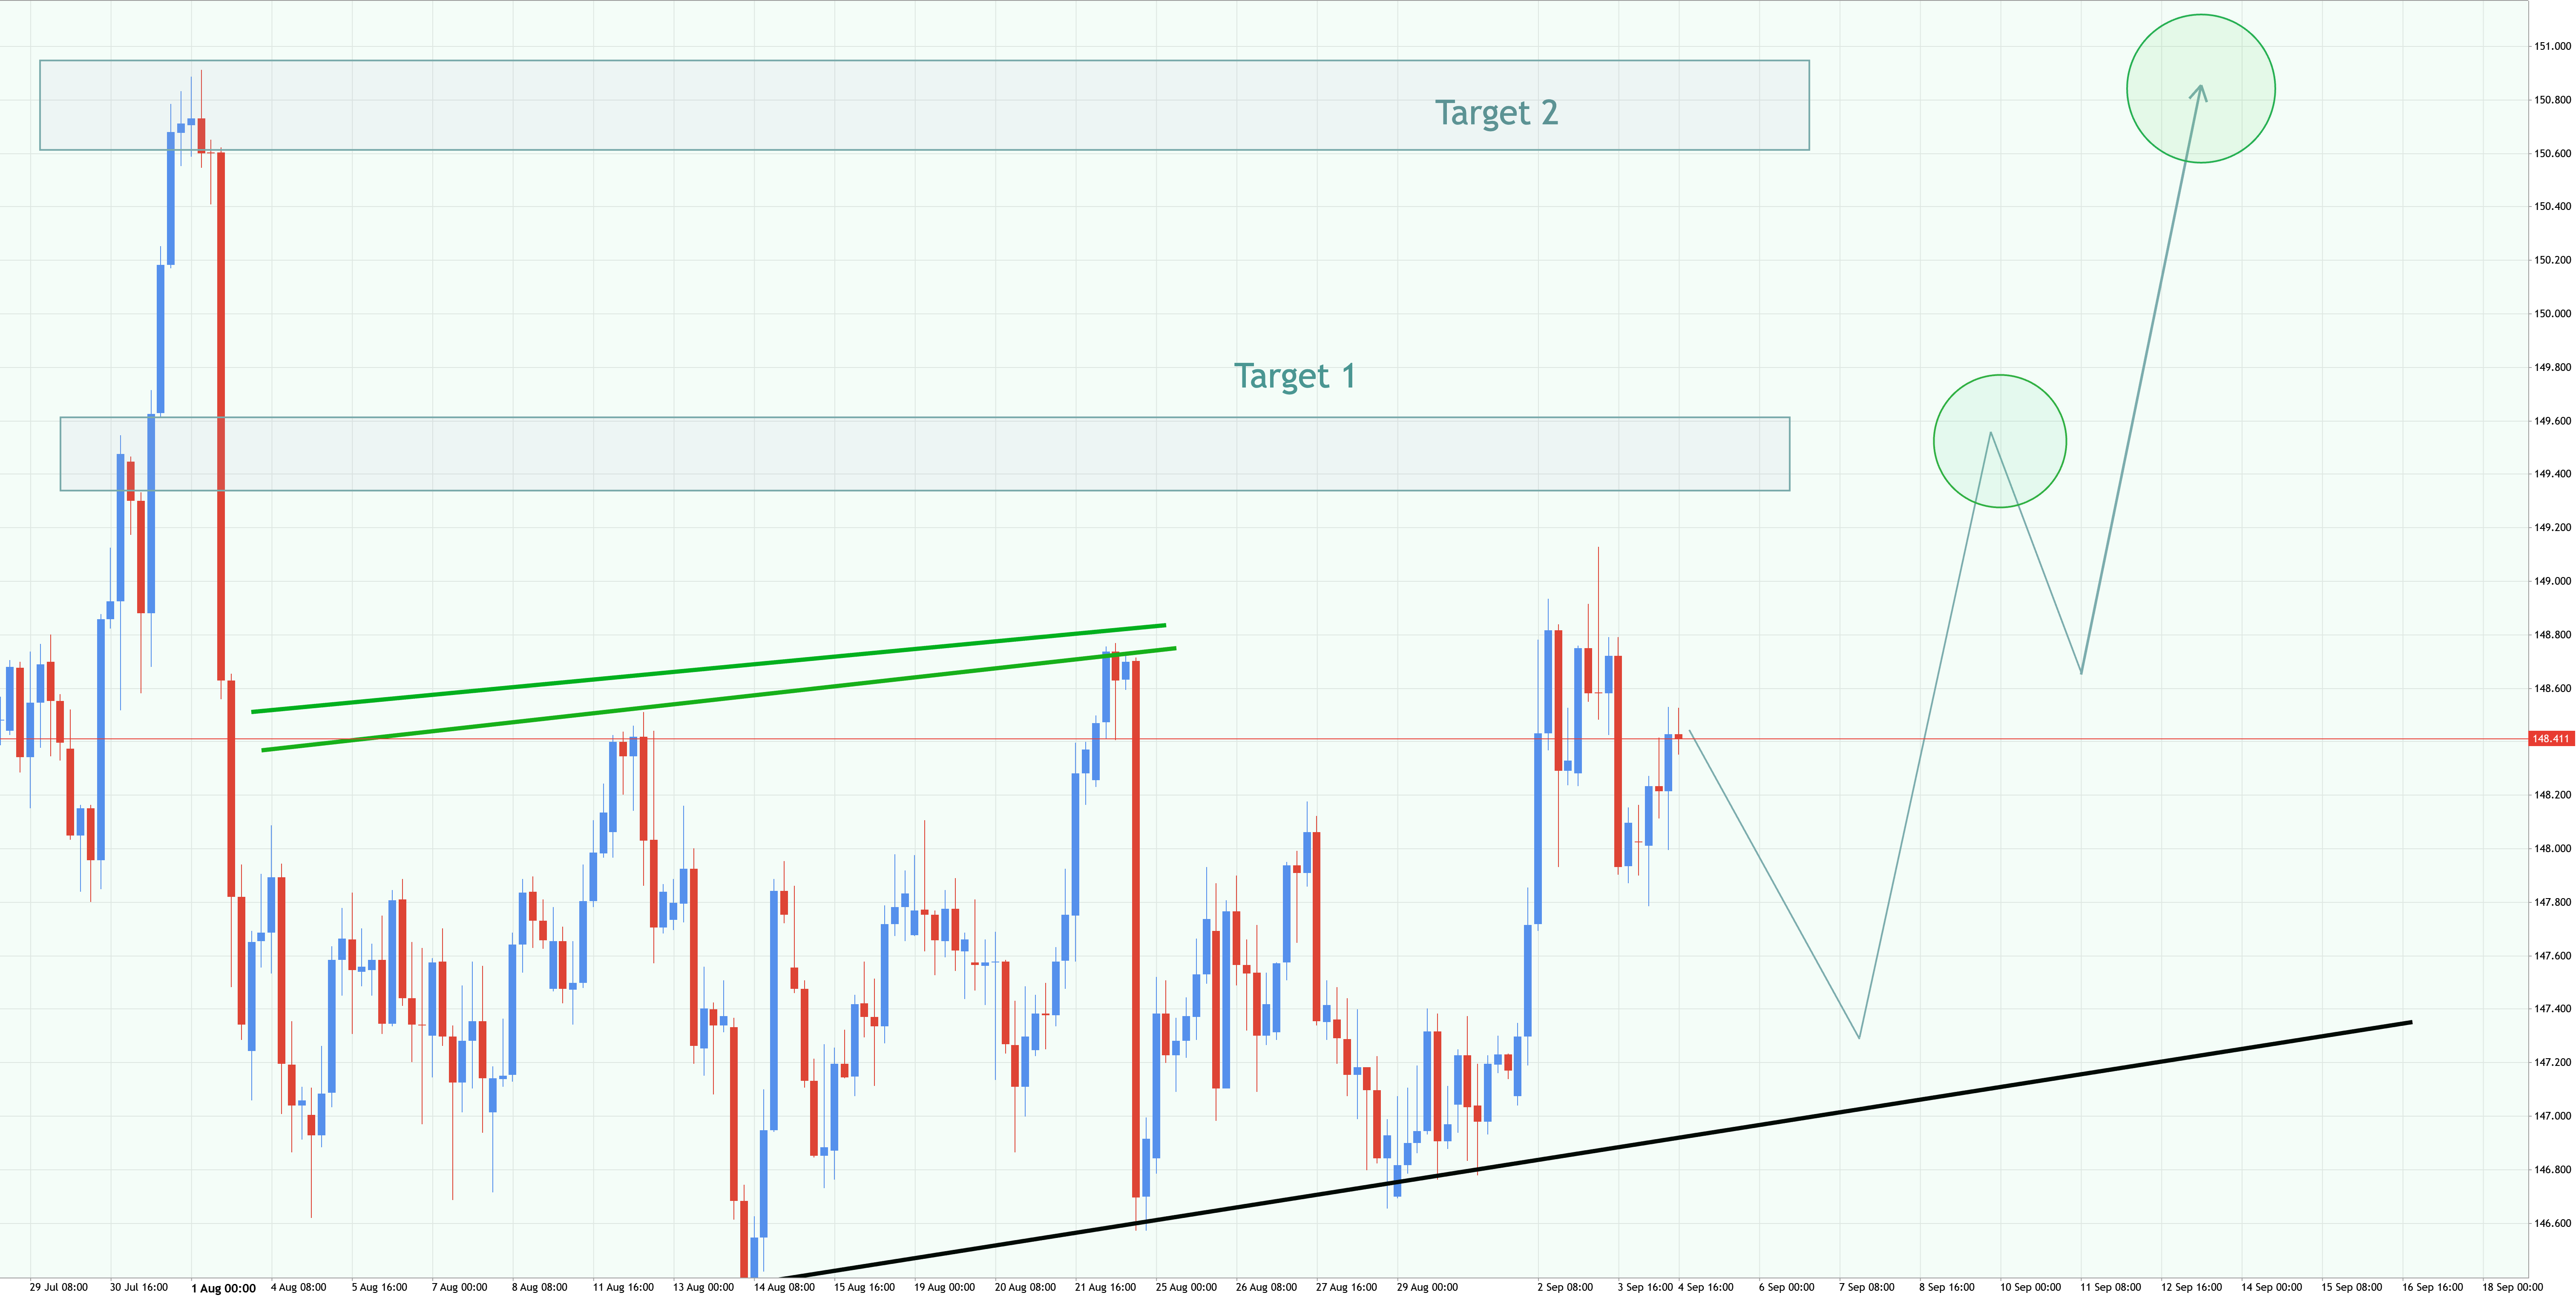
USDJPY USDJPY Holds Strong — Key Data Ahead 1 254 USDJPY Holds Strong — Key Data Ahead The U.S. dollar strengthened across many currency pairs yesterday, with USDJPY standing out as one of the top performers. A brief pullback could be followed by another upward move, especially if price action holds above the 148.00–148.50 support zone. Today’s JOLTS Job Openings data could give USDJPY a boost if the numbers beat expectations. July’s forecast is 7.4M vs 7.437M, but this release often surprises to the upside, so it’s more of a reference than a reliable signal. The main focus remains on Friday’s NFP report, which could be the real catalyst. If USDJPY stays above the current support zone, the odds of a bullish continuation increase. Key resistance levels to watch: 149.50 150.70 You may find more details in the chart! Thank you and Good Luck! 2025.09.04 13:24 🔥 1 0
XAUUSD GOLD (XAUUSD): Bullish Trend Continues GOLD is currently exhibiting a robust bullish trend, having recently reached a new higher high. Following this upward movement, the market entered a phase of consolidation within a narrow parallel channel on the hourly time frame. The recent violation of the resistance indicates a likely continuation of this upward trend. Given these technical indicators, I anticipate that GOLD will reach the significant psychological level of 3560, reflecting sustained bullish momentum in the market. 2025.09.04 13:15 🔥 0
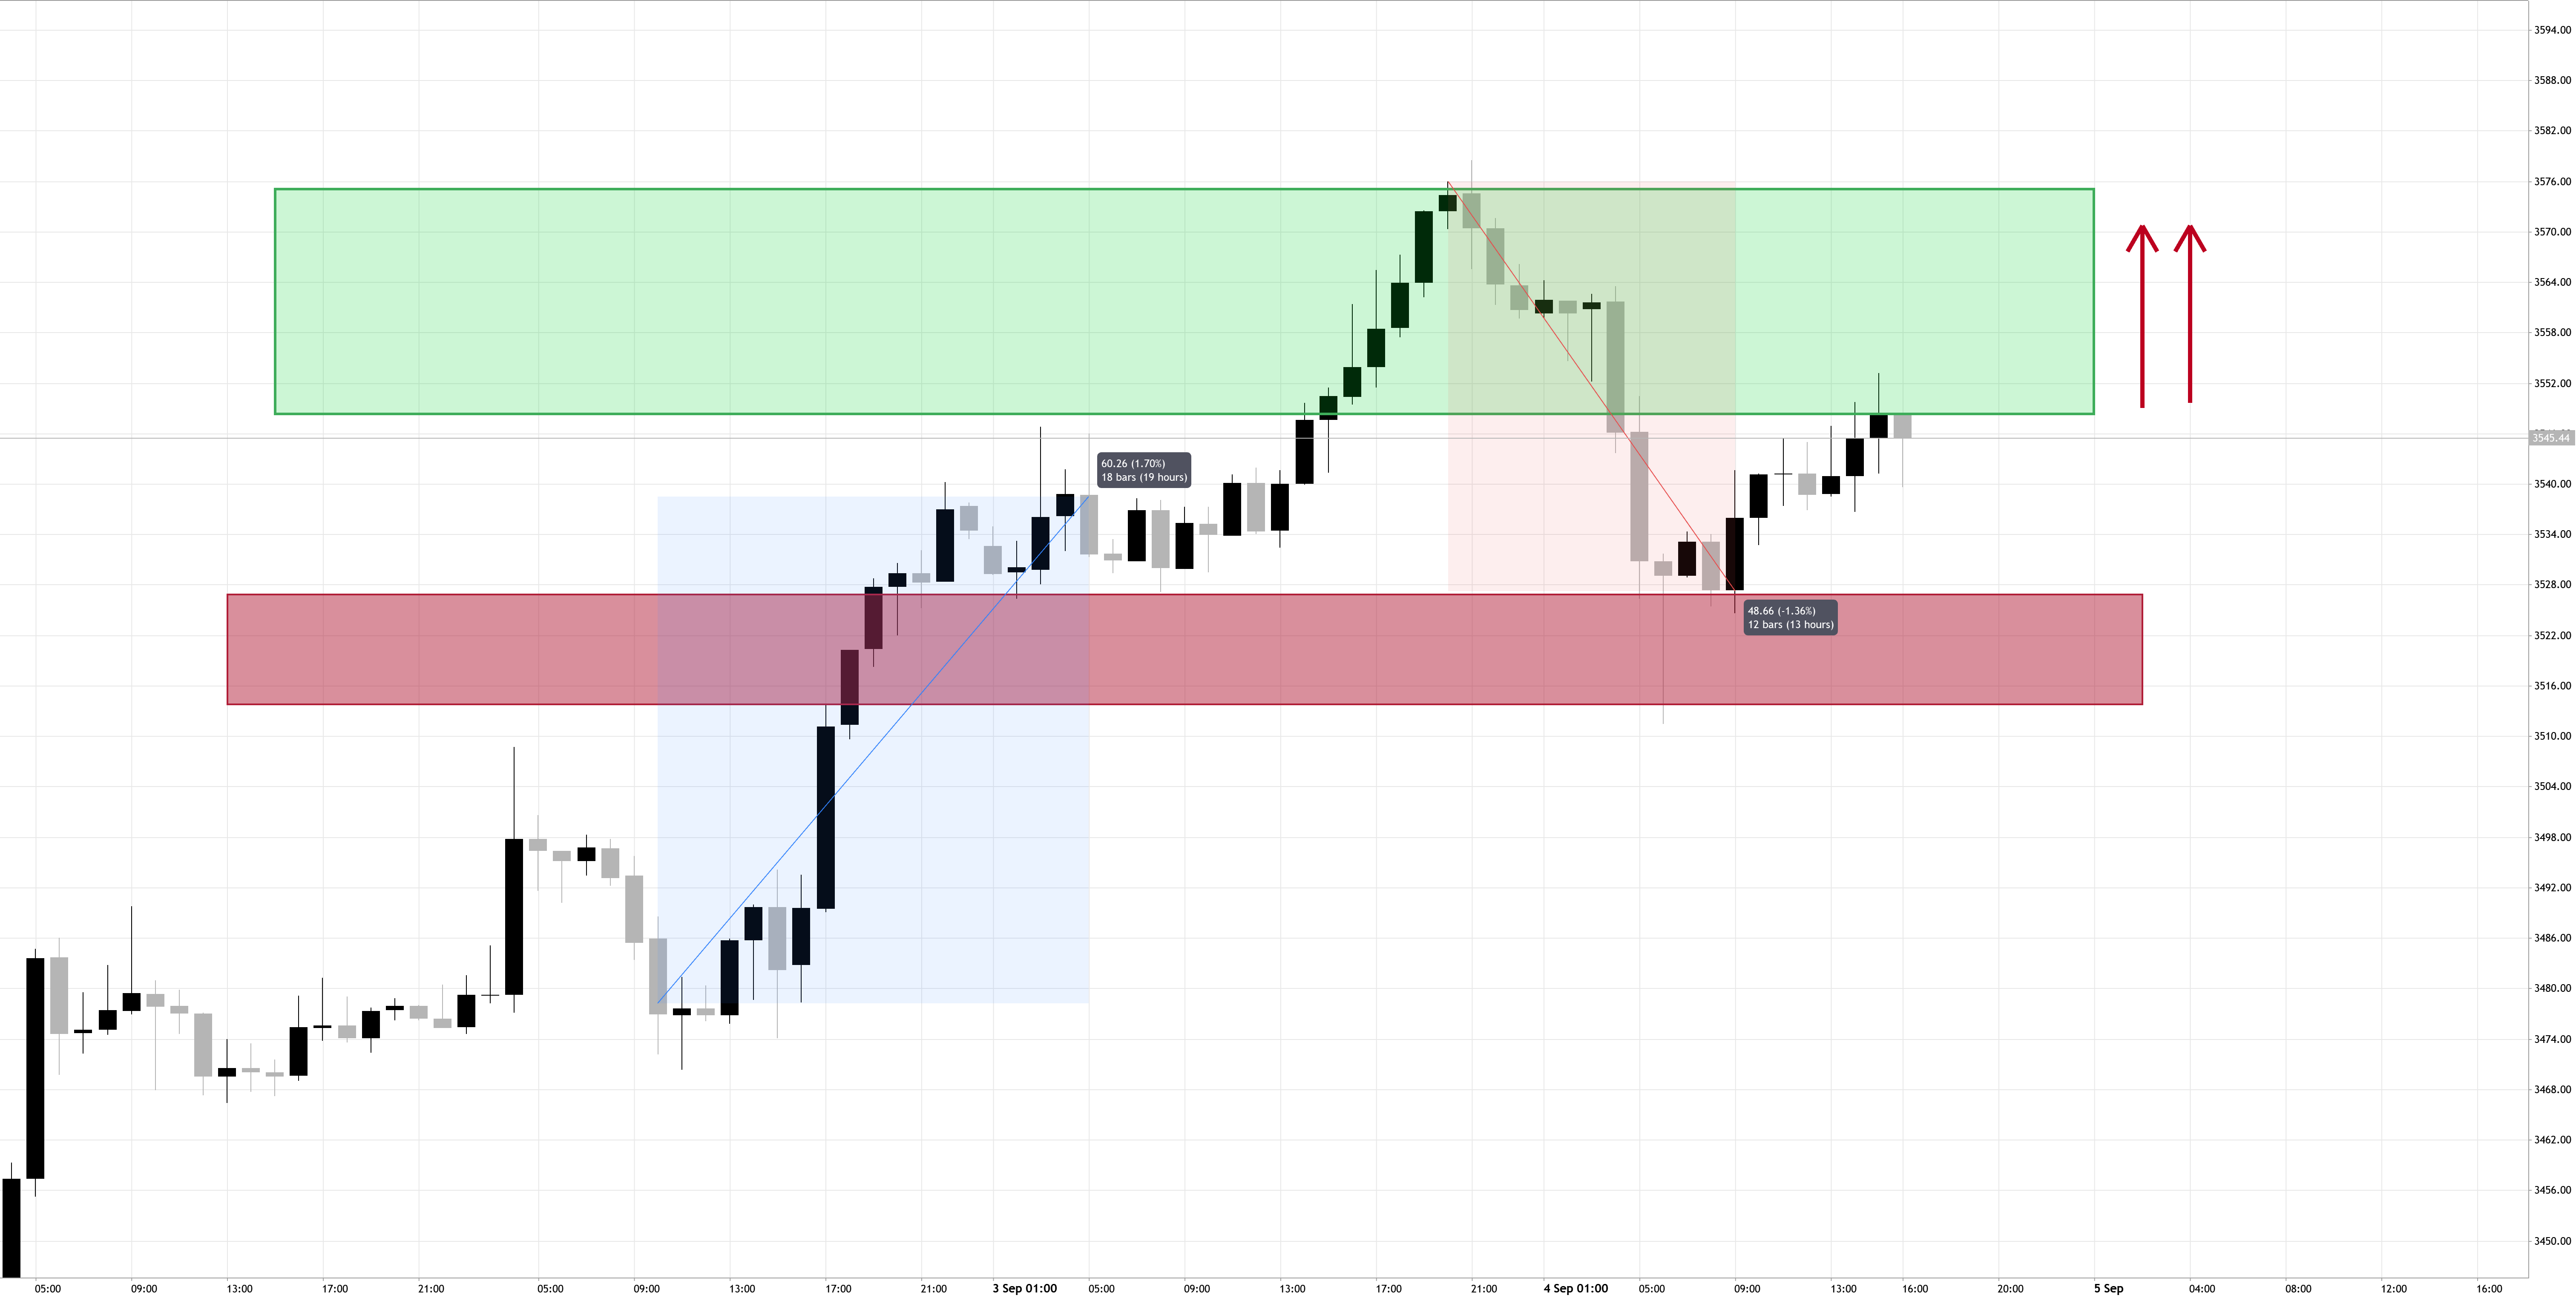
CADCHF CAD/CHF – Bullish Channel in Play CAD/CHF – Bullish Channel in Play Price is moving inside a rising channel, showing a clear bullish trend. The pair is expected to rise further to the first target area at 1.6840. If the momentum continues, the next possible target is 0.6850. As long as price stays within the channel, the bias remains bullish. Watch for reactions near the target zones—these could act as resistance and trigger short-term pullbacks. Be careful: A break below the channel could shift the bias to bearish, so keep an eye on support levels. You may find more details in the chart! Thank you and Good Luck! PS: Please support with a like or comment if you find this analysis useful for your trading day 2025.09.04 13:07 🔥 0
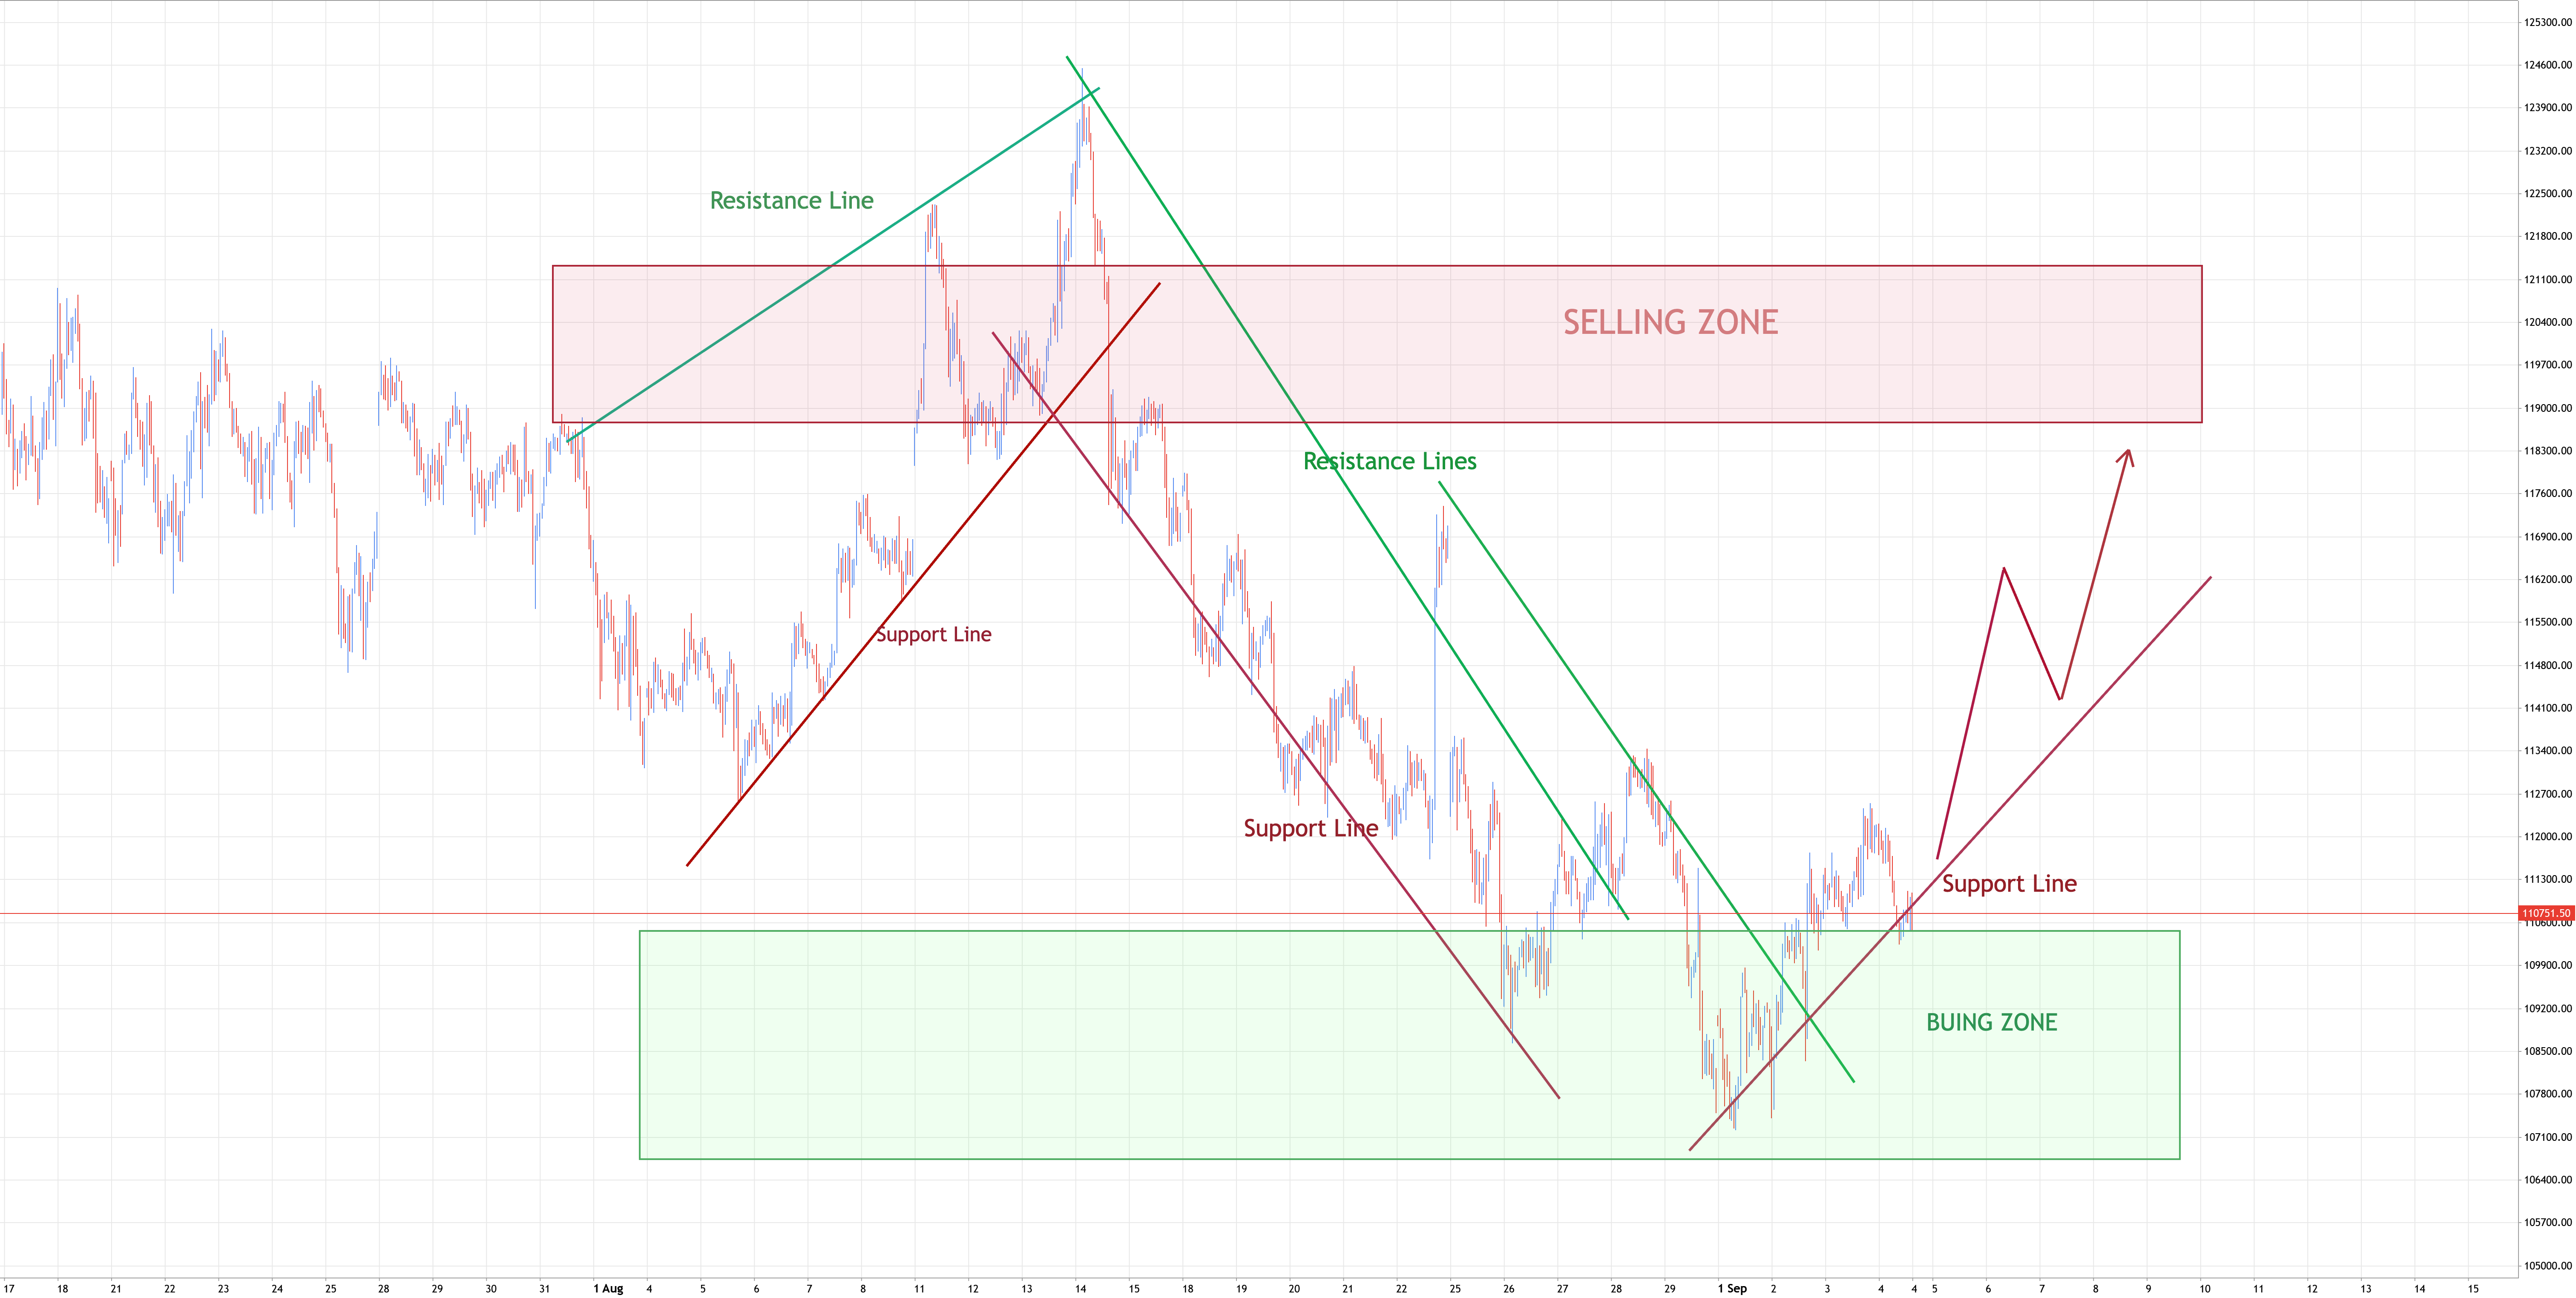
BTCUSD Bitcoin continue to move up to resistance level Hello traders, I want share with you my opinion about Bitcoin. The prolonged corrective phase for Bitcoin appears to be concluding, as the price action signals a significant shift in momentum. After a complex journey through various corrective patterns, the price established a strong support base in the 108800 buyer zone and has now executed a decisive breakout from the final descending resistance line. Currently, following this breakout, the price of BTC is in a strong upward impulse, confirming the new bullish momentum and moving decisively away from the prior consolidation zone. The primary working hypothesis is a long scenario that anticipates a brief corrective movement before the next major leg higher. The expectation is that the price will soon make a small dip to retest the recently broken resistance line, confirming it as new dynamic support. A successful and confirmed bounce from this retest would validate the strength of the breakout and signal that buyers remain in firm control, likely triggering 2025.09.04 12:52 🔥 0