BTCUSD SELL SETUP! BTCUSD Short Bitcoin vs US Dollar
BTCUSD SELL SETUP!
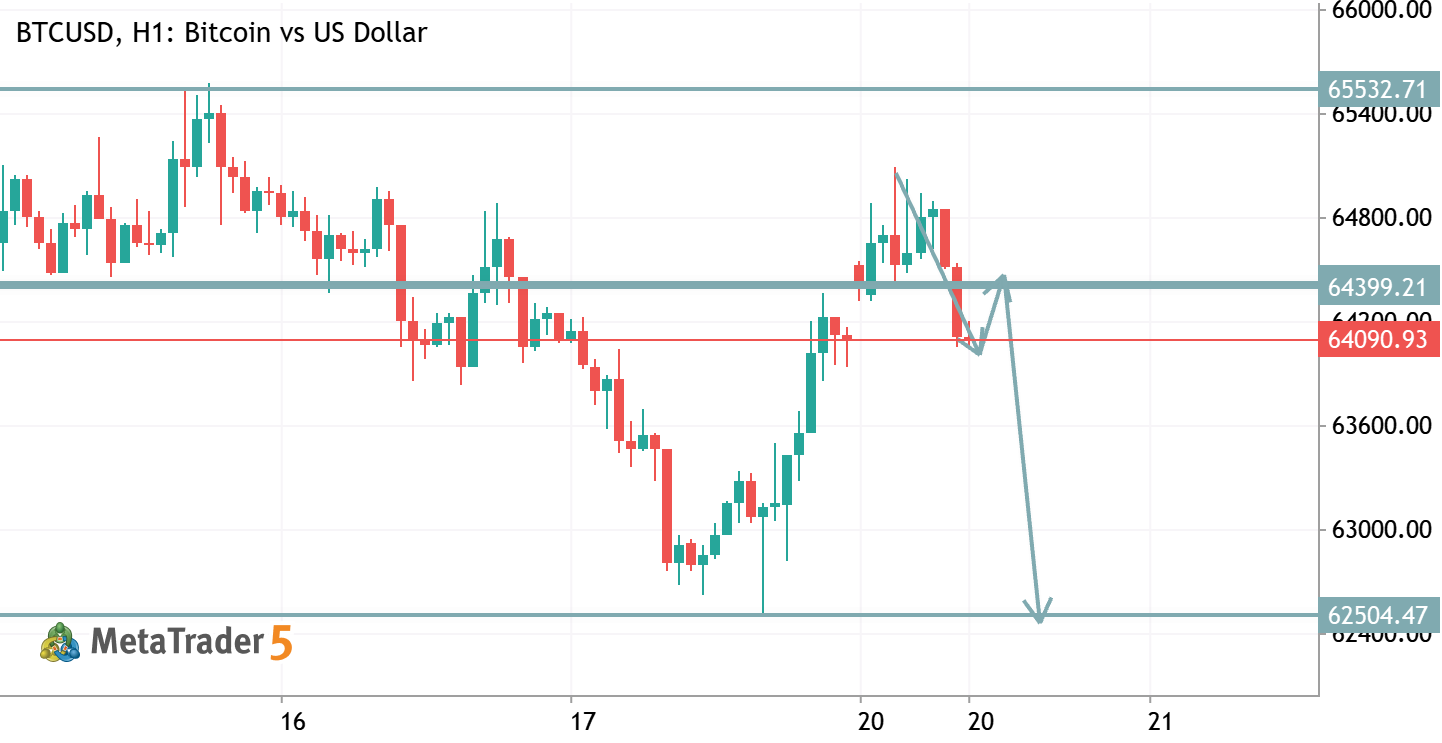
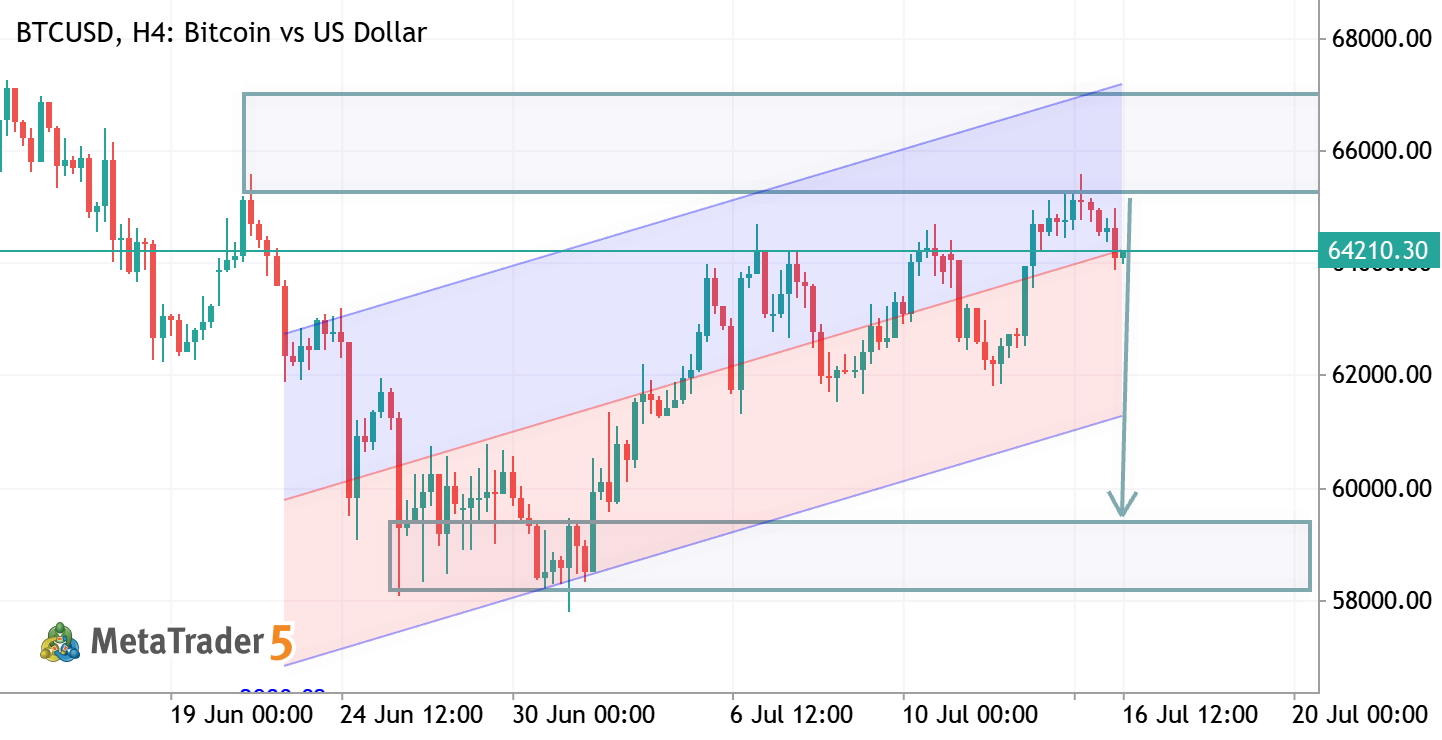
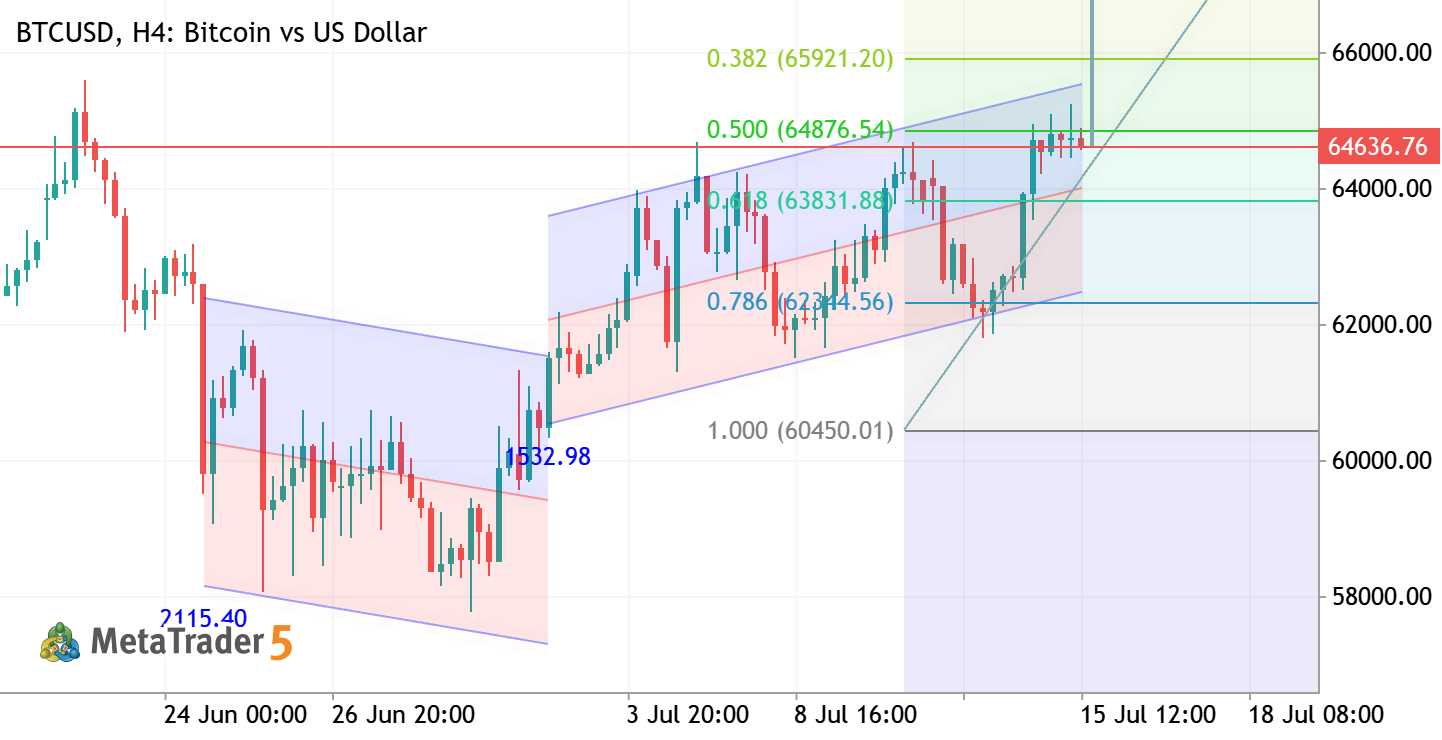
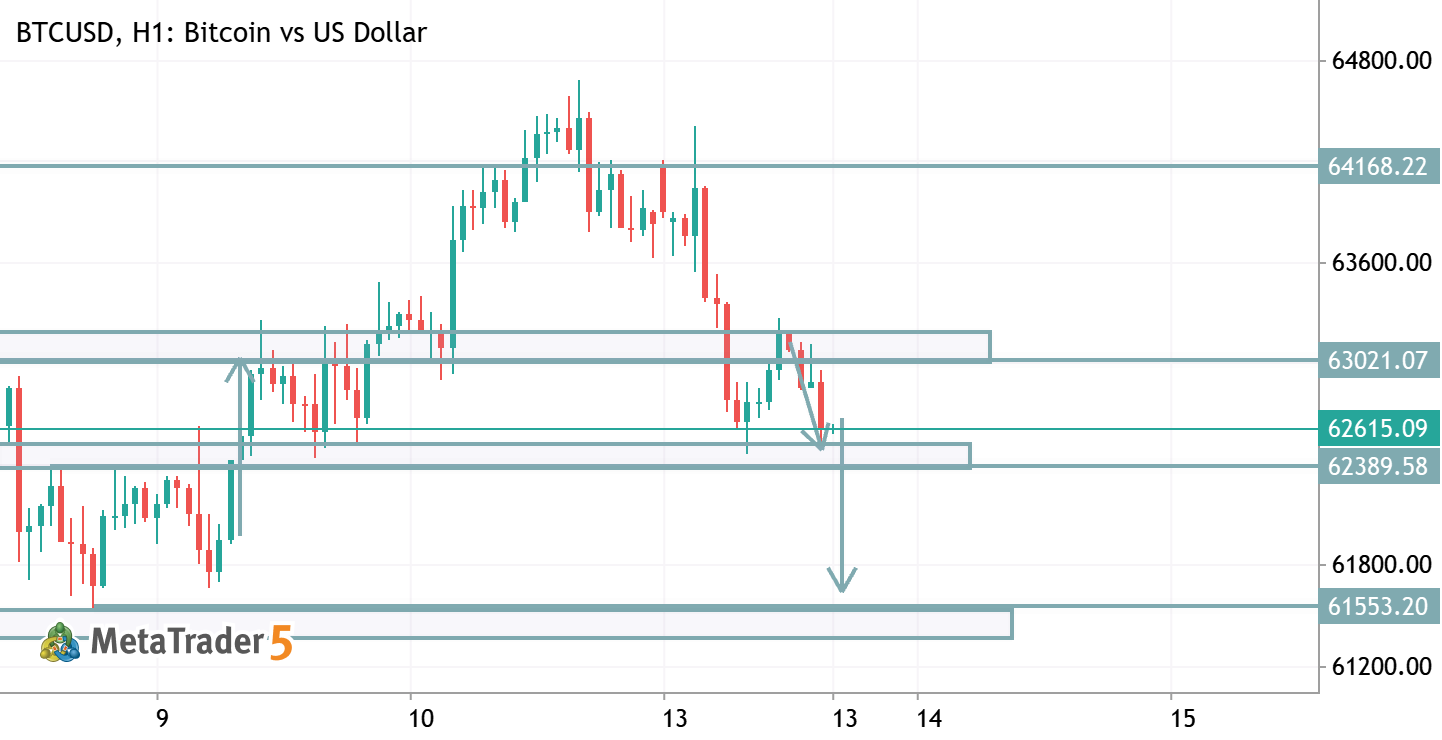
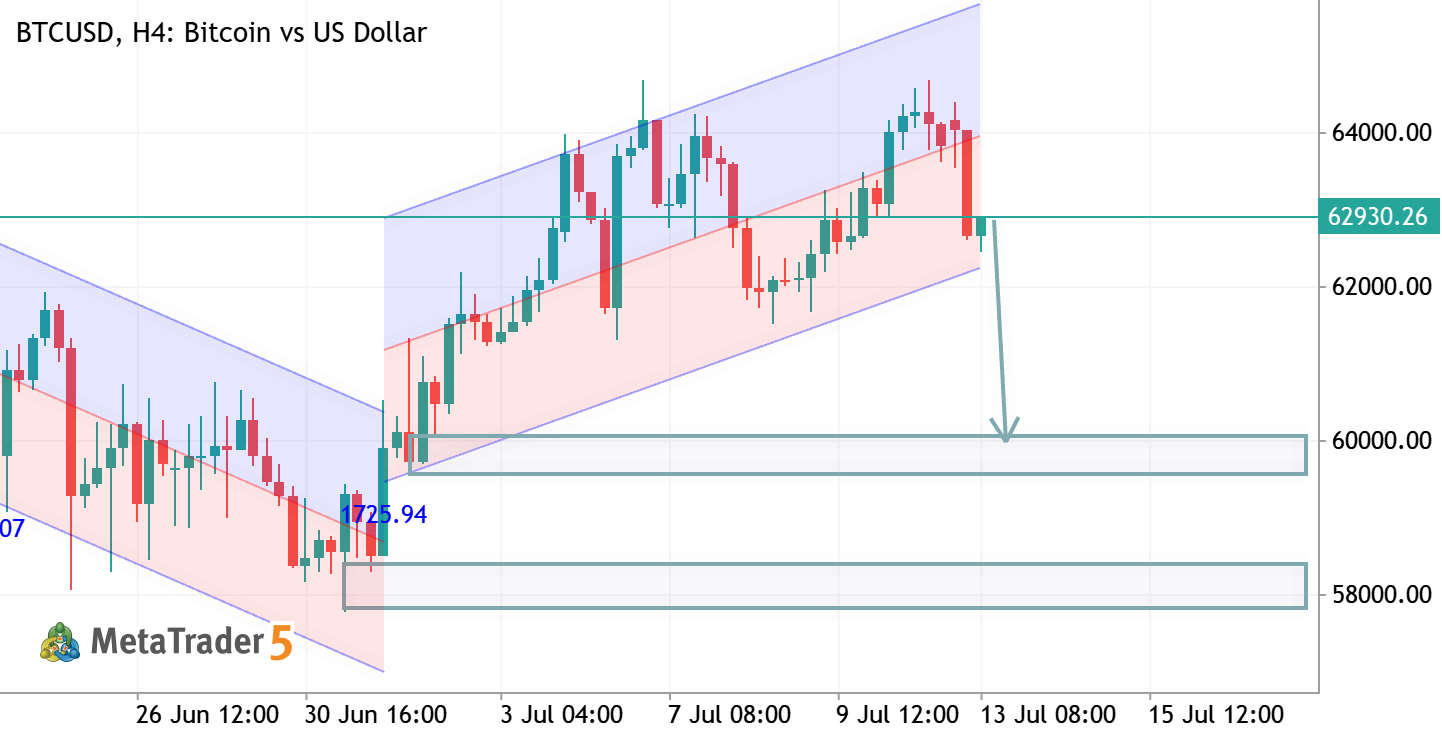
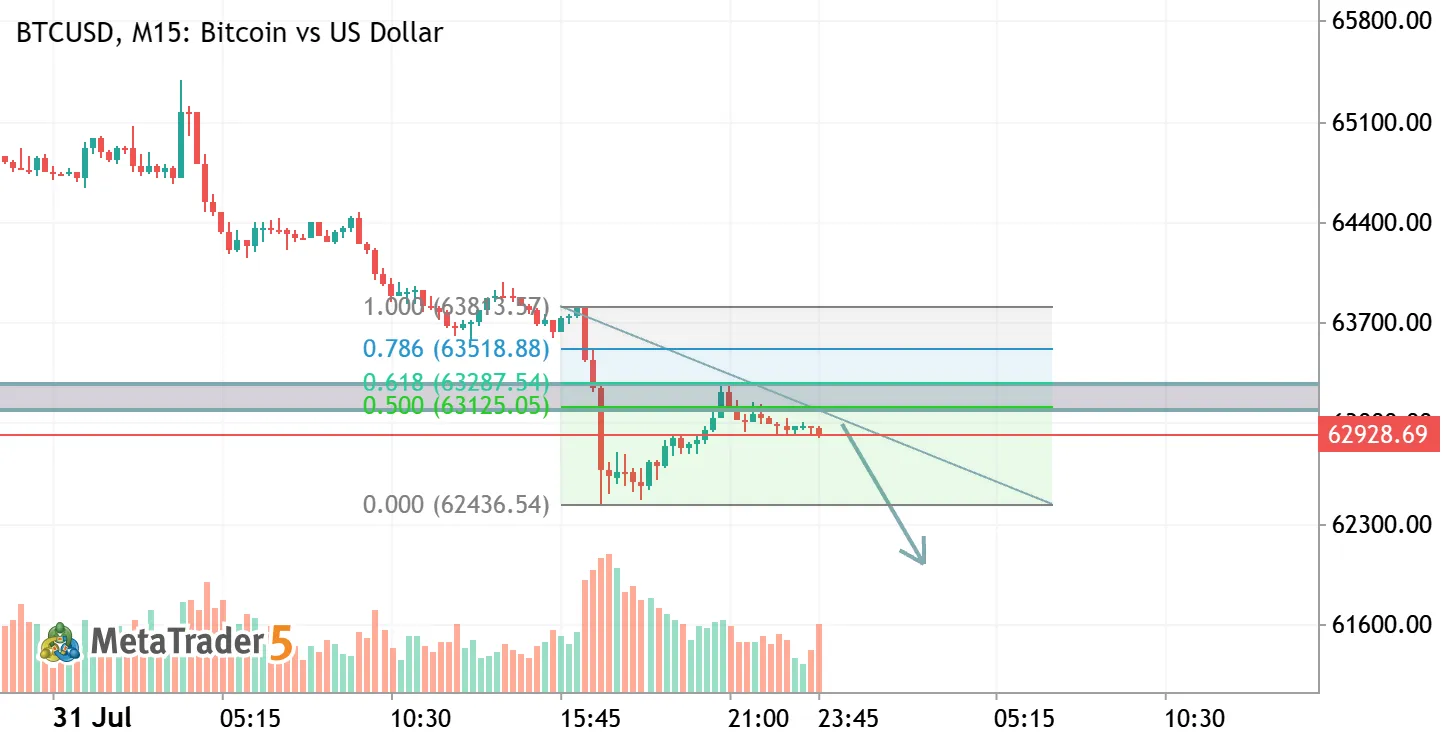
BTCUSD SELL SETUP! Bitcoin has reached a major resistance zone around 80,800 while trading inside a rising channel. Price is also testing the upper trendline, increasing the probability of a bearish rejection. The current structure suggests weakening bullish momentum near resistance. We are considering selling BTCUSD ONLY if price gets rejected below the highlighted resistance zone; Target 1: 76,000 Target 2: 72,500 Target 3: 69,000 Invalidation: A strong breakout and daily close above 83,000 could continue the bullish move higher.
0
XKing05 ArmanFx Trader 2026.05.07 04:18
BTC : ( Buy Stop ) BTCUSD Long Bitcoin vs US Dollar
BTC : ( Buy Stop )
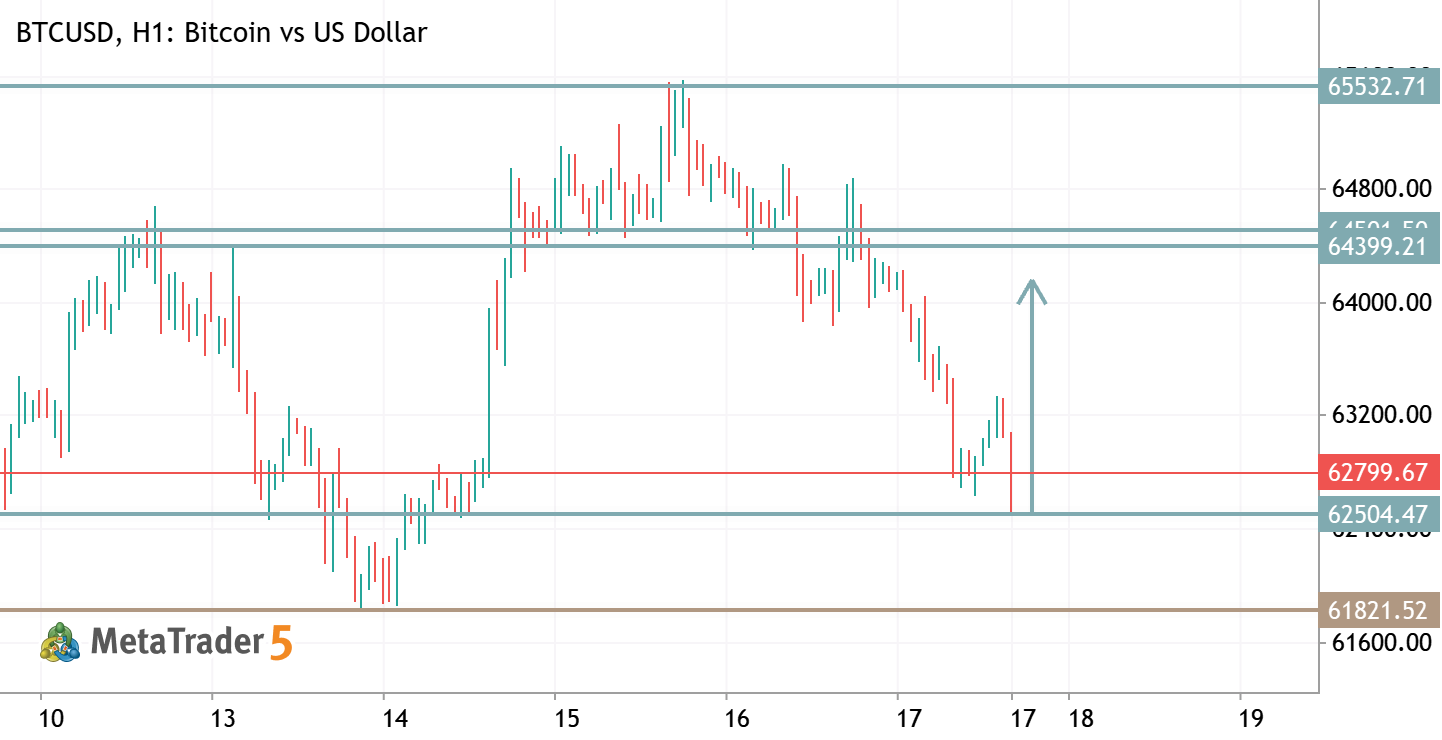
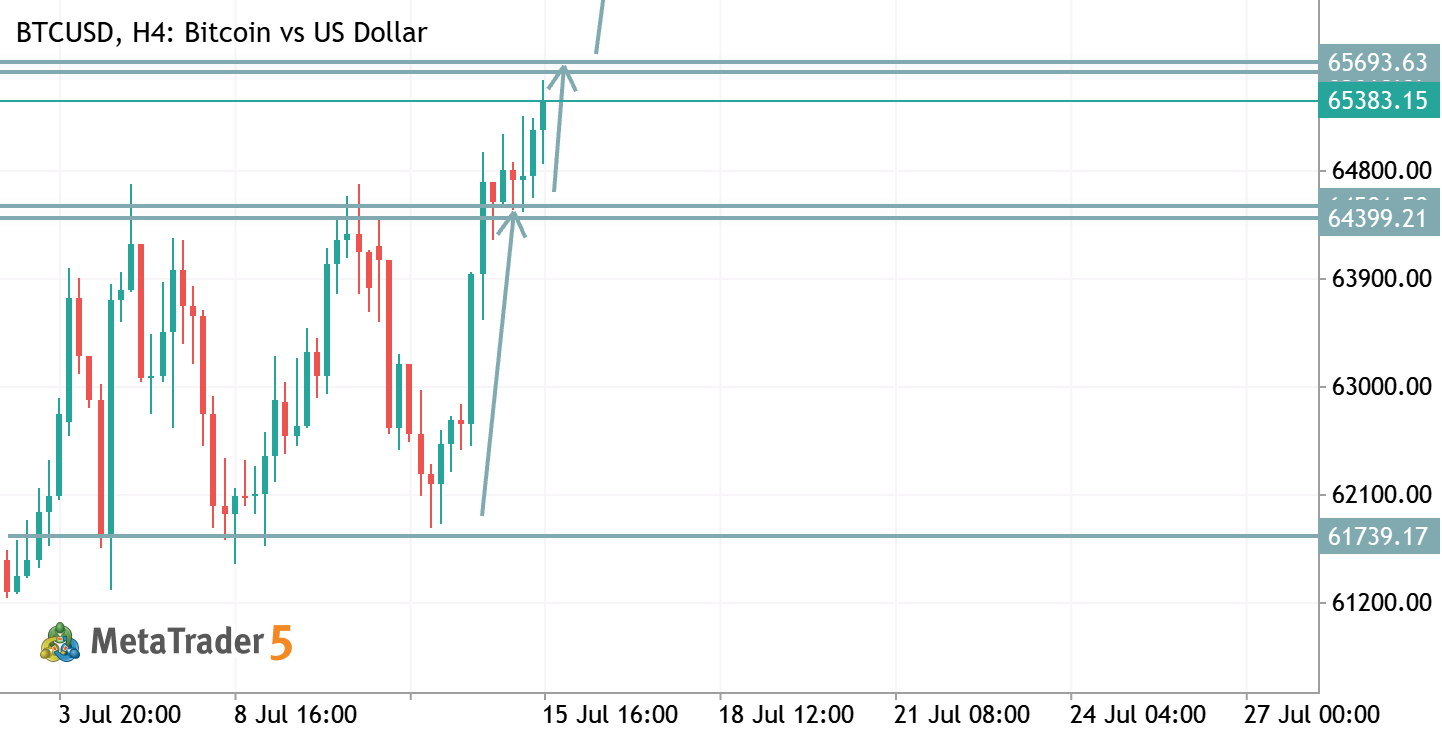
Bitcoin has been (Buying) for the last few days and weeks and therefore we can expect to be (Buying) and keep following its (Trend) it is very important to pay close attention to its (Price) as this will help us in (Scalping) and locking (Profits) we can expect a (Drop) before ever taking a (Buy) position it is best to wait for the right moment before any trade and make sure it respects all levels
0
KennyYenKen Kgosi Thamsanqa Khumalo 2026.05.05 16:27
XRPUSD - Long-Term Technical Forecast XRPUSD Ripple vs US Dollar
XRPUSD - Long-Term Technical Forecast
Weekly price is on ranging near and above 200 SMA in the bullish area of the chart. The price is located within 1.2782/1.6072 s/r channel waiting for the bullish trend to be continuing with 1.6072 resistance to be broken on close weekly bar or for the primary weekly bearish reversal to be started with the price to be crossed 200 SMA together with 1.2782 support level to below. Stochastic oscillator is on oversold market condition so the most likely scenario is the primary bullish trend to be resumed. Trading Summary : waiting for direction
0
newdigital Sergey Golubev 2026.05.03 13:32
BTCUSD - Trading Ideas for 2026: Technical Forecast and Levels BTCUSD Bitcoin vs US Dollar
BTCUSD - Trading Ideas for 2026: Technical Forecast and Levels
Weekly price is below Ichimoku oud in the bearish area of the chart. The price is located within 59847/78394 s/r channel for trying to break the resistance level at 78394 to above for the bear market rally to be started. If the price crosses 59847 to below so the primary bearish trend will be continuing. Alternatively, the price will be on secondary ranging within s/r channel. Recommendation : watch the price to cross support or resistance level on weekly close bar for possible sell or buy position for example.
4
newdigital Sergey Golubev 2026.04.24 06:18