BTC/USD: Bearish Breakdown & Fibonacci Golden Zone Retest BTCUSD Short Bitcoin vs US Dollar
BTC/USD: Bearish Breakdown & Fibonacci Golden Zone Retest
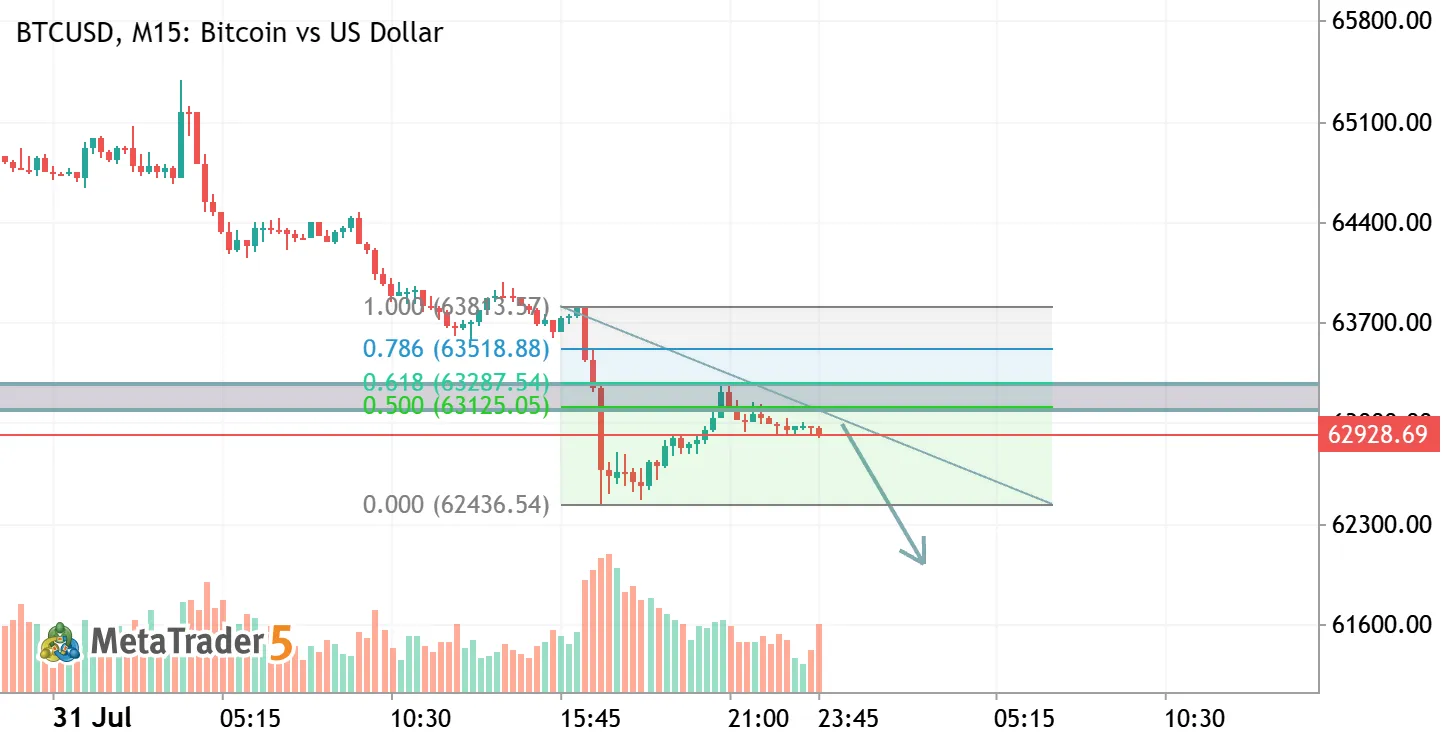
Direction: Short / Sell Asset: BTCUSD Timeframe: M15 📍 Key Trade Levels Entry Zone: $62,900 – $63,120 (Current market price retesting broken support) Stop Loss (SL): $63,550 (Above the 0.786 Fibonacci level / high of the recent pull-back) Take Profit 1 (TP1): $62,440 (Recent local swing low) Take Profit 2 (TP2): $62,000 (Extended target as projected by the trend arrow) 📊 Setup Rationale Support Breakout: Price aggressively broke down below the previous key horizontal support zone ($63,120 – $63,280). Fibonacci Golden Zone Confluence: The retracement move tapped directly into the 0.50 ($63,127) and 0.618 ($63,288) Fibonacci retracement level, which now acts as strong resistance. Bearish Market Structure: Lower lows and lower highs are clearly established on the short timeframe following
0

AashishManglani0 Aashish Manglani 2026.08.01 13:15
XAUUSD TRADE IDEA XAUUSD Short Gold vs US Dollar
XAUUSD TRADE IDEA
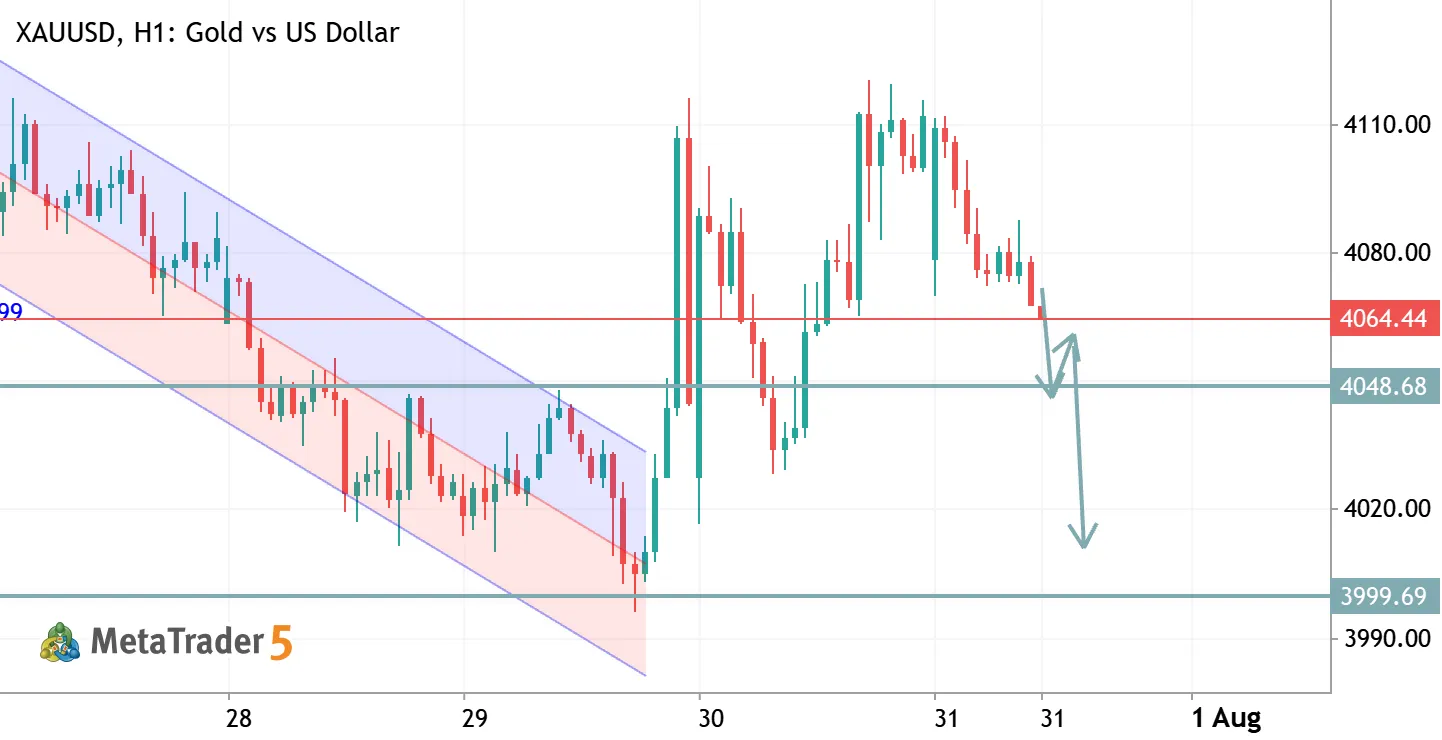
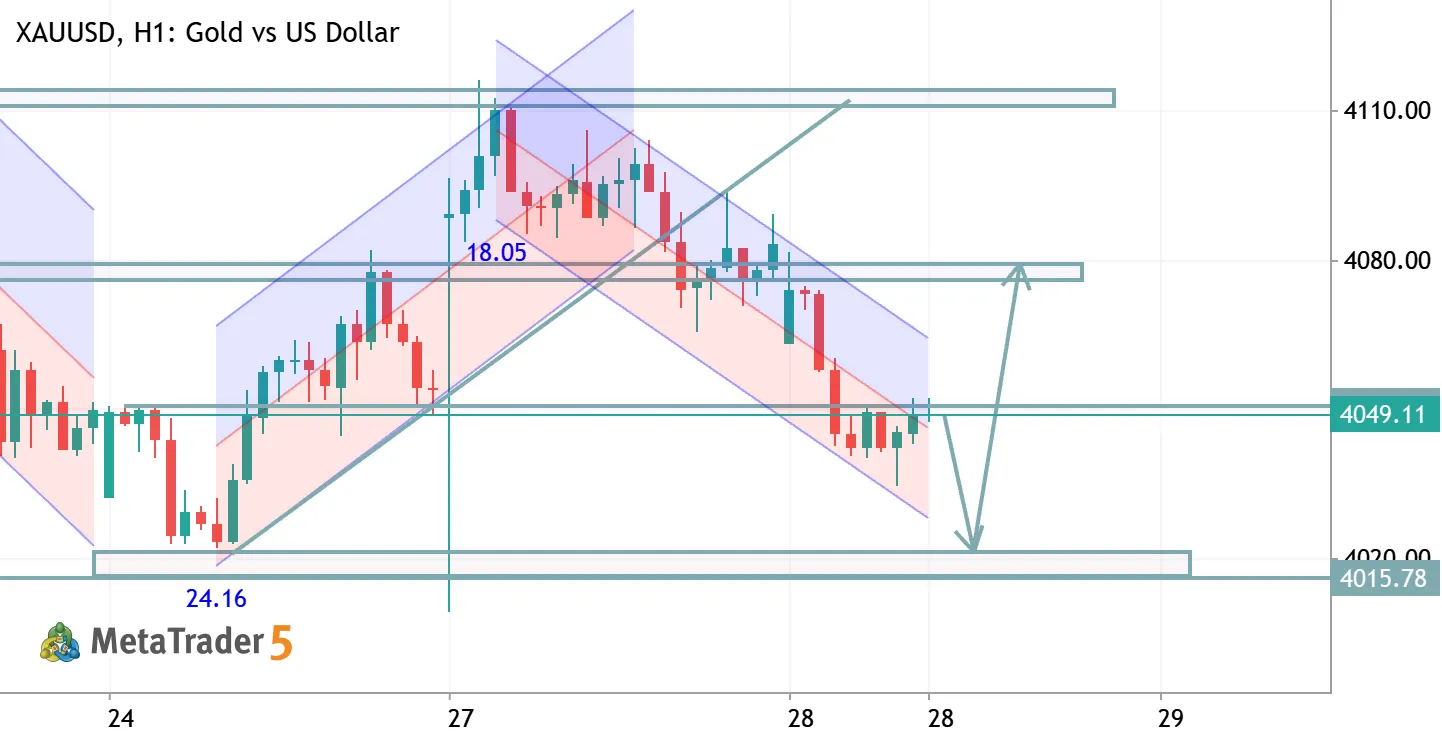
XAUUSD H1 Bias: Sell Price is trading below the 4066 resistance , showing weakening bullish momentum. A move toward the 4048 support is likely. If this level breaks, sellers could extend the decline. Sell Entry: 4060–4068 (or on a rejection from resistance) Stop Loss: Above 4085 Take Profit 1: 4048 Take Profit 2: 4020 Take Profit 3: 4000 Invalidation: A strong hourly close above 4066–4070 would weaken the bearish outlook and could lead to a retest of higher resistance.
1
HamadJatoi Hamad Jatoi 2026.07.31 08:06
XOM - Daily Trading Forecast XOM Long ExxonMobil Holdings Corporation Common Stock
XOM - Daily Trading Forecast
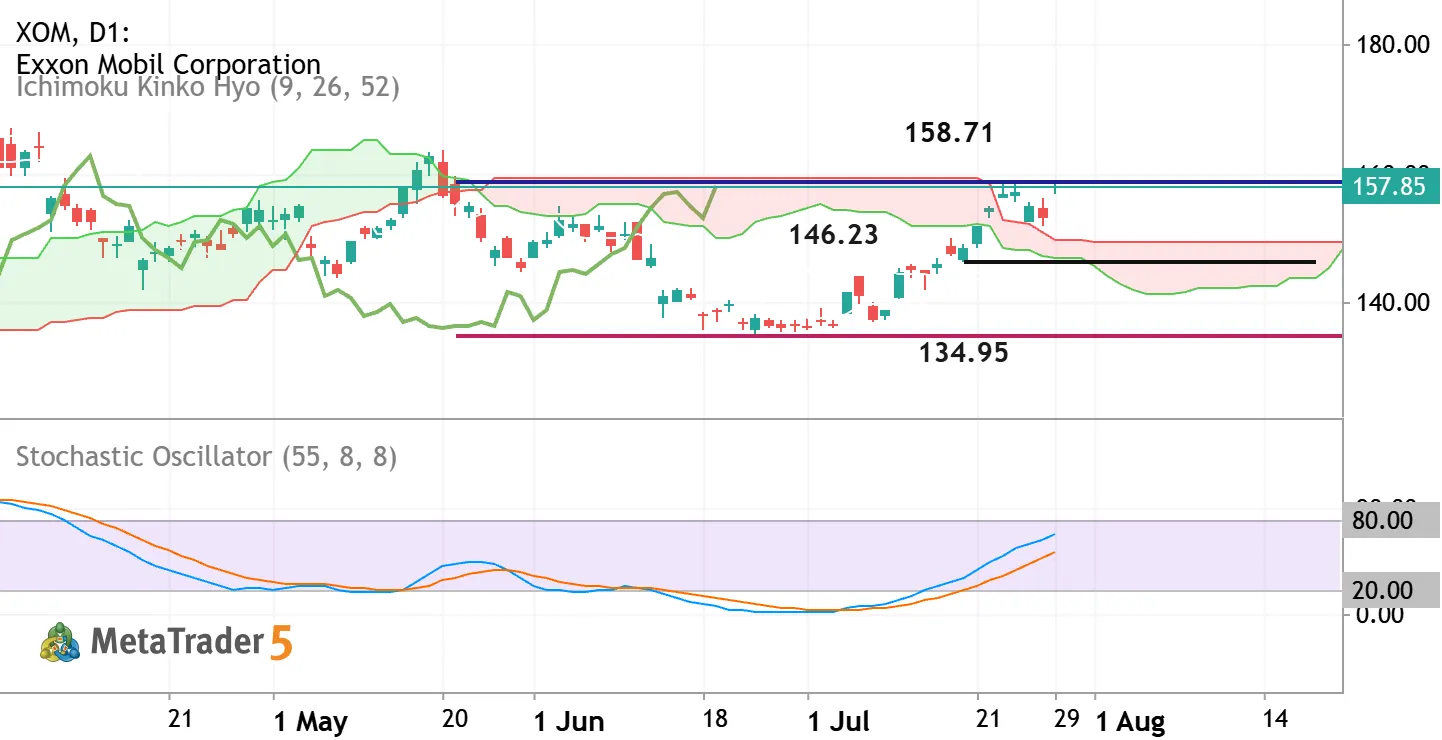
The daily price is located near and above Ichimoku cloud in the bullish area of the chart: Chinkou Span line of Ichimoku indicator already broke the historical price to above for the good breakout to be started, and the price crosses the Ichimoku cloud to above as well for the daily primary bullush reversal. If the price breaks resistance level at 158.71 so the strong bullish trend may be continuing. If the price crosses support level at 146.23 to 134.95 as the nearest possible target so primary bearish trend will be resumed. Alternatively, the price will be on secondary ranging to be near and inside Ichimoku cloud and within s/r channel waiting for direction of the strong trend to be started. Trading Summary : breakout with the possible daily bullish reversal
1
newdigital Sergey Golubev 2026.07.29 15:38
XAUUSD Bearish Setup: 4H Symmetrical Triangle Breakdown Targets 3800 XAUUSD Short Gold vs US Dollar
XAUUSD Bearish Setup: 4H Symmetrical Triangle Breakdown Targets 3800
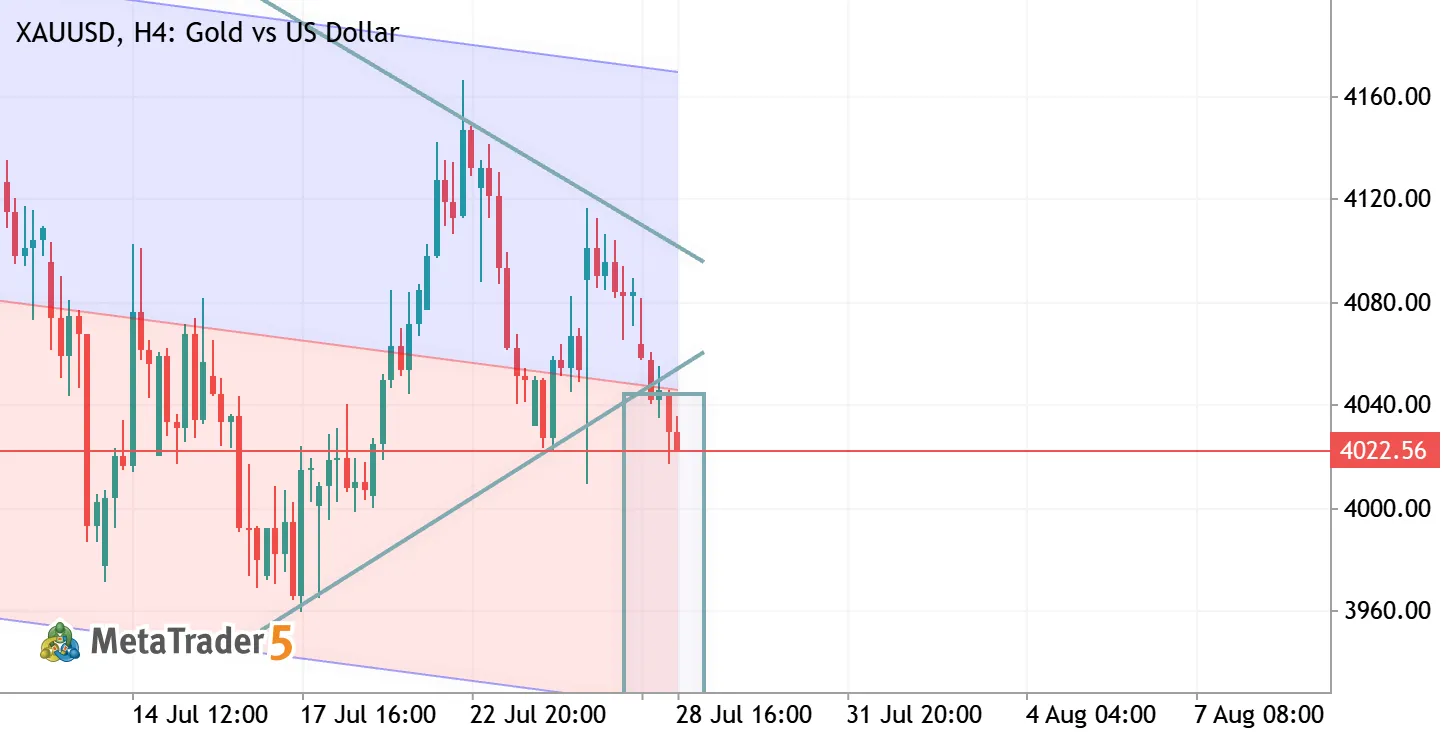
XAUUSD (Gold) – Bearish Continuation Setup Gold has broken below the symmetrical triangle formation, signalling a potential shift in momentum toward the downside. After the breakout, price is now trading within a regression channel, suggesting that sellers may continue to control the short-term structure. Key levels: Resistance: 4025–4045 area (breakdown/retest zone) Bearish confirmation: Continued rejection below the broken triangle support Downside target: 3800 region Scenario: If gold remains below the broken triangle support and the regression channel continues to hold, price may extend lower toward the 3800 area. Invalidation: A strong recovery back above the broken structure would weaken the bearish setup.
0
therealjoe0621 Joel Wilbert Msigwa 2026.07.28 13:45
GBPUSD (H4) — The Correction Isn't Over Yet GBPUSD Short Pound Sterling vs US Dollar
GBPUSD (H4) — The Correction Isn't Over Yet
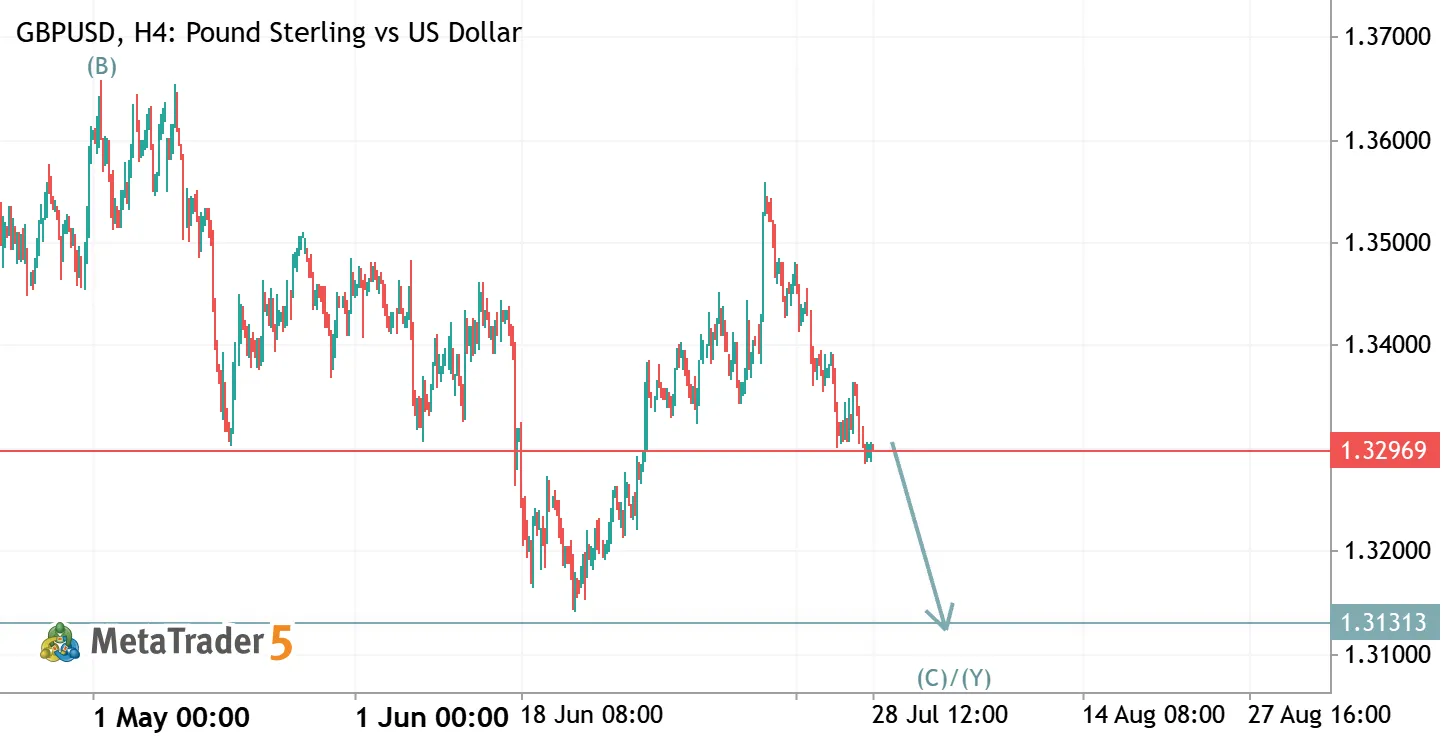
Wave Count The structure since the Primary [C] low at 1.2980 (Oct 2025) is straightforward once the higher degree is separated from the noise: Primary [W]: 1.2980 → 1.3860 (Jan 2026) — a completed advance off the October low. Primary [X] (in progress since Jan 2026) — a broad, seven-month double-three correction : Intermediate (A): 1.3860 → 1.3130 (Mar low) Intermediate (B): 1.3130 → 1.3650 (Apr high) Intermediate (C) / Wave (Y): 1.3650 → 1.3110 (Jun low), rejected again at 1.3550 (Jul high), now pressing back down toward the range floor. In short: Sterling has been chopping inside a 1.3110–1.3650 box for half a year, and the latest rejection from 1.3550 puts price back on the downside leg of that range , not on a fresh breakout. Primary Scenario — Bearish (favored) Wave (Y) of Primary [X]
3
AdigunOluwaseun Adigun Oluwaseun 2026.07.28 09:30
XAUUSD TRADE IDEA XAUUSD Short Gold vs US Dollar
XAUUSD TRADE IDEA
XAUUSD H1 Bias: Bearish in the short term Trend: Price remains inside a descending channel, with lower highs and lower lows. Resistance: 4078–4082 , then 4108–4112 (major supply zone). Support: 4045 , then 4016 (strong demand zone). Trade Idea (Sell): Entry: Sell on a pullback to 4078–4082 , or after a confirmed break below 4045 . Stop Loss: Above 4112 . Take Profit 1: 4045 Take Profit 2: 4016 Conclusion: The overall structure remains bearish. Unless price breaks and closes above 4112 , sellers maintain the advantage. A rejection from resistance or a breakdown below 4045 would strengthen the bearish continuation.
2
HamadJatoi Hamad Jatoi 2026.07.28 07:58
DAX — week of July 27 – 31, 2026: Long
40
DE40 Long Germany 40 Index
DAX — week of July 27 – 31, 2026: Long
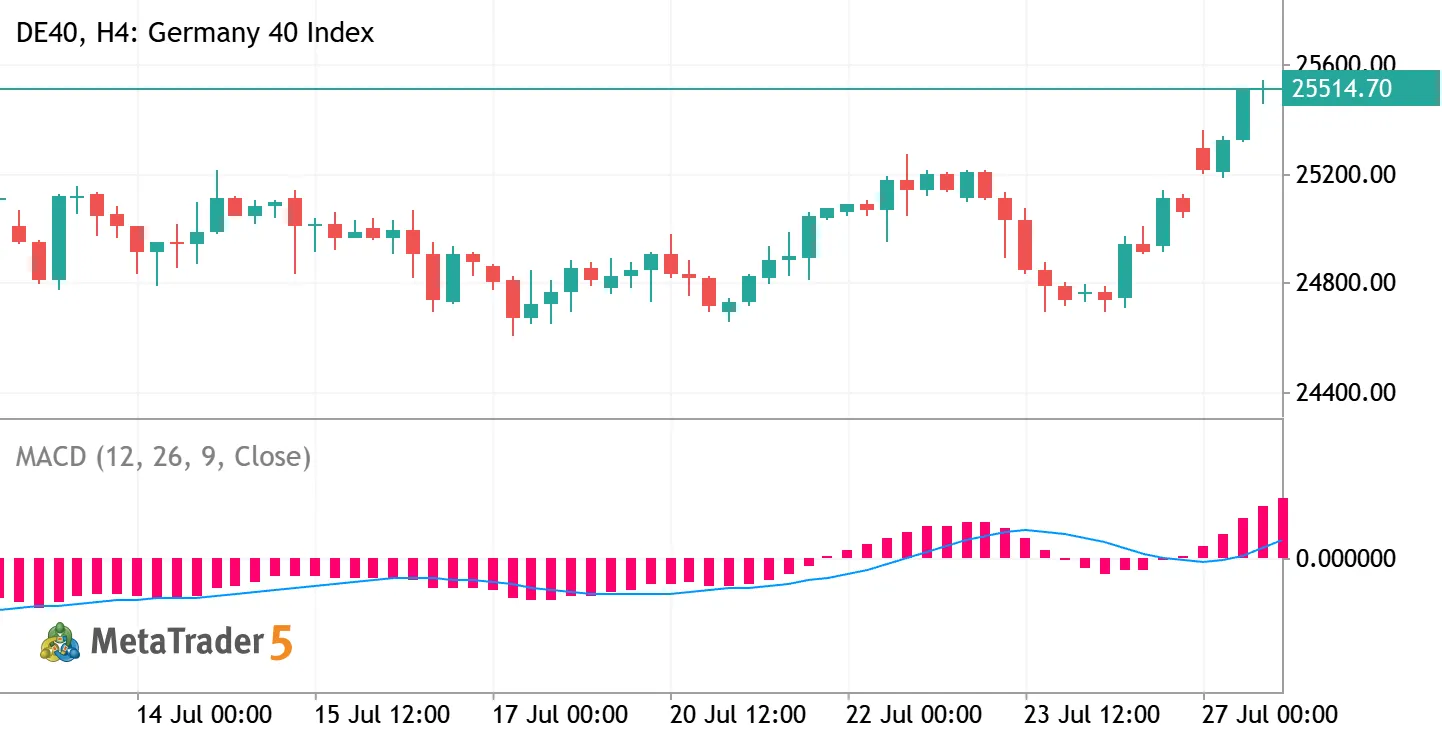
Long — Last week's map wanted 24,715 and the tape refused to pay it — the break off Wednesday's 25,370 died at 24,784, 69 points short, and Friday bought the whole thing back to a green 25,172 close. A market that won't do the easy thing is loading the hard one. This morning it gapped onto 25,370, last week's exact ceiling, held the retest 42 points above Friday's 25,228 high, and folded weekly R1 at 25,436 before lunch. Here is the mechanism behind the speed: resistance is inventory — prices where somebody owns something and defends it — and above 25,370 there is none. July 8 crossed the entire 25,000–25,660 corridor in one 703-point session on 34,226 lots, the heaviest day of the month, and in the thirteen sessions since, nothing above 25,370 has traded at all. That vacuum is why 300
2
stuki Istvan Balazsa 2026.07.27 13:20
XAUUSD H1 ANALYSIS XAUUSD Gold vs US Dollar
XAUUSD H1 ANALYSIS
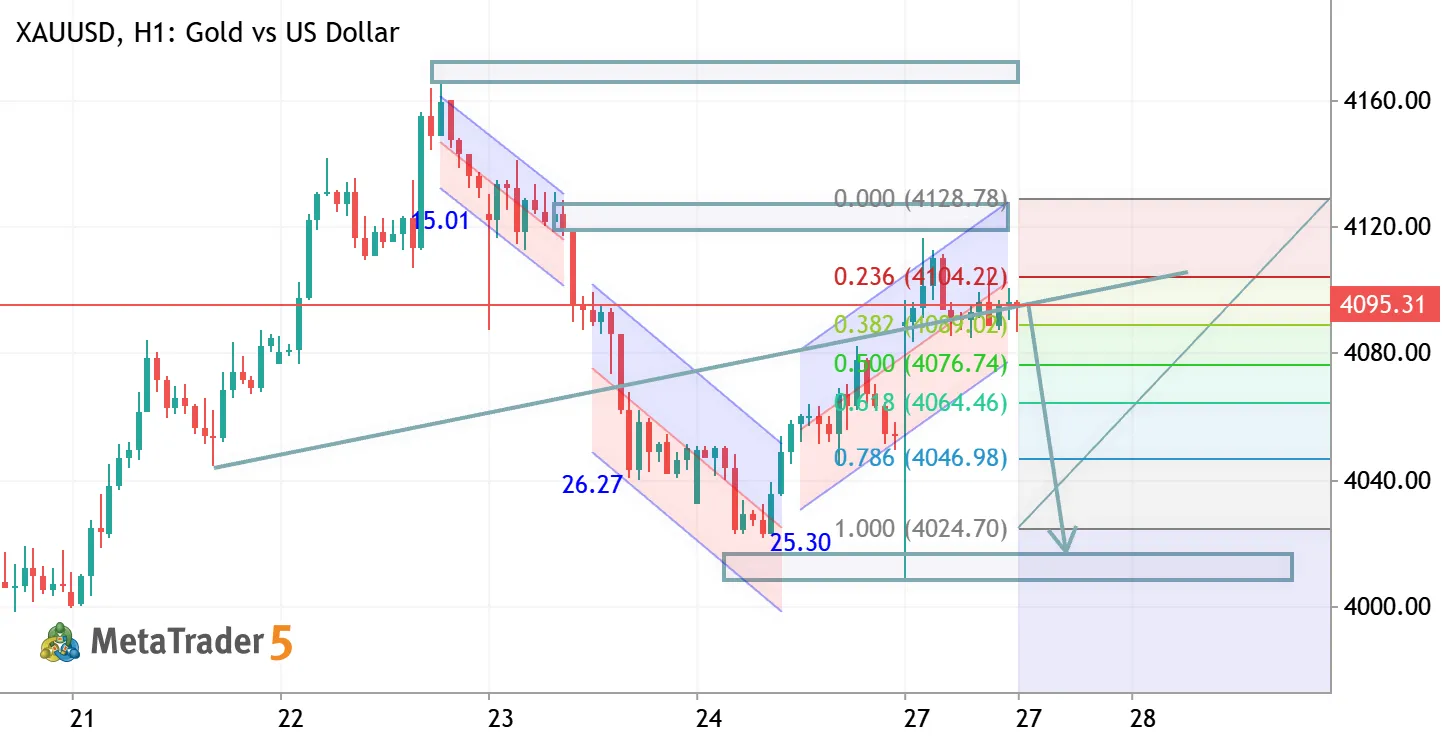
XAUUSD H1 Analysis Gold is attempting a bullish recovery after finding support near the recent swing low. Price is trading above key Fibonacci support, but buyers must clear the 4095–4130 resistance zone to confirm a trend reversal. A successful breakout could fuel further upside. 📈 Bias: Bullish Recovery 🎯 Targets: 4095 → 4130 ⚠️ Key Support: 4025–4000 Wait for a confirmed breakout or a pullback to support before entering. Always use proper risk management.
2
Goldanalysisteam Abdul Qayoom 2026.07.27 10:39
XAUUSD: Rising Channel Breakdown Potential Bearish Scenario XAUUSD Gold vs US Dollar
XAUUSD: Rising Channel Breakdown Potential Bearish Scenario
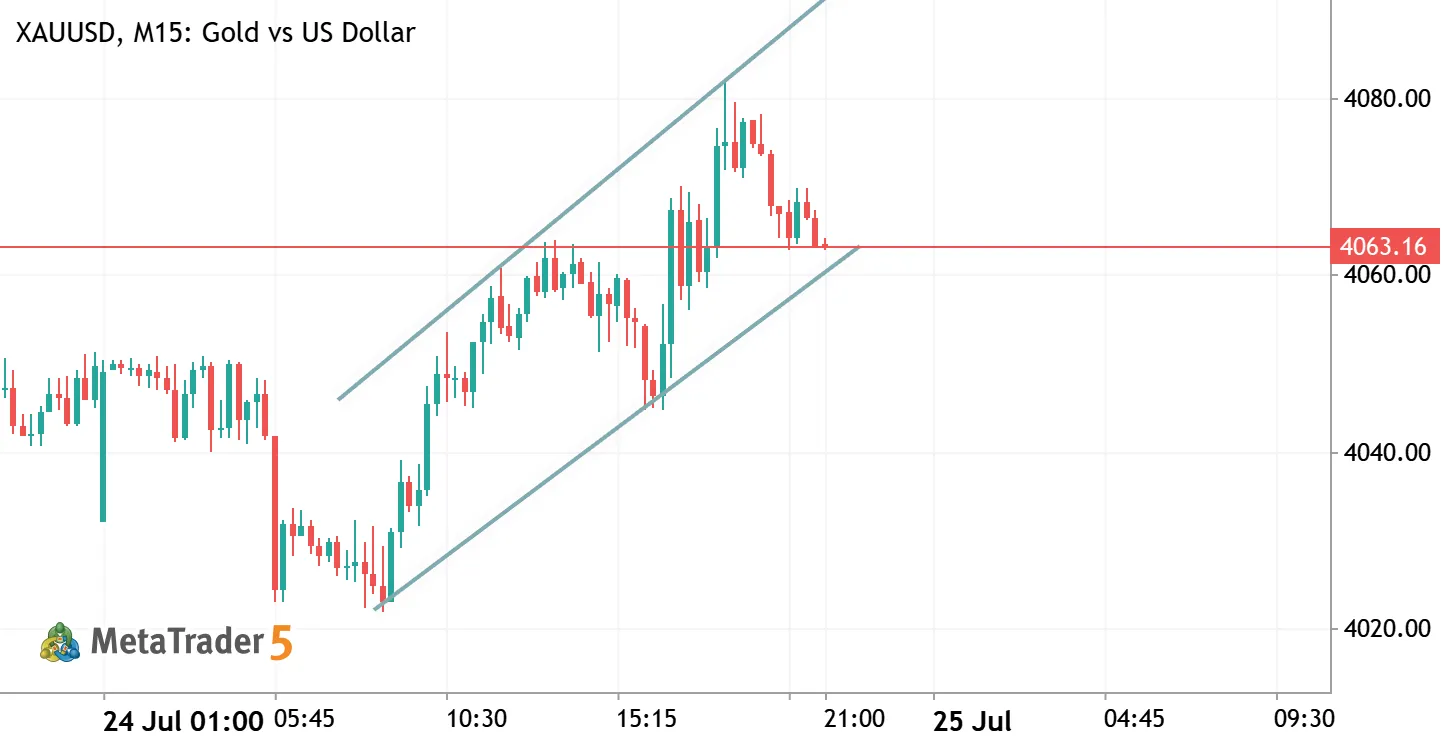
Gold is currently moving inside an ascending channel after a strong bearish move. However, this structure may represent a corrective pullback rather than a full reversal. I'm watching for a breakdown below the channel support. A confirmed break and rejection on the retest could indicate bearish continuation toward previous support areas. Key levels: 🔻 Channel support: Bearish breakout area 🔹 Support zones: 4050 / 4020 Waiting for price action confirmation before considering the next move.
0
therealjoe0621 Joel Wilbert Msigwa 2026.07.24 18:04
BTCUSD: Bearish Continuation Setup After Support Bounce BTCUSD Short Bitcoin vs US Dollar
BTCUSD: Bearish Continuation Setup After Support Bounce
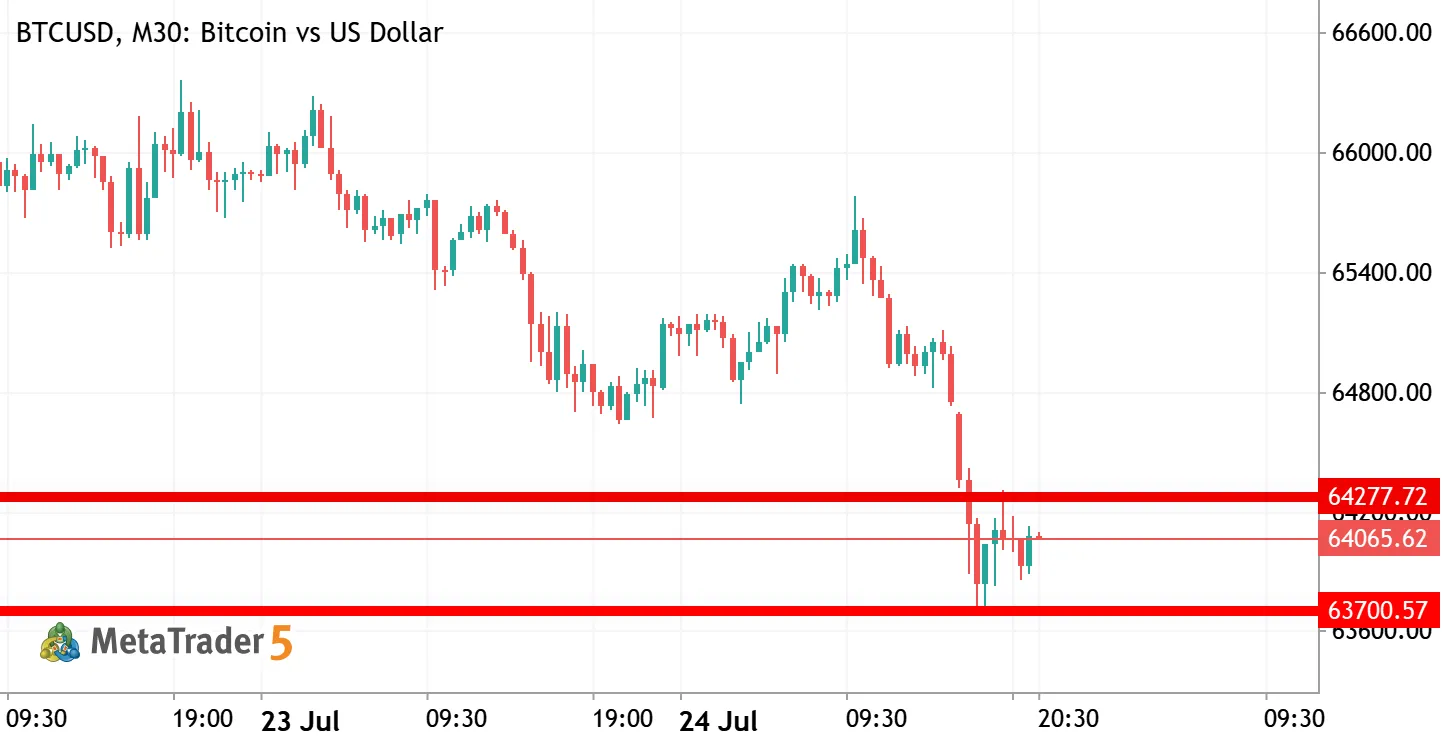
📉 BTCUSD Market Structure Analysis Bitcoin recently bounced from the key support area around 63,700–64,000. However, price is now approaching a previous bullish reaction zone, which may act as resistance after the recent breakdown. I'm watching this area for a possible bearish rejection. If sellers regain control, BTC could continue its downside movement toward lower liquidity areas. Key levels: 🔴 Resistance / rejection zone: Previous bullish reaction area 🟢 Support: 63,700–64,000 Confirmation from price action will be important before considering the next move.
0
therealjoe0621 Joel Wilbert Msigwa 2026.07.24 17:33
XAUUSD H1 ANALYSIS XAUUSD Gold vs US Dollar
XAUUSD H1 ANALYSIS
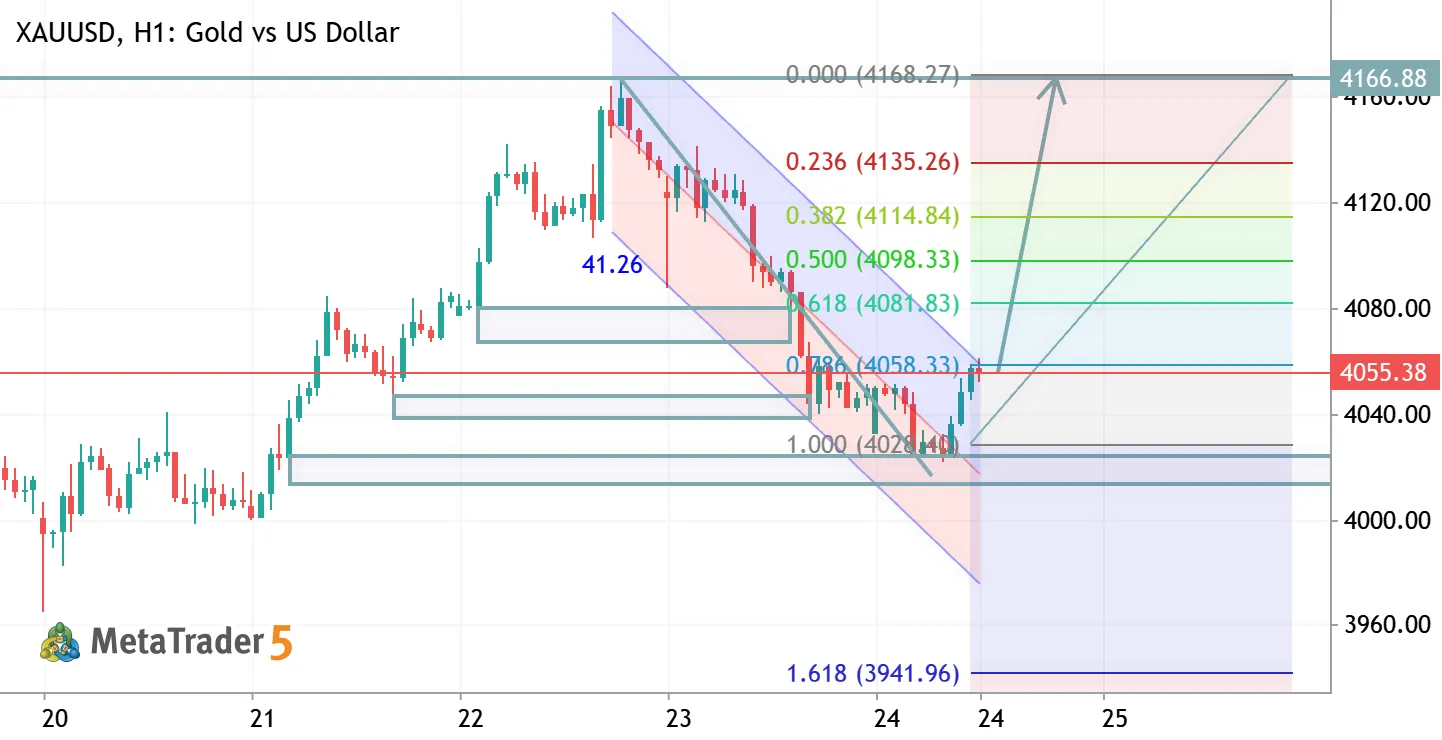
XAUUSD H1 Analysis Gold is showing signs of a bullish reversal after rejecting the descending channel support. Price has reclaimed key Fibonacci levels, and buyers are targeting the major resistance zone near 4165. A sustained move above resistance could accelerate the bullish momentum. 📈 Bias: Bullish 🎯 Targets: 4135 → 4165 ⚠️ Key Support: 4050–4020 The trend favors buyers while price holds above support. Wait for confirmation and apply proper risk management before entering.
0
Goldanalysisteam Abdul Qayoom 2026.07.24 09:47
BTCUSD TRADE IDEA BTCUSD Bitcoin vs US Dollar
BTCUSD TRADE IDEA
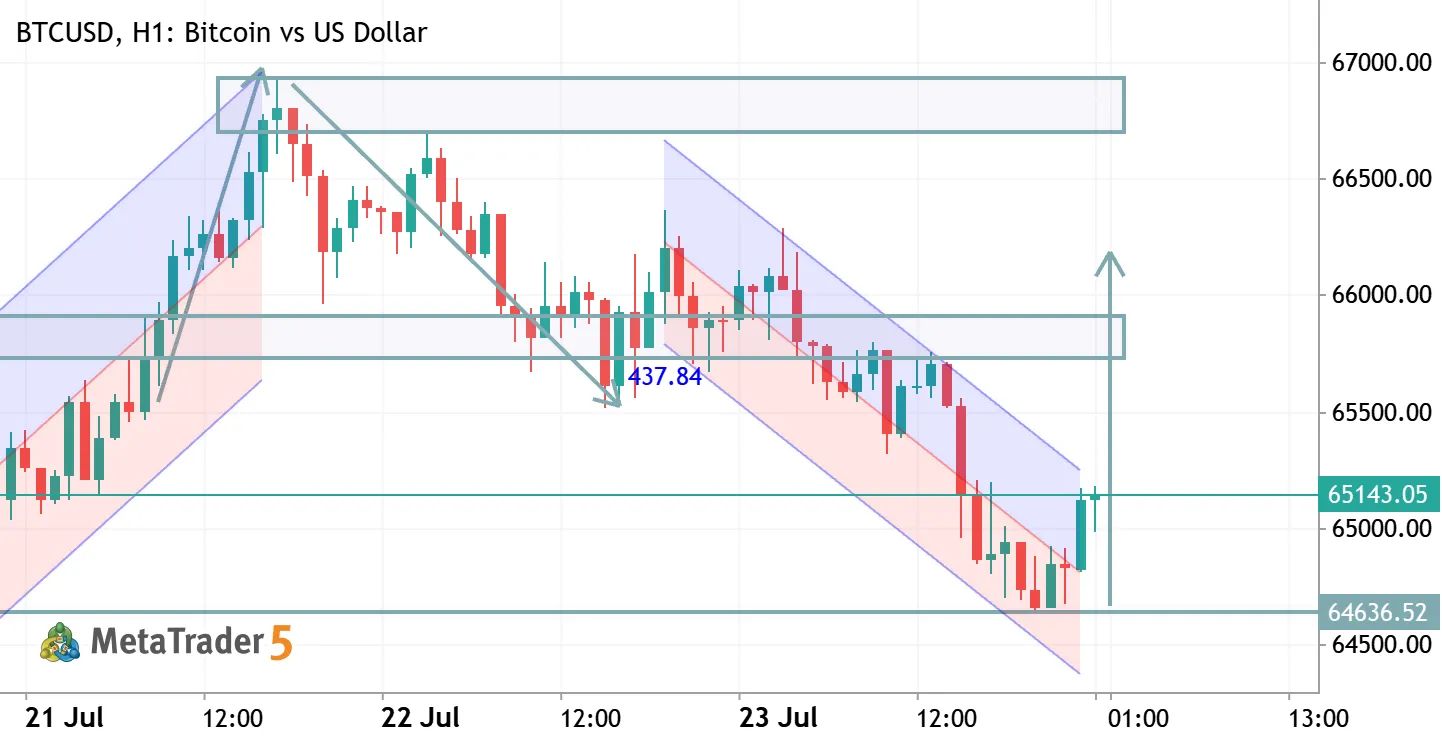
BTCUSD (H1) Bias: Buy Price has bounced from the lower boundary of the descending channel and is attempting a bullish breakout. A sustained close above 65,100–65,200 strengthens the bullish continuation. Buy Entry: 65,100–65,200 (or on a confirmed retest after breakout) Take Profit 1: 65,600 Take Profit 2: 66,000 Take Profit 3: 66,700 Stop Loss: Below 64,650 Summary: Momentum is turning bullish after rejecting channel support. A confirmed breakout above resistance favors further upside toward 65.6K–66.7K
0
HamadJatoi Hamad Jatoi 2026.07.23 22:08